Introduction to Geospatial Concepts
Last updated on 2025-07-02 | Edit this page
Estimated time: 12 minutes
Overview
Questions
- How do I describe the location of a geographic feature on the surface of the earth?
- What is a coordinate reference system (CRS) and how do I describe different types of CRS?
- How do I decide on what CRS to use?
Objectives
After completing this episode, participants should be able to…
- Identify the CRS that is best fit for a specific research question.
The shape of the Earth
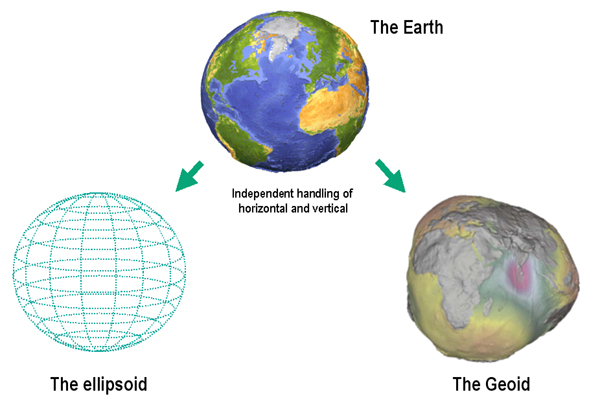
The shape of the Earth is approximately a sphere which is slightly wider than it is tall, and which is called ellipsoid. The true shape of the Earth is an irregular ellipsoid, the so-called geoid, as illustrated in the image below.
The most common and basic representation of the position of points on the Earth is the combination of the geographical latitude and longitude, as shown below.
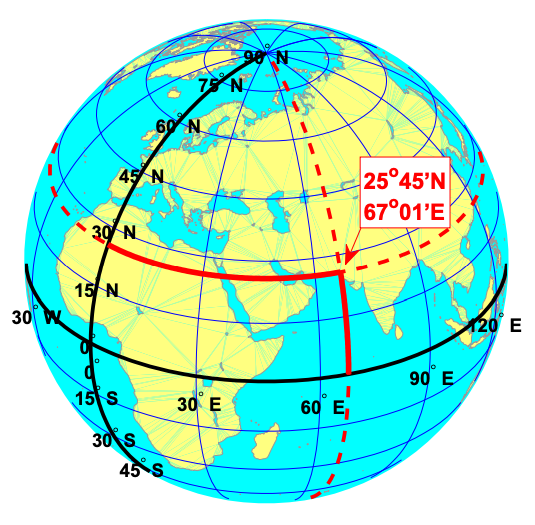
Meridians are vertical circles with constant longitude, called great circles, which run from the North Pole to the South Pole. Parallels are horizontal circles with constant latitude, which are called small circles. Only the equator (the largest parallel) is also a great circle.
The black lines in the figure above show the equator and the prime meridian running through Greenwich, with latitude and longitude labels. The red dotted lines show the meridian and parallel running through Karachi, Pakistan (25°45’N, 67°01’E).
Map projection: From the 3D Earth to a 2D map
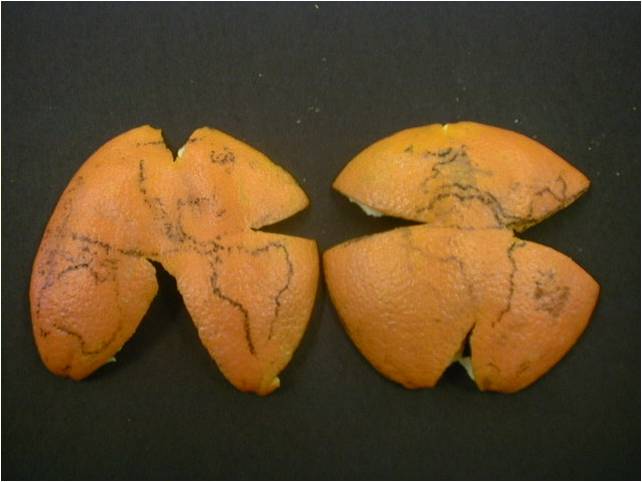
Map projection is a systematic transformation of the latitudes and longitudes of locations on the surface of an ellipsoid into locations on a plane. It is a transformation of the three-dimensional Earth’s surface into its two-dimensional representation on a sheet of paper or computer screen (see the image below for a comparison with flattening an orange peel).
Many different map projections are in use for different purposes. Generally, they can be categorised into the following groups: cylindrical, conic, and azimuthal.
Each map projection introduces a distortion in geometrical elements – distance, angle, and area. Depending on which of these geometrical elements are more relevant for a specific map, we can choose an appropriate map projection. Conformal projections are the best for preserving angles between any two curves, which means preserving the correct shapes of small areas; equal area (equivalent) projections preserve the area or scale; equal distance (conventional) projections are the best for preserving distances.
Coordinate reference systems (CRS)
A coordinate reference system (CRS) is a coordinate-based local, regional or global system for locating geographical entities, which uses a specific map projection. It defines how the two-dimensional, projected map relates to real places on the Earth.
All coordinate reference systems are included in a public registry called the EPSG Geodetic Parameter Dataset (EPSG registry), initiated in 1985 by a member of the European Petroleum Survey Group (EPSG). Each CRS has a unique EPSG code, which makes it possible to easily identify them among the large number of CRS. This is particularly important for transforming spatial data from one CRS to another.
Some of the most commonly used CRS in the Netherlands are the following:
- World Geodetic System 1984 (WGS84) is the best known global reference system (EPSG:4326).
- European Terrestrial Reference System 1989 (ETRS89) is the standard coordinate system for Europe (EPSG:4258).
- The most popular projected CRS in the Netherlands is ‘Stelsel van de Rijksdriehoeksmeting (RD)’ registered in EPSG as ‘Amersfoort / RD New’ (EPSG:28992).
The main parameters of each CRS are the following:
- Datum is a model of the shape of the Earth, which specifies how a coordinate system is linked to the Earth, e.g. how to define the origin of the coordinate axis – where (0,0) is. It has angular units (degrees).
- Projection is mathematical transformation of the angular measurements on the Earth to linear units (e.g. meters) on a flat surface (paper or a computer screen).
- Additional parameters, such as a definition of the centre of the map, are often necessary to create the full CRS.
If you work with data for the Netherlands, you will most likely encounter the two CRS shown in the table below, namely the WGS 84 and Amersfoort / RD New. While WGS 84 is used for data for countries worldwide (for example, for OpenStreetMap data), Amersfoort / RD New is a Dutch local CRS. For other countries, other local CRS are available.
| WGS 84 (EPSG:4326) | Amersfoort / RD New (EPSG:28992) | |
|---|---|---|
| Definition | Dynamic (relies on a datum which is not plate-fixed) | Static (relies on a datum which is plate-fixed) |
| Celestial body | Earth | Earth |
| Ellipsoid | WGS-84 | Bessel 1841 |
| Prime meridian | International Reference Meridian | Greenwich |
| Datum | World Geodetic System 1984 ensemble | Amersfoort |
| Projection | Geographic (uses latitude and longitude for coordinates) | Projected (uses meters for coordinates) |
| Method | Lat/long (Geodetic alias) | Oblique Stereographic Alternative |
| Units | Degrees | Meters |
The figure below shows the same city (Rotterdam) in these two CRS.
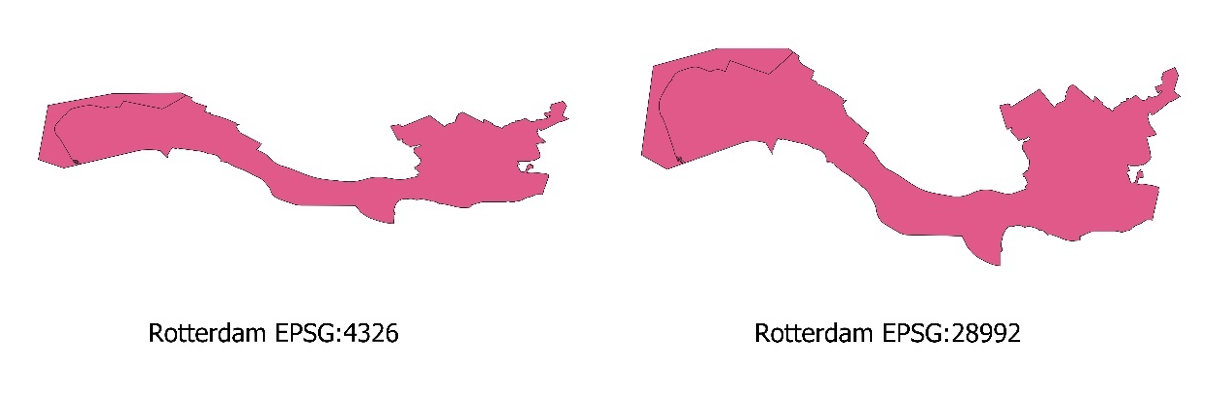
In addition to using different CRS, these two maps of Rotterdam also have different scales.
Map scale
Map scale measures the ratio between distance on a map and the corresponding distance on the ground. For example, on a 1:100 000 scale map, 1cm on the map equals 1km (100 000 cm) on the ground. Map scale can be expressed in the following three ways:
| Verbal: | 1 centimetre represents 250 meters |
| Fraction: | 1:25000 |
| Graphic: |  |
Where is the scale bar?
Note that the maps presented in this lesson do not use a scale bar. Instead, plot axes will serve that purpose.
Types of geospatial data
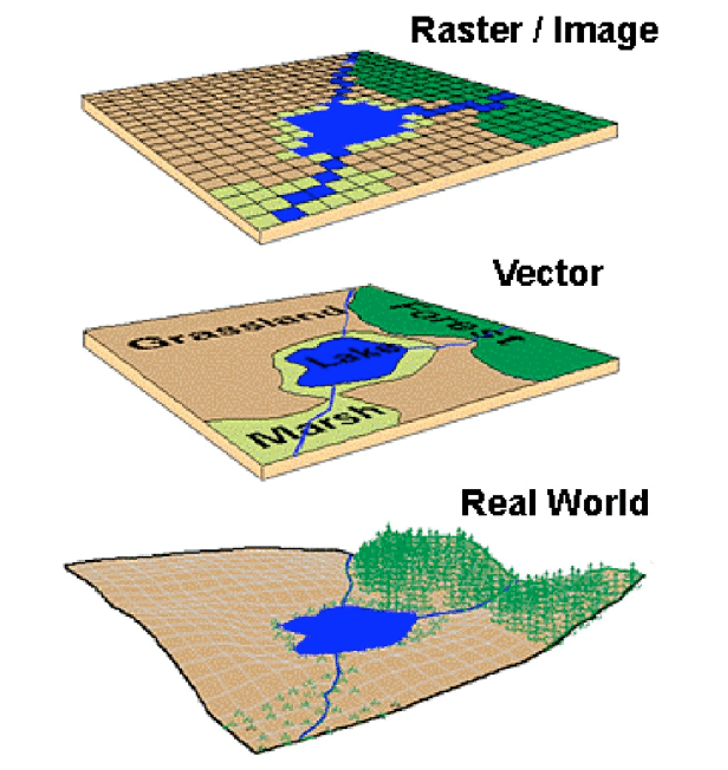
The map of Rotterdam in the figure above shows the area of the city as a discrete feature with precise boundaries. This type of data is called vector. Vector data can have the form of points, lines and polygons (areas).
We can also represent geographical features on the Earth as continuous phenomena and images of the Earth. This type of data is called raster. The figure below shows the two types of geospatial data which can be used to represent the real world, namely vector and raster.
Disambiguating vectors
Vector data in geospatial analysis is not the same as vectors in R. In R, vectors are one-dimensional arrays of elements of the same type, while geospatial vector data is a type of data that represents discrete features with precise boundaries.
Challenge: CRS for calculating areas
You want to investigate which European country has the largest urban area. Which CRS will you use?
- EPSG:4326
- EPSG:28992
- EPSG:3035
Hint: Go to https://epsg.io/ or https://epsg.org/search/by-name and check properties of the given CRS, such as datum, type of map projection, units of measure etc.
Correct answer: c. EPSG:3035
Challenge: CRS for calculating shortest paths
You want to calculate the shortest path between two buildings in Delft. Which CRS will you use?
- EPSG:4326
- EPSG:28992
- EPSG:3035
Hint: Go to https://epsg.io/ or https://epsg.org/search/by-name and check properties of the given CRS, such as datum, type of map projection, units of measure etc.
Correct answer: b. EPSG:28992
References
Knippers, R. (2009): Geometric aspects of mapping. International Institute for Geo-Information Science and Earth Observation (ITC), Enschede. https://kartoweb.itc.nl/geometrics/ (Accessed 22-01-2024)
Saab, D. J. (2003). Conceptualizing space: Mapping schemas as meaningful representations. Unpublished Master’s Thesis, Lesley University, Cambridge, MA, http://www.djsaab.info/thesis/djsaab_thesis.pdf.
United Nations Statistics Division and International Cartographic Association (2012): 3. Plane rectangular coordinate systems – A) The ellipsoid / geoid. https://unstats.un.org/unsd/geoinfo/ungegn/docs/_data_icacourses/_HtmlModules/_Selfstudy/S06/S06_03a.html (Accessed 22-01-2024)
Van der Marel, H. (2014). Reference systems for surveying and mapping. Lecture notes. Faculty of Civil Engineering and Geosciences, Delft University of Technology, Delft, The Netherlands. https://gnss1.tudelft.nl/pub/vdmarel/reader/CTB3310_RefSystems_1-2a_print.pdf (Accessed 22-01-2024)
Useful resources
Campbell, J., Shin, M. E. (2011). Essentials of Geographic Information Systems. Textbooks. 2. https://digitalcommons.liberty.edu/textbooks/2 (Accessed 22-01-2024)
Data Carpentry (2023): Introduction to Geospatial Concepts. Coordinate Reference Systems. https://datacarpentry.org/organization-geospatial/03-crs.html (Accessed 22-01-2024)
GeoRepository (2024): EPSG Geodetic Parameter Dataset https://epsg.org/home.html (Accessed 22-01-2024)
Klokan Technologies GmbH (2022) https://epsg.io/ (Accessed 22-01-2024)
United Nations Statistics Division and International Cartographic Association (2012b): UNGEGN-ICA webcourse on Toponymy. https://unstats.un.org/unsd/geoinfo/ungegn/docs/_data_icacourses/2012_Home.html (Accessed 22-01-2024)
Key Points
Each location on the Earth has its geographical latitude and longitude, which can be transformed on a plane using a map projection.
Depending on the research question, we need a global, regional, or local CRS with suitable properties such as the least possible distortion and an appropriate measurement unit.