Data and Metadata
Last updated on 2023-11-16 | Edit this page
Estimated time: 75 minutes
Overview
Questions
- What is data and what is metadata?
- Which types of metadata exist?
- Where can I find (meta)data in everyday examples?
- What are bad and good enough practices of metadata handling in the scientific context?
Objectives
- Recognize and describe examples of (meta)data
- Name best and worst practice situations in research (meta)data handling
- Getting familiar with the example dataset
Data – Information – Knowledge – Wisdom
Slide set: WhatIsData.pdf
Time estimate: 5 min
- What is data? (direct this question to the audience and allow them to just shout in. Wait a little, it might be quiet 😉)
- We start with an example: Imagine a satellite transmitting data back to earth.
- This is what actually arrives at the machine receiving the transmission…
- just a concatenation of signs…
- we call these glyphs. To a human being, this sequence of glyphs is not understandable and it needs some processing by a machine to make it interpretable for humans. And this is data, …
- a potentially informative object.
- If the data is now processed by the receiving machine, it will be converted in this picture. (The satellite image shows the city center of Cologne, Germany. Feel free to substitute it with a place your learners are familiar with and activate them by asking “Does anyone know, what is depicted?”) This processed form allows humans to interpret and analyze the data to gain information, …
- for example, identifying the cathedral on the image and…
- finding the shortest way from the opera to the cathedral.
- Knowledge is internalized information, like navigating through the streets of Cologne from the opera to the cathedral based on the satellite image you have seen.
- The highest level of information content is wisdom, which means putting the acquired knowledge into context, the bigger picture. Let’s say, you have explored Cologne’s city center for a couple of days and you are approached by a person asking you for the shortest way to the main station. You show them the way on a map - that is wisdom. Naturally, as researchers, we strive to reach wisdom with our work.
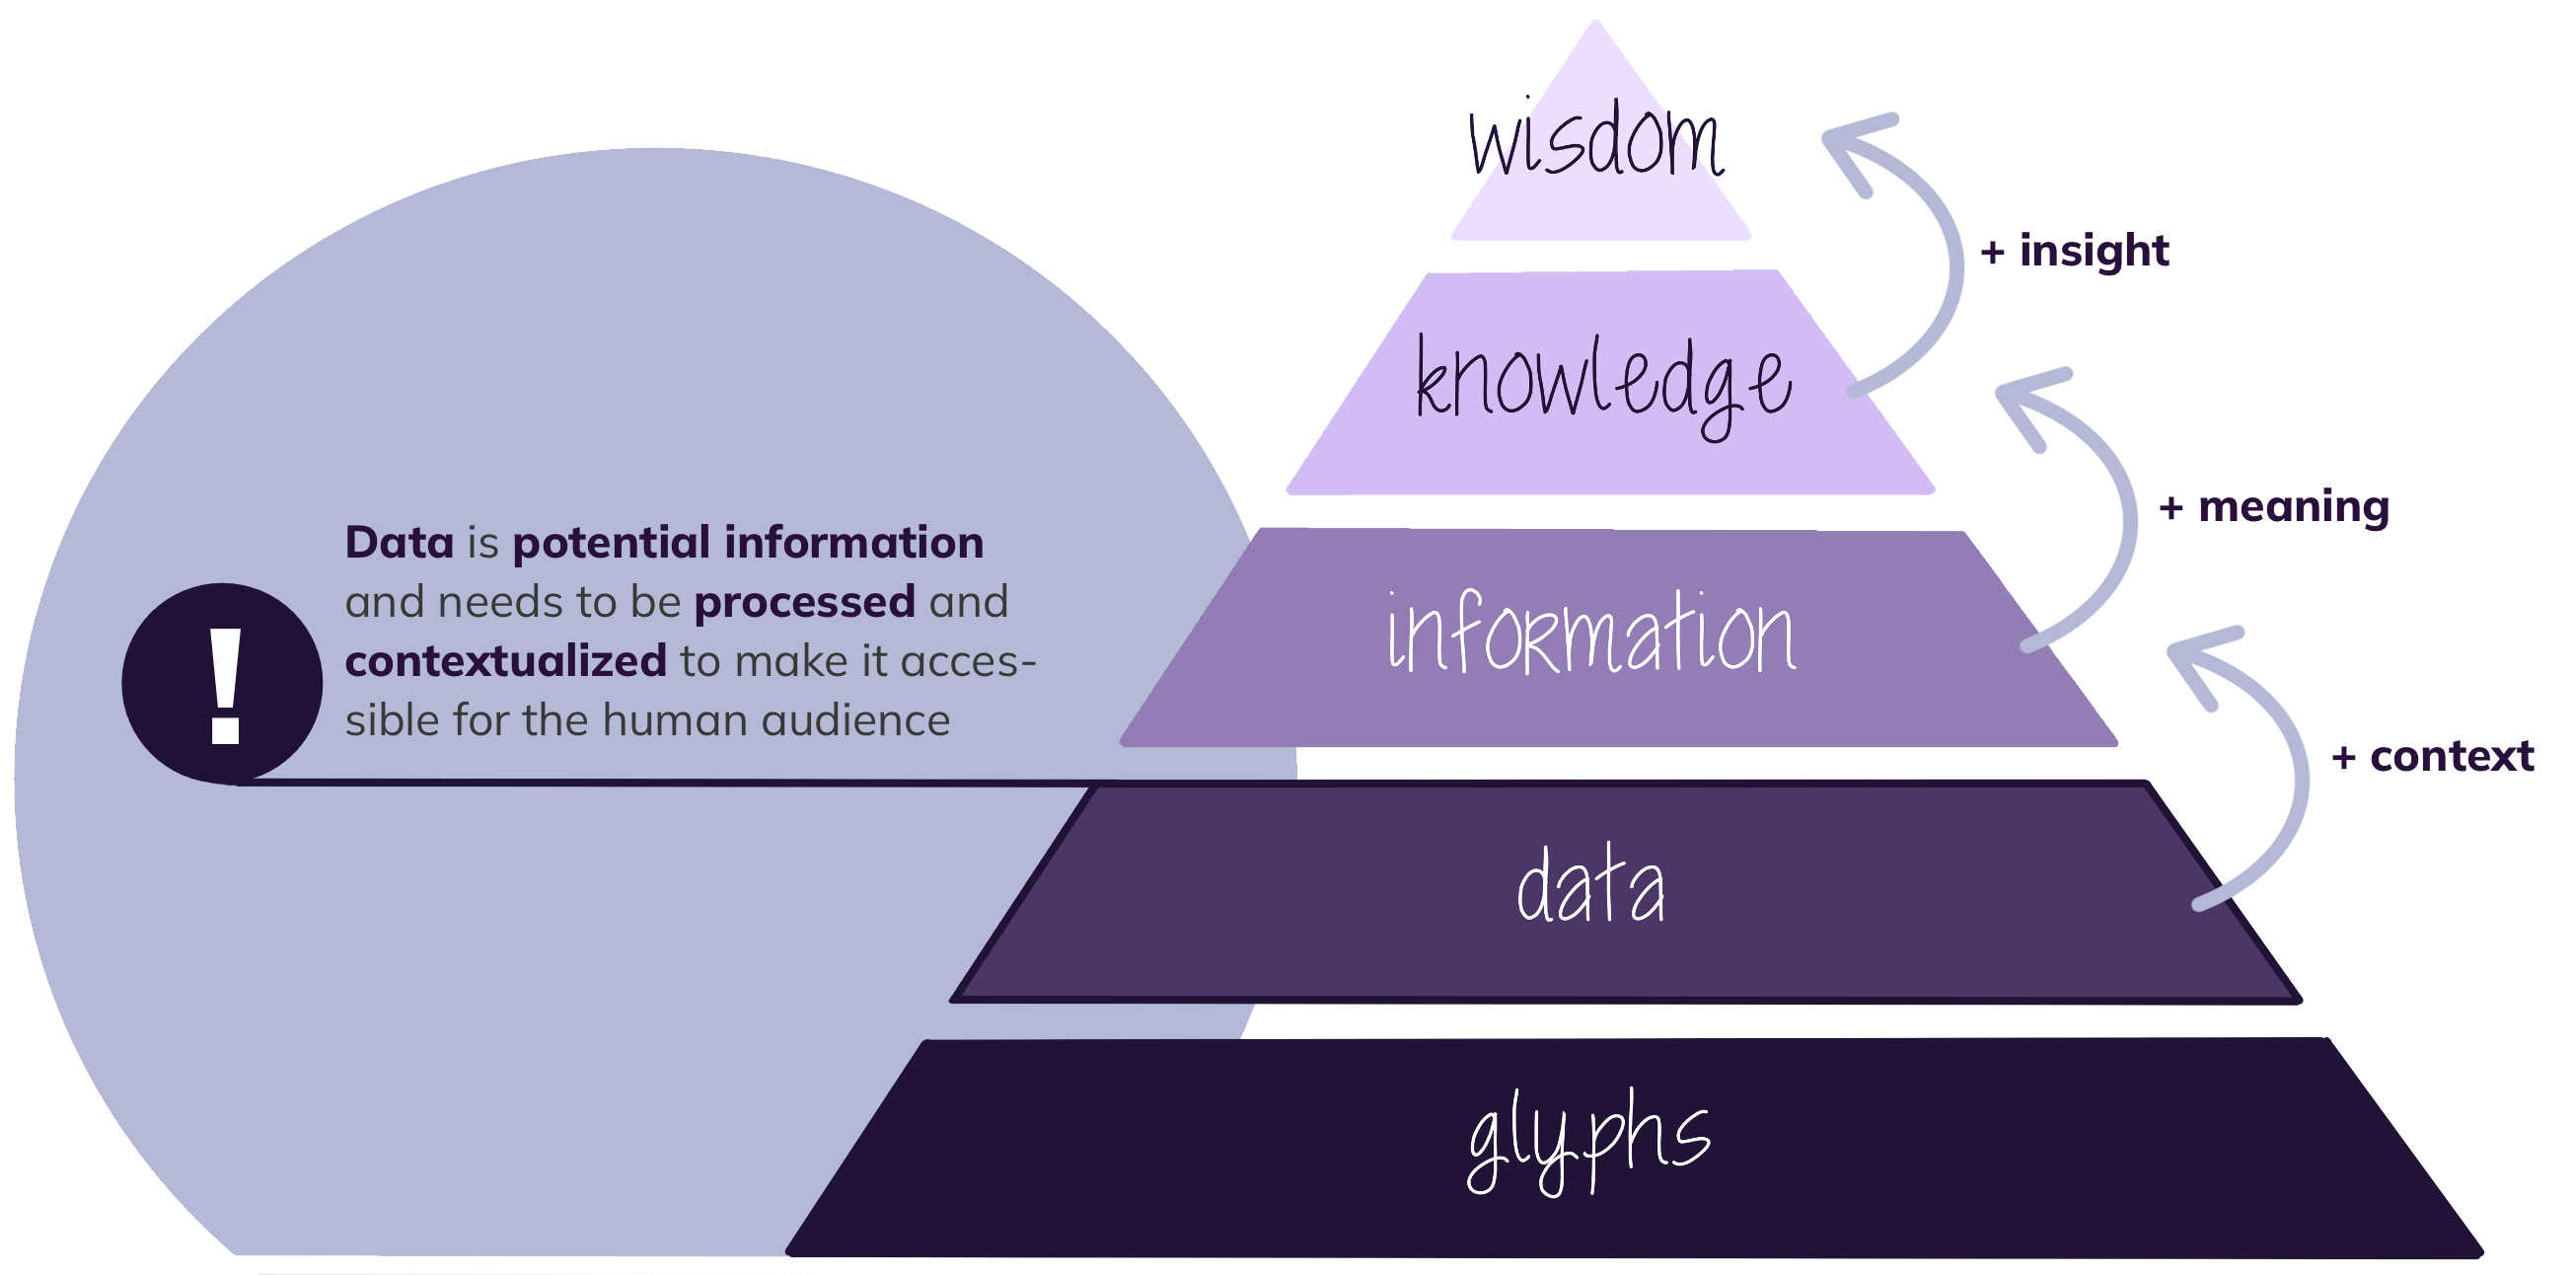
- We have seen, that the information content increases by adding context, meaning, and insight to data.
- The takeaway message is: Data is potential information and needs to be processed and contextualized to make it accessible for the human audience.
Slide set: TheExampleDataObject.pdf
Time estimate: 5 min
- Now back to the example data you received from us. (Here you can reflect on some of the statements made during the introduction session.) What is actually represented in the data is this…
- (Empty slide: open this video in a new tab or window and play it. We start the video from 0:30.)
- Shown in the data is the ride time (t)…
- the biomechanical acceleration of a human body during the rollercoaster ride in x, y, and z axis… (Yes, the image of the toy bunny is really taken from a peer-reviewed journal publication.)
- and a boolean value, stating whether a scream of the test person could be detected or not.
- (Allow some time for questions.)
The question “What is data?” seems trivial at first, but if we look at the definition, it is apparent that the question is not that easy to answer. In information science, we distinguish between Glyphs (or symbols), data, information, knowledge and wisdom. GLYPHS are the smallest unit of data representation. Glyphs represent the symbols of which data can be composed.
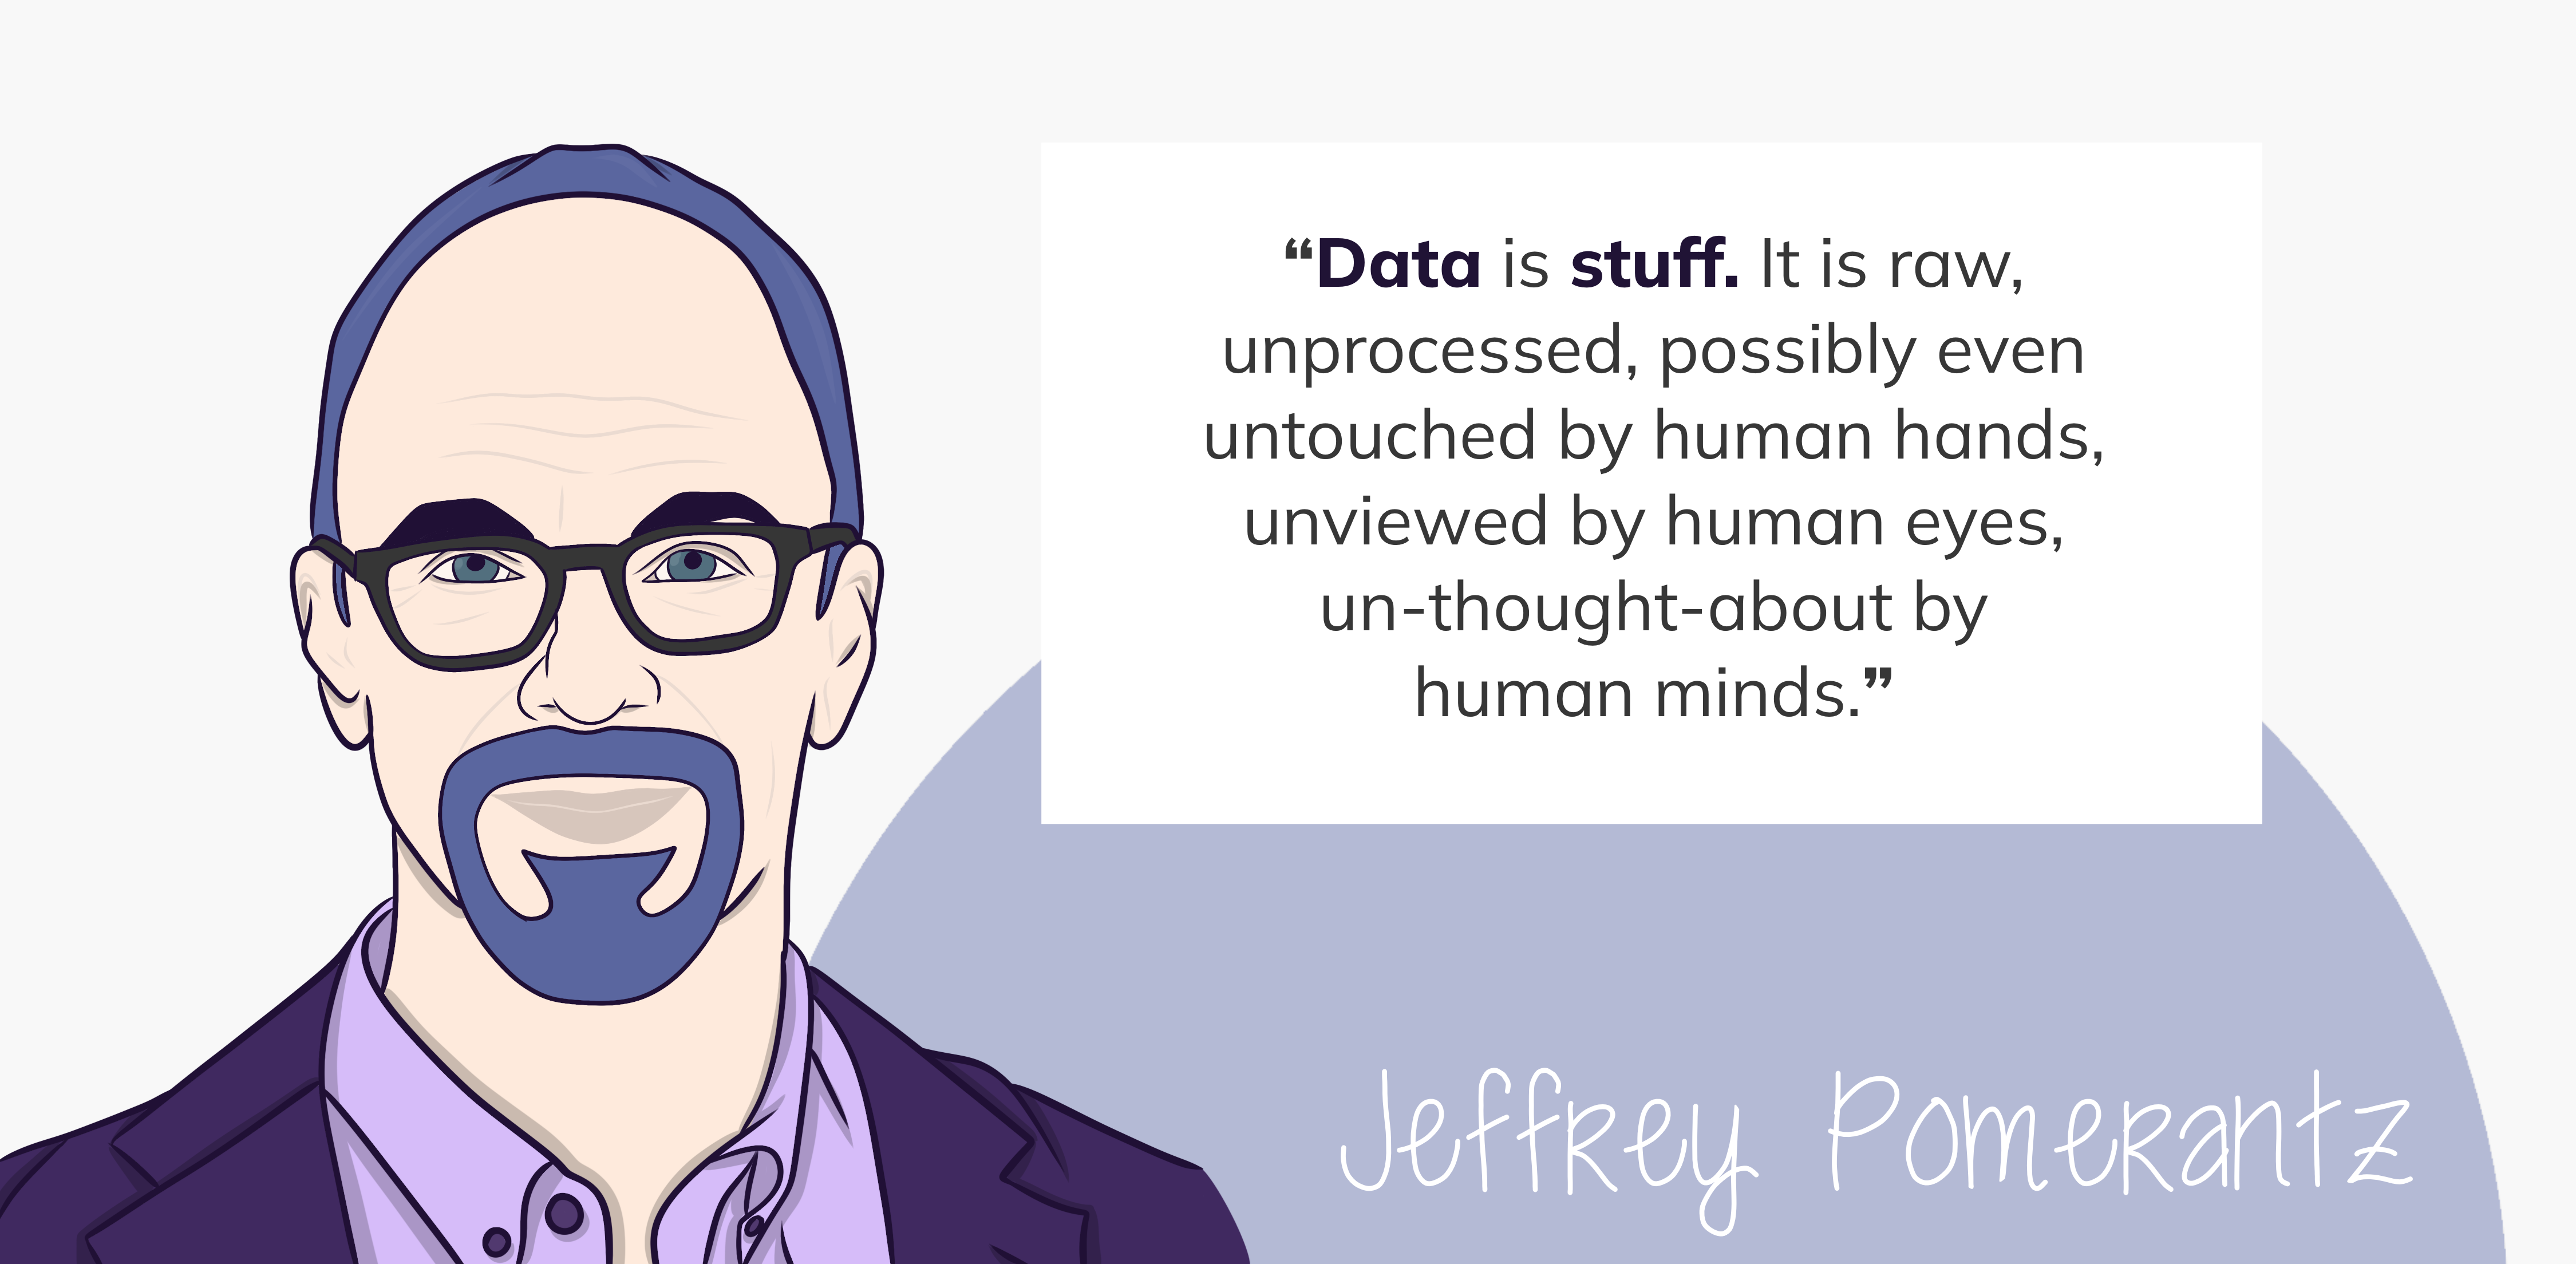
To cite the information scientist Jeffrey Pomerantz, “DATA is stuff. It is raw, unprocessed, possibly even untouched by human hands, unviewed by human eyes, un-thought-about by human minds”1. In other words, data is potential information, that requires processing and context to extract the information held within.
Accordingly, INFORMATION is processed, human-consumable data. If this information is internalized by a human being, it is called KNOWLEDGE. This knowledge can be applied in a broader context by the human being. Applied knowledge is called WISDOM. The key to reaching wisdom from data is processing and contextualizing data to extract information. To achieve this goal we often need to add a description to the data: metadata.
Information pyramid
Metadata
Slide set: WhatIsMetadata.pdf
Time estimate: 5 min
- What is metadata? (Direct this question to the learners and wait for them to reply. They might come up with the generic “Data about data”.)
- Often metadata is described as “data about data”, or - as Merriam Webster puts it - “metadata is data that provides information about other data”. But this is extremely unspecific.
- If you look a bit further, you can find more detailed description of the term “metadata”. Admittedly, these texts are seldomly…
- fun to read.
- Let’s start - again - with an example. Let’s say, you are looking for an informative book about the topic of metadata and decide to look for recommendations online…
- your search will result in about 1.5 million results. But you remember a colleague, that has recently mentioned a very good book on metadata…
- you ask him about it, and he gives you a well-meaning description of said book - “It is black, and the title is ‘metadata’. It was written by Jeff… Jeff… Something.”
- Okay, this is not really precise, but you take this information to your favorite search engine, and it will most likely come back with this …
- book: “Metadata” by Jeffrey Pomerantz, published in the MIT Press Essential Knowledge series. So far, you have absolutely no idea about the content of the book - the actual data it contains. However, with just a few clues on the title, author, and design, you can identify the resource. You did this by using “metadata”. Let’s stay with this example for a bit and take a look inside…
Slide set: DescriptiveAdministrativeStructuralMetadata.pdf
Time estimate: 5 min
- On one of the first pages, you will find a lot of information about the book…
- You will get information about the author, publisher, relevant keywords and so on, that are descriptive in nature and can help you - or librarians - to successfully identify this specific book. Among these there is a very important descriptor…
- The persistent identifier. In the example of a book, this is the ISBN. Whenever you look up this number, the result will unambiguously point to this specific title.
- Furthermore, you will get information about how the book is administered: How it is distributed, who is responsible for its distribution and which conditions need to apply.
- You can also find information on legal conditions that apply to this resource, such as copyright issues and the terms of distribution. Legal information can be considered as a subset of administrative information.
- And - really important - you will get a precise idea about the book’s structure and how you can navigate it: the chapters, its general content and how it is distributed over the pages. But still: we have not yet read a single word, that actually delivers the content of the book - its data.
- So, metadata - or metainformation - is more or less structured data, that contains information about characteristics of other data (objects).
- Let’s briefly reflect on the types of metadata, that we came across so far, before we apply these concepts in the first challenge for today:
- descriptive metadata holds information about the intellectual content, such as title, author, abstract…
- administrative metadata specifies how a resource is managed. This includes things such as the terms of (re-)distribution and copyright information. This also includes technical information about the data (such as files included in a dataset) or versioning information…
- structural metadata describe, for example, chapters in a book, files in a dataset, or software components.
- (Allow some time for questions.)
Metadata is (semi-)structured data that provides information about characteristics of other (more complex) data objects (e.g. files or documents). Regarding research data, metadata gives the observer the necessary context to interpret the data and derive information from it. Although metadata is data itself, it only is meaningful in connection with a data object that is described by the metadata record (e.g. the meta-information in a book about said book). Metadata can be found inside of a data object (e.g. in a book, in a data record) or as a separate object (e.g. library catalogue, separate file).
National Information Standards Organization (NISO, 2004, from “Big Data, Little Data, No Data”, Christine L. Borgman, 2015): “Metadata is structured information that describes, explains, locates, or otherwise makes it easier to retrieve, use or manage an information resource”.
Types of Metadata
Descriptive metadata provides information about the intellectual content of a (digital) object (e.g. title, author, date of publication, subject, description, unique identifier). 2
Administrative metadata provides information to support the management of a resource (e.g. technical information regarding the file’s creation and format, version, information about copyright, licence and intellectual property rights). 2
Structural metadata specifies the relationships between components of a (digital) object and between different (digital) objects (e.g. chapters in a book). 2
Slide set: Challenge1Introduction.pdf
Time: 15 min
Challenge type: guided confrontation, individual investigation, discussion
Objective:
The learners experience a real-world
example of functional metadata applications and practice their acquired
knowledge on metadata types.
Implementation:
We recommend using a
pre-structured, collaborative document (whiteboard or notepad) to
collect the participants’ results. Allow some time for the learners to
navigate the websites and explore the metadata in the source code
individually (ca. 8 min). Open the source code of one website in the
browser and share the screen. Talking points for the guided
confrontation can be:
- different types of targets (e.g.
twitter:,robots:) - different contexts (e.g.
dc:,og:); don’t go too deep into this topic, and just give a teaser about the existence of metadata standards and references -
Fun fact: The Guardian regularly uses a
comment in the
headof their HTML documents to advertise IT jobs 😁
Whiteboard: example setup
Challenge 1: Real-world metadata
- Open one of these web pages in your preferred browser:
- Open one of the articles linked on the main page.
- Inspect the web page source code.
| Browser | Shortcut to Source Code |
|---|---|
| Firefox | Ctrl + u |
| Chrome | Ctrl + u |
| Safari | Option + Command + u |
| Opera | Ctrl + u |
| Edge | Ctrl + u |
| Internet Explorer | Ctrl + u |
- Look for meta
tags in the HTML source code
<head>element. - Assign some
<meta>tags to one of the categories descriptive, administrative, structural
Metadata records
Slide set: MetadataInScience.pdf
Time estimate: 10 min
- Now let’s shift our focus to metadata annotation in the scientific context.
- I’m sure many of us have been in a similar situation. You start a new project that is based on the work of your predecessor or collaborators and you are supposed to start with reproducing the published results…
- You take a look at the accompanying publication and the data looks neat…
- But as soon as you open the underlying datasets, understanding the process of how this data was acquired is not so straightforward anymore. The variables might be hard to understand, there might be missing values, and the performed data cleaning is not necessarily apparent.
- So you take a look at the experiment’s documentation…
- A study by Monya Baker, which was published in Nature in 2016 was able to show, that more than 70% of researchers have tried and failed to reproduce another scientist’s experiments. And more than half have even failed to reproduce their own experiments.
- A rather bad practice that you can encounter in your scientific life is surely data, saved under an uninformative file name, with no documentation whatsoever.
- Slightly better practice are lab notes, which are still widely used as the go-to documentation method in experimental scientific areas. Using lab notes as documentation method, you can facilitate the findability…
- by assigning meaningful file names and dates to your data. However…
- lab notes come with various disadvantages. Lab notes are usually taken continuously and over the course of a 3-year contract, several hundred pages of lab notes can accumulate.
- so even though lab notes allow for some kind of documentation, they are largely unstructured and subjective, rarely following templates or guidelines. Continuously taking notes makes the documentation hard to retrieve. The notes are physically separated from the data they describe and remain in the hand of the experimenter or institution hosting the experiments, which makes them hard to share. And let’s admit it - handwriting can be a pain to read.
- One way to store your documentation with your data, is README-style metadata…
- Just like taking lab notes, README-style files can be simple, subjectively written natural text documents.
- You can also find templates for README-style metadata records. Sticking to these templates will allow for increased structure in your documentation records. Now that we document our data digitally, we have increased options to link the metadata to the described dataset, for example by naming them accordingly…
- If you now want to find the results of a specific experiment on your computer, a local keyword search can help you to identify the dataset.
- To sum up, digital documentation of your metadata in form of README-style metadata records, facilitates the linkage of data and metadata, allows for local searchability and increased readability, and the digital nature of the README file simplifies targeted sharing of the documentation. However, these records are still rather unstructured and subjective, and only allow for keyword searches.
- If you want to have a look at a well-designed template for README-style metadata records, a recommended link is provided in the episode description.
- (Allow some time for questions.)
Handwritten (lab) notes Handwritten (lab) notes are still a common practice in many scientific disciplines. These notes are easy to take during data generation. The greatest disadvantage, however, is the physical separation from the data itself and the difficulty to find, store and share this information. Often, handwritten lab notes do not follow a predictable structure and, hence, are hard to interpret and sometimes even hard to read.
Readme style text documents Recording your metadata
(additionally) in a digital README-style text document
comes with one great advantage: the metadata can be associated and
stored directly with the experimental data. README-style
metadata best practices include:3
- creating one
READMEfile for each data file, whenever possible. - naming the
READMEin a way that it is easily associated with the data file(s) it describes. - writing the
READMEdocument as a plain text file avoids proprietary data formats. - structuring multiple
READMEfiles identically. - where possible follow established conventions for scientific vocabulary (i.e. from glossaries or resources such as the IUPAC Gold book)
We strongly recommend to use this
template for README-style metadata
documents.4
Time: 15 min
Type: guided confrontation, collaboration
Objective:
The learners apply their acquired
knowledge about metadata identification and types in the context of a
familiar work situation.
Implementation:
- select a scientific journal publication of your liking (could be related to the research field of the learners, if the group is homogeneous in this regard.)
- share the publication on your screen
- with the whole group of learners, find the “hidden” metadata in the publication and sort the findings into the metadata types (descriptive, administrative, structural)
Creator’s recommendation:
Use a whiteboard
application to display the journal publication. This allows for
simultaneous highlighting / annotation of the findings and thus gives a
visual response and documentation of the discussion.
We recommend a 15 min break at this point.
Key Points
- Data is potential information.
- The boundaries between data and metadata are blurred and depend on the context.
-
Scientific meta information is often recorded in
handwritten (lab) notes. A better - though still limited - solution, is
the documentation of scientific metadata in accompanying
READMEfiles
Pomerantz, J. (2015). Metadata. The MIT Press. https://doi.org/10.7551/mitpress/10237.001.0001↩︎
Zhang, A. B., Gourley, D. (2008). Metadata strategy in Creating Digital Collections: a practical Guide. Sawston, UK: Woodhead Publishing.↩︎
Chadwick, I. (2016). Research Data Management: guide to writing ”readme” type metadata. The Open University. https://www.open.ac.uk/library-research-support/sites/www.open.ac.uk.library-research-support/files/files/RDM-Guidelines-for-creating-readme-style-metadata.pdf↩︎
Guide to writing “readme” style metadata – Cornell Data Services. (n.d.). https://data.research.cornell.edu/data-management/sharing/readme/↩︎