A Brief Introduction to Machine Learning
Overview
Teaching: 15 min
Exercises: 5 minQuestions
What is machine learning?
What specific tools will this lesson cover?
Objectives
Give a brief definition of machine learning.
Distinguish between classification and regression models.
Describe the specific methods that this lesson will focus on.
What is Machine Learning?
Broadly speaking, machine learning encompasses a range of techniques and algorithms for gaining insights from large data sets. In this lesson, we will focus on supervised learning for tabular data.
-
Tabular data takes the form of a data frame. The methods we consider can apply to a variety of data frames, from large to very large (e.g., up to 1,000’s of columns/variables and 100,000’s of rows/observations, or more).
-
Supervised learning methods build models that predict output values of a function, given some example input and output values. In our context, the output of this function will typically have the form of one of the columns of our data frame, while the input has the form of the remaining columns.
Given a data frame, we will build machine learning models as follows.
-
Divide the data set into a training set and a testing set. Typically the training set will contain about 60% to 80% of the rows, while the testing set comprises the remaining rows. This train/test split is selected randomly.
-
Train the model on the training set. Part of this process may involve tuning: tweaking various model settings (i.e., hyperparameters) for optimal performance.
-
Test the performance of the model using the testing set. Since the testing set was not used in the training of the model, the testing performance will be a good indication of how well our model will perform on future (unknown) input values.
Once our model is built, we can use it to predict output values from new cases of input, and we can also examine the structure of the model to infer the nature of the relationship between the input and the output.
Example: Kyphosis Data Set
To illustrate the above definitions, consider the kyphosis data set, which is included in the rpart package.
library(rpart)
str(kyphosis)
'data.frame':	81 obs. of  4 variables:
 $ Kyphosis: Factor w/ 2 levels "absent","present": 1 1 2 1 1 1 1 1 1 2 ...
 $ Age     : int  71 158 128 2 1 1 61 37 113 59 ...
 $ Number  : int  3 3 4 5 4 2 2 3 2 6 ...
 $ Start   : int  5 14 5 1 15 16 17 16 16 12 ...
For a description of this data set, you can view the help menu for kyphosis.
?kyphosis
For example, in a later episode we will build a model that will predict whether a post-op kyphosis will be present (the output), given the age of the patient, the number of vertebrae involved, and the number of the first vertebra operated on (the input). We will train our model on a selection of rows of this data frame (e.g., about 60 randomly selected rows) and then test it on the remaining rows.
Let’s spend a few minutes exploring this data set.
summary(kyphosis)
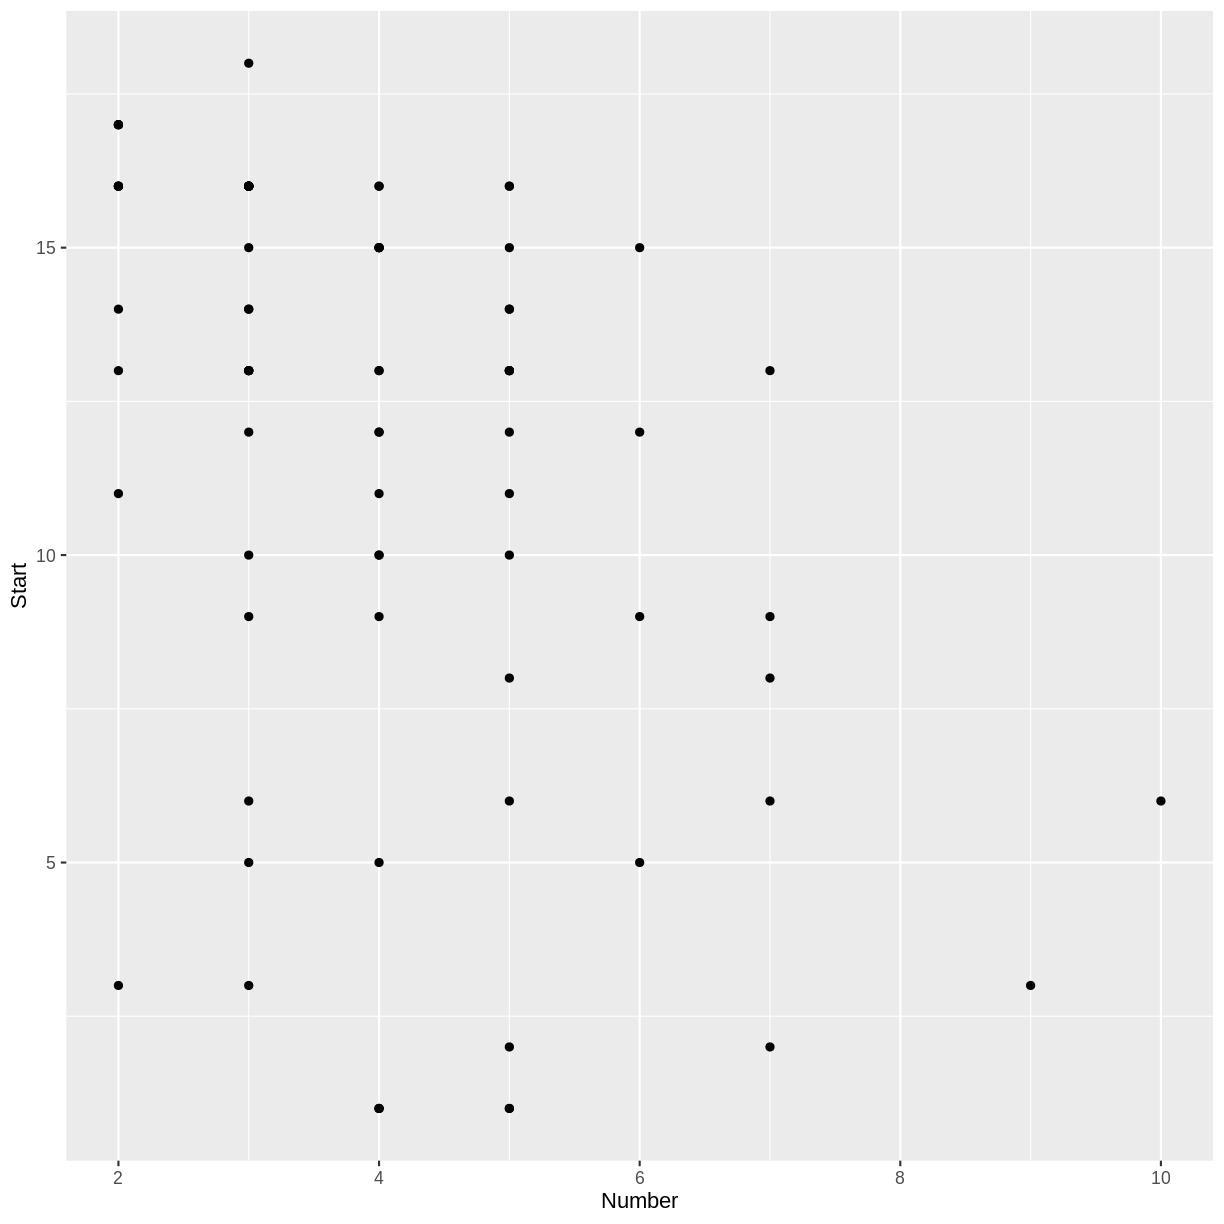
Notice that only 17 of the 81 cases in our data set indicate the presence of a kyphosis. Try making a scatterplot of two of the quantitative variables.
library(tidyverse)
ggplot(kyphosis, aes(x = Number, y = Start)) + geom_point()

Challenge: Number and Start
Do you notice a trend in the scatterplot of
Startvs.Number? In the context of thekyphosisdata, why would there be such a trend?Solution
There appears to be a weak, negative association between
NumberandStart: larger values ofNumbercorrespond to smaller values ofStart. This correspondence makes sense, because if more vertebrae are involved, the topmost vertebra would have to be higher up. (The vertebrae are numbered starting from the top.)
Classification vs. Regression
In the jargon of machine learning, a model that predicts a categorical output variable is called a classification model, while one that predicts a quantitative (numeric) output is called a regression model. Note: this terminology conflicts slightly with the common use of the term “regression” in statistics.
Our Focus
This lesson will focus on three machine learning methods that apply to both classification and regression problems.
- Decision Trees
- Random Forests
- Gradient Boosted Trees
We will also briefly explore classical linear and logistic regression, which we can view as simple examples of supervised learning. We will not dwell on the mathematical theory or algorithmic details of these methods. Interested learners are encouraged to consult An Introduction to Statistical Learning, by James, Witten, Hastie, and Tibshirani.
One of the main goals of this lesson is to help learners develop their R coding skills, especially for the purpose of using the available machine learning packages on the Comprehensive R Archive Network (CRAN). We will focus on the packages randomForest and xgboost, but many other packages are described in the CRAN Machine Learning Task View.
Key Points
There are many types of machine learning.
We will focus on some methods that work well with tabular data.