Guided Tour
If you close the ml4bio software, you can relaunch it by running the same install_launch script you used to install the software originally.
Once you open the ml4bio software, you will see the following interface. It may look slightly different in newer versions of ml4bio.
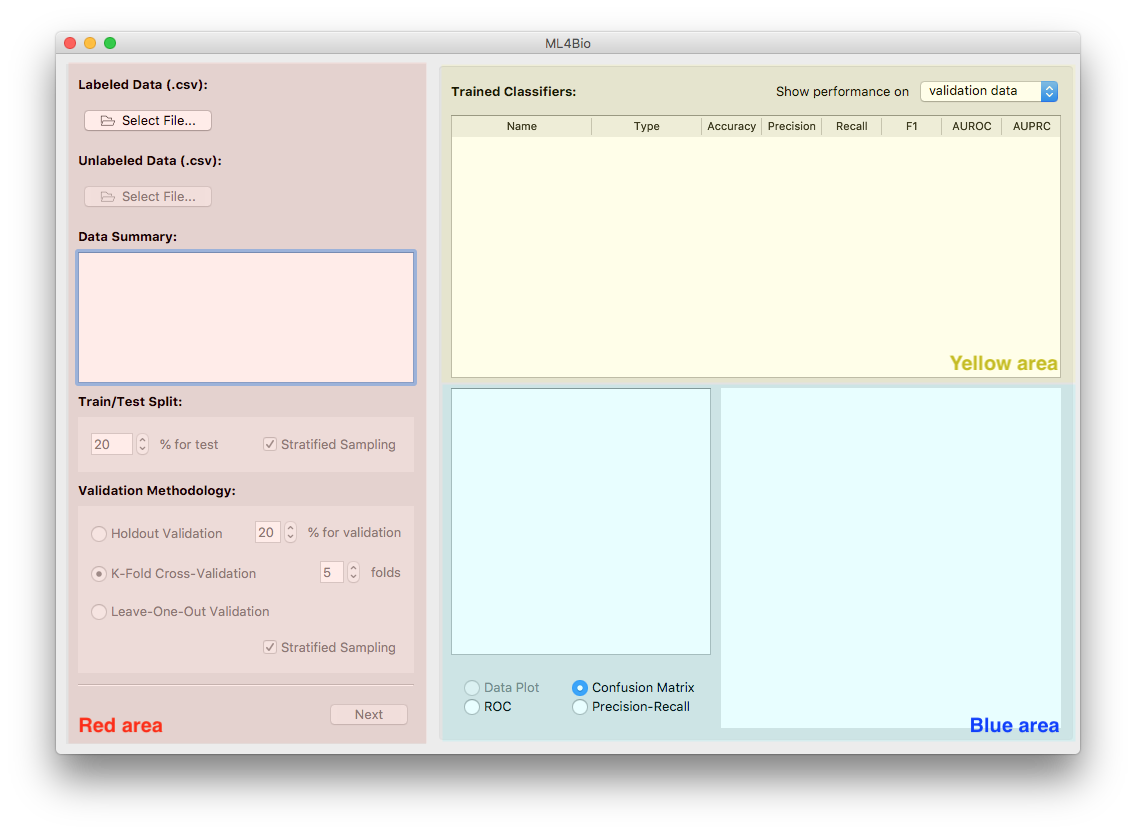
The interface can be divided into three areas:
-
Red area. This is the main area you operate on. It consists of three pages. The first page allows you to load data, split data and choose a validation method. The second page is where you train classifiers. The last page is for testing and prediction.
-
Yellow area. This is where trained classifiers are listed. An entry will be added after a classifier is trained. Each entry contains six useful performance metrics that assist you in classifier evaluation and selection. You will find this area helpful when you train, evaluate and test classifiers.
-
Blue area. This area is for data provenance and visualization. Once a classifier in the yellow area is selected, you may examine its hyperparameters, performance metrics and plots using the interface provided in this area.
We illustrate the use of the software by working through an example. The interface may differ slightly on different operating systems.
Step 1: Select data
Load Data
Software
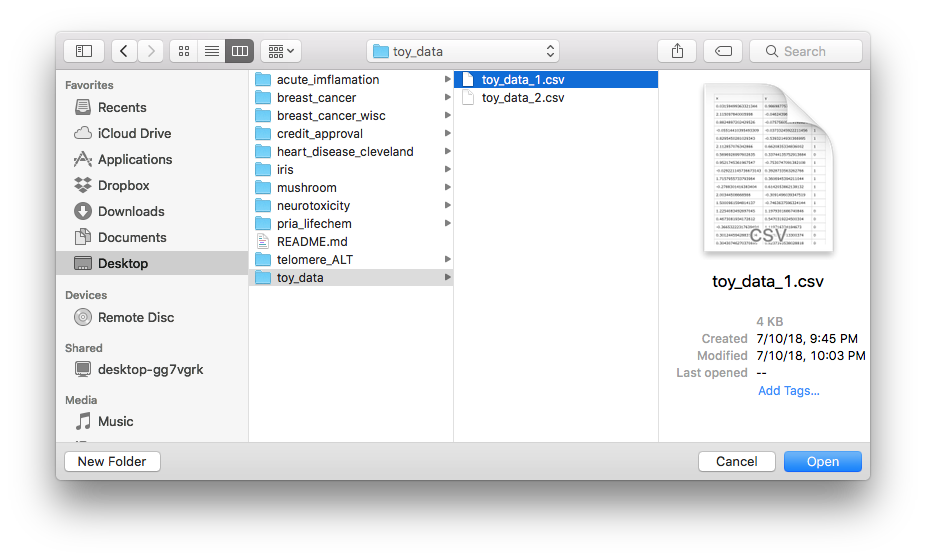
Load toy_data_1.csv file from the data/toy_data by clicking on Select File….
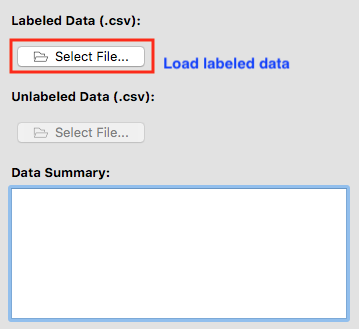
After a valid labeled dataset is loaded, the file name will be shown next to Select File….
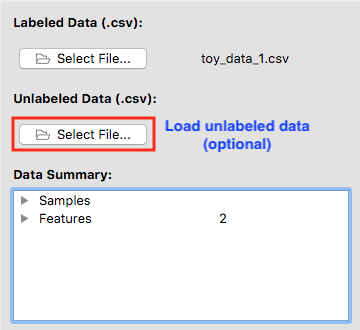
You may optionally load an unlabeled dataset that pairs up with the labeled one. The two datasets must have the same column names except that the label column is missing in the unlabeled data. After you trained a classifier, you may make predictions on the unlabeled data.
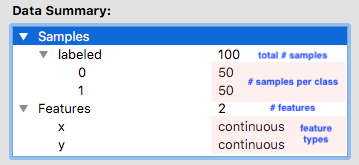
A summary of the dataset(s) is displayed in a tree structure. You may unfold the bullets to see more details. There are a total of 150 samples in the dataset we loaded. A third them belong to class 0, a third to a class 1 and the last third to class 2. The dataset has only two features, namely x and y. Both of them are continous.
Split Data
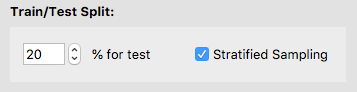
In the lesson Classifying T-cells we will go into details how to split a dataset. For now, splitting data means deciding how much data you want to set aside for testing. You may adjust the percent of test data and decide whether or not to split the data in a stratified fashion. We reserve 20% of the labeled dataset for testing by default.
Choose a Validation Method
Choose from one of the three supported validation strategies. Adjust the values accordingly. In this workshop, we use Holdout Validation by default.
Software
We are ready for training classifiers. Click on Next to go to the next page.
Step 2: Train Classifiers
Software
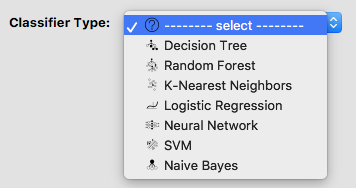
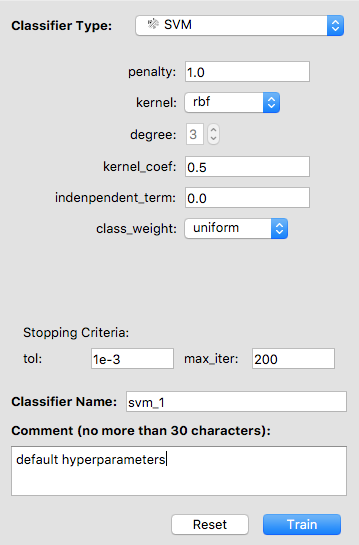
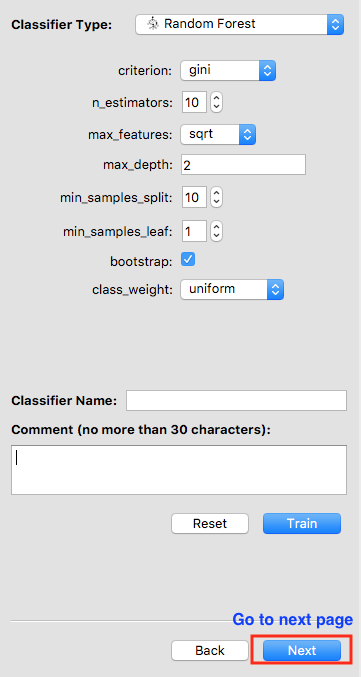
Use the drop-down menu to select a classifier type. We select SVM (i.e. support vector machine).
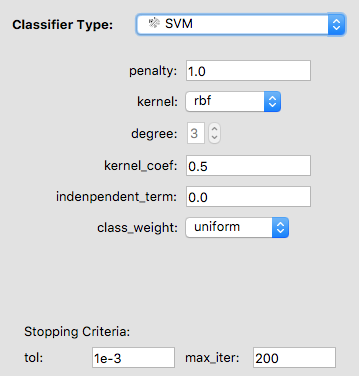
A list of hyperparameters for an SVM shows up. Each classifier has its own hyperparameters specific to that classifier that can be tuned. Intuitively, think of the hyperparameters as settings. You can adjust each hyperparameter to get the perfect setting. To relate this to machine learning, each hyperparameters is adjusted for an algorithm for it to get to desirable performance.
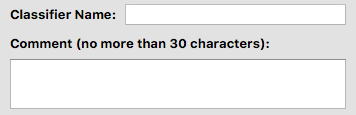
You may give your classifier a name and add a comment. If you do not specify a name, the software will use “classifier_[int]” as its default name. For example, if the classifier is the third one you trained, its default name is “classifier_3”.
Train and Evaluate Classifiers
Now everything has been set up for training an SVM.
Software
If you changed the hyperparameters but want to start over, click on Reset. The hyperparameters will be back to default. Otherwise, click on Train.
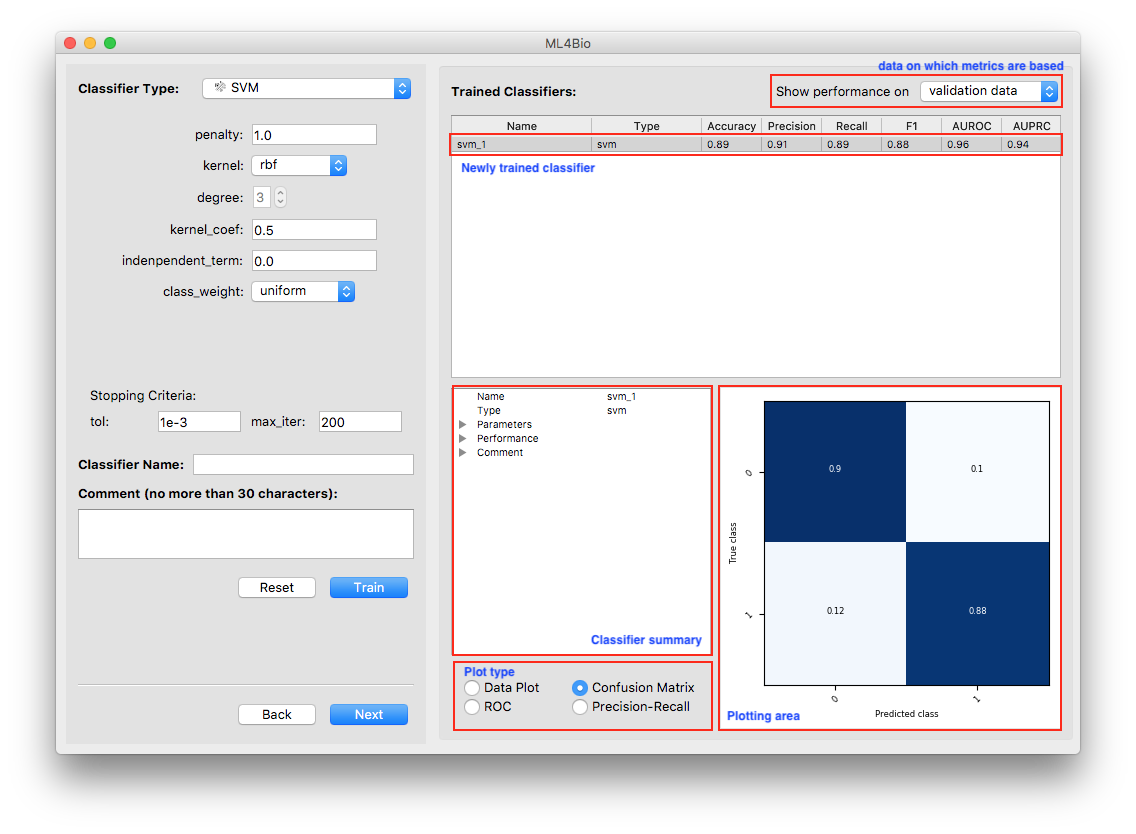
In the yellow area, a new entry was added to the list. It includes the name, type and the six performance metrics of the newly trained classifier. Note that the metrics are all with respect to the type of data, training or validation, shown at the top-right corner of the yellow area.
There are a few things you can do at this stage:
- Examine classifier summary. A summary of the newly trained classifier is presented in the blue area. As with data summary, you may unfold the bullets to see more details.
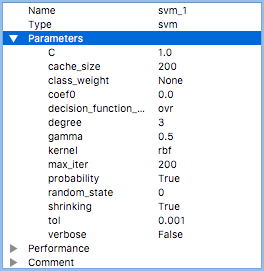
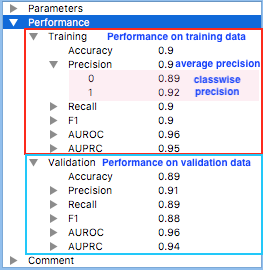
The left figure shows a complete list of classifier hyperparameters. Some of them were exposed to you for tuning, others were fixed by the software. You may learn more about the hyperparameters from the sklearn documentation.
The right figure shows the classifier’s performance with respect to different types of data. For each metric, classwise values as well as their average are computed. For example, the precision of the classifier on class 0 on the training data is 0.89. The classifier’s overall precision on the training data is 0.9. These evaluation metrics will be discussed later in the workshop. For now, all you need to know is that in general higher numbers indicate better performance.
- Examine plots. Three types of plots that reflect the classifier’s performance are always available. The data plot is only available when the dataset contains exactly two continuous features. Note that the plots are all with respect to the type of data shown at the top-right corner of the yellow area.
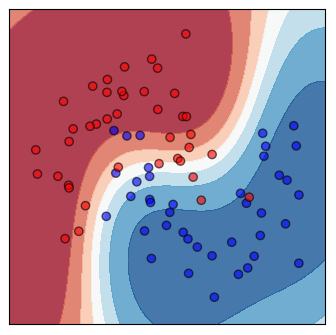
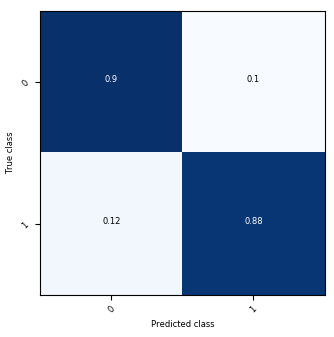
Shown on the left is a scatter plot of the training data and contours of the decision regions. The darker the color, the more confident the classifier is. Shown on the right is the confusion matrix.
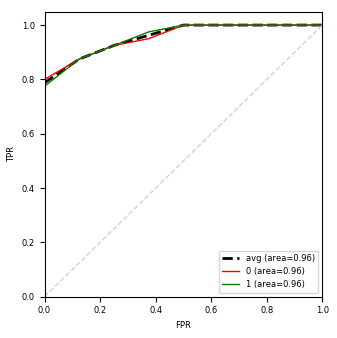
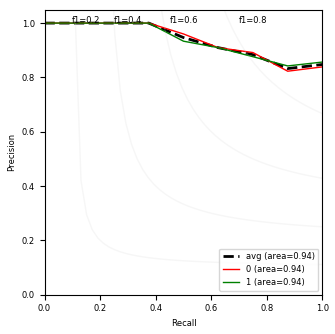
The left figure includes ROC curves and the right one includes precision-recall curves. A curve is plotted for each class. The average curve is the unweighted average of all classwise curves.
Software
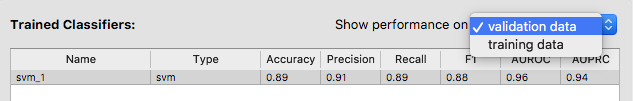
Switch between performance on different data types.
You may want to compare the classifier’s performance on training and validation data to see how well it generalizes. Use the drop-down menu at the top-right corner of the yellow area to switch between performance on different types of data. This is important to remember for the rest of the workshop.
Typically, you will train and evaluate many classifiers before you find one that you are satisfied with.
Software Task
Using the software, train as many classifiers as you want. Using the software, train k-nearest neighbor classifier.
You may click on the header of the list to sort the classifiers by a particular metric. For example, if you click on Accuracy, the classifiers will be listed in descending order of accuracy.
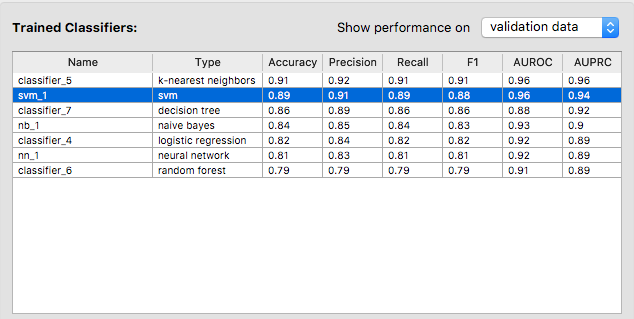
It seems that the SVM we trained first is the second best classifier in terms of accuracy. The best one is a k-nearest neighbor classifier that achieves 100% accuracy on the validation data.
Software
Let’s say we are happy about the k-nearest neighbor classifier. Click on Next to proceed to the next page. However, if you want to change, say, the validation method, you may click on Back, which will bring you to the previous page.
Be careful, because all trained classfiers will be lost if you do so.
Step 3: Test and Predict
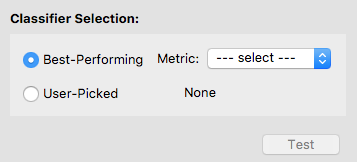
We are done with training and ready to select a classifier for testing. However, if you changed your mind and decided to train more classifiers, you have a chance to return to the previous page by clicking on Back.
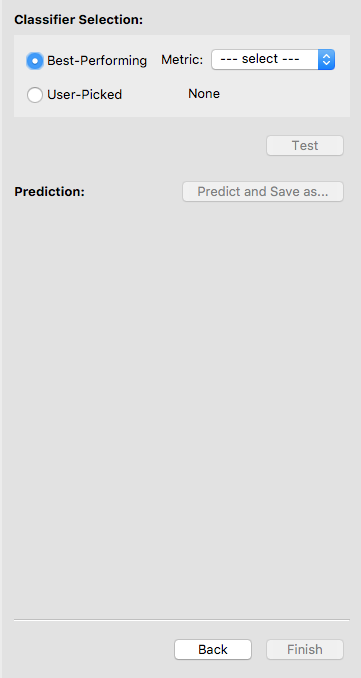
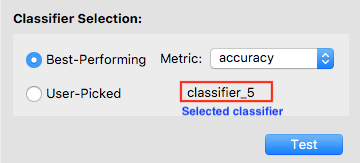
To select a classifier, you may let the software pick one for you by specifying a metric. In this case, the software will select the best classifier with respect to that metric. Otherwise, you may pick a classifier on your own. We let the software select the classifier with the highest accuracy.
After a classifier is selected, its name will show up. Double-check that it is the one you want to test. Now the Test button is enabled, and you may click on it to test the selected classifier. Note that once you hit Test, you are no longer allowed to go back and train more classifiers.
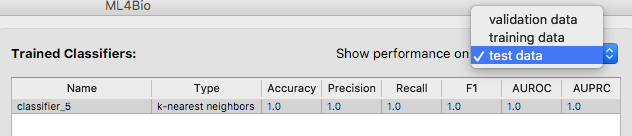
Now the only classifier in the list is the tested one. Note that the software is showing the classifier’s performance on the test data. You may examine the performance using either the summary or the plots.
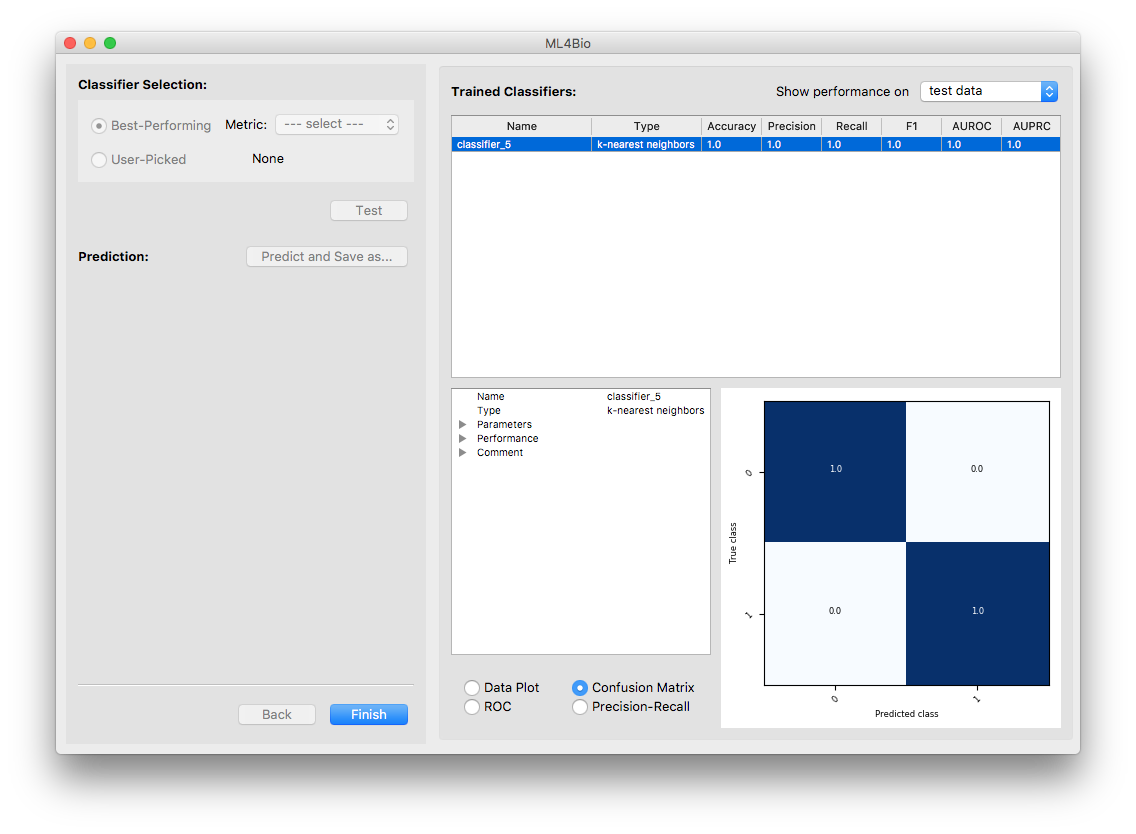
Although not recommended, you are allowed to test any of the other trained classifiers. Switch the type of data to either training or validation data and you will see the complete list of trained classifiers. Select a classifier and test it.
Make Predictions
Software
Optionally, you may make predictions on the unlabeled data you uploaded and save the results. If no unlabeled data exists, the Predict button is disabled.
Software
Finally, finish your work by clicking on Finish. A message box will show up and you may choose from closing the software or modeling a different dataset.

Practice Using the Software in Small Groups
Step 1: Select Data
Software
From the data/toy_data select toy_data_4.csv.
Partner activity
With a partner look at the Data Summary. How many samples are in the dataset? How many features are there? Do you notice any difference compared to the data from the guided tour, toy_data_1.csv?
Software
Pick a Holdout Validation method and go to the next step.
Step 2: Train Classifiers
Software
Pick any classifier from the menu.
Partner activity
What are the settings that you see called? Train the classifier with the default tunings, and name this classifier. Switch from the validation data to training data and discuss the differences with your partner. With a partner, each change your own tunings and traing the classifier. Compare the results on the validation data.
Software
Once you are ready to evaluate the performance of the classifiers, click Next.
Step 3: Test and Predict
Software
Either pick your own classifier you would like to test, or pick a metric to evaluate the classifier.
Small Group Activity
In a group of 2 or 3, share the performance you each get. Then, have the groups with the best metrics share their performance with everyone.