Evaluating a Model
Overview
Duration: 30 minQuestions
How do you evaluate the performance of a machine learning model?
Objectives
Create questions to ask about a machine learning task to aid model selection
Choose the appropriate evaluation metric for a particular machine learning problem
Derive the definitions of popular evaluation metrics
Evaluation Metrics
Arguably the most important part of choosing a model is evaluating it to see how well it performs. So far we’ve been looking at metrics such as accuracy, but let’s take a look at how we think about metrics in machine learning.
In the binary classification setting (where there are only two classes we’re trying to predict, such as activated or quiescent T-cells) we can group all possible predictions our classifier makes into four categories. This is organized into a table called the confusion matrix:
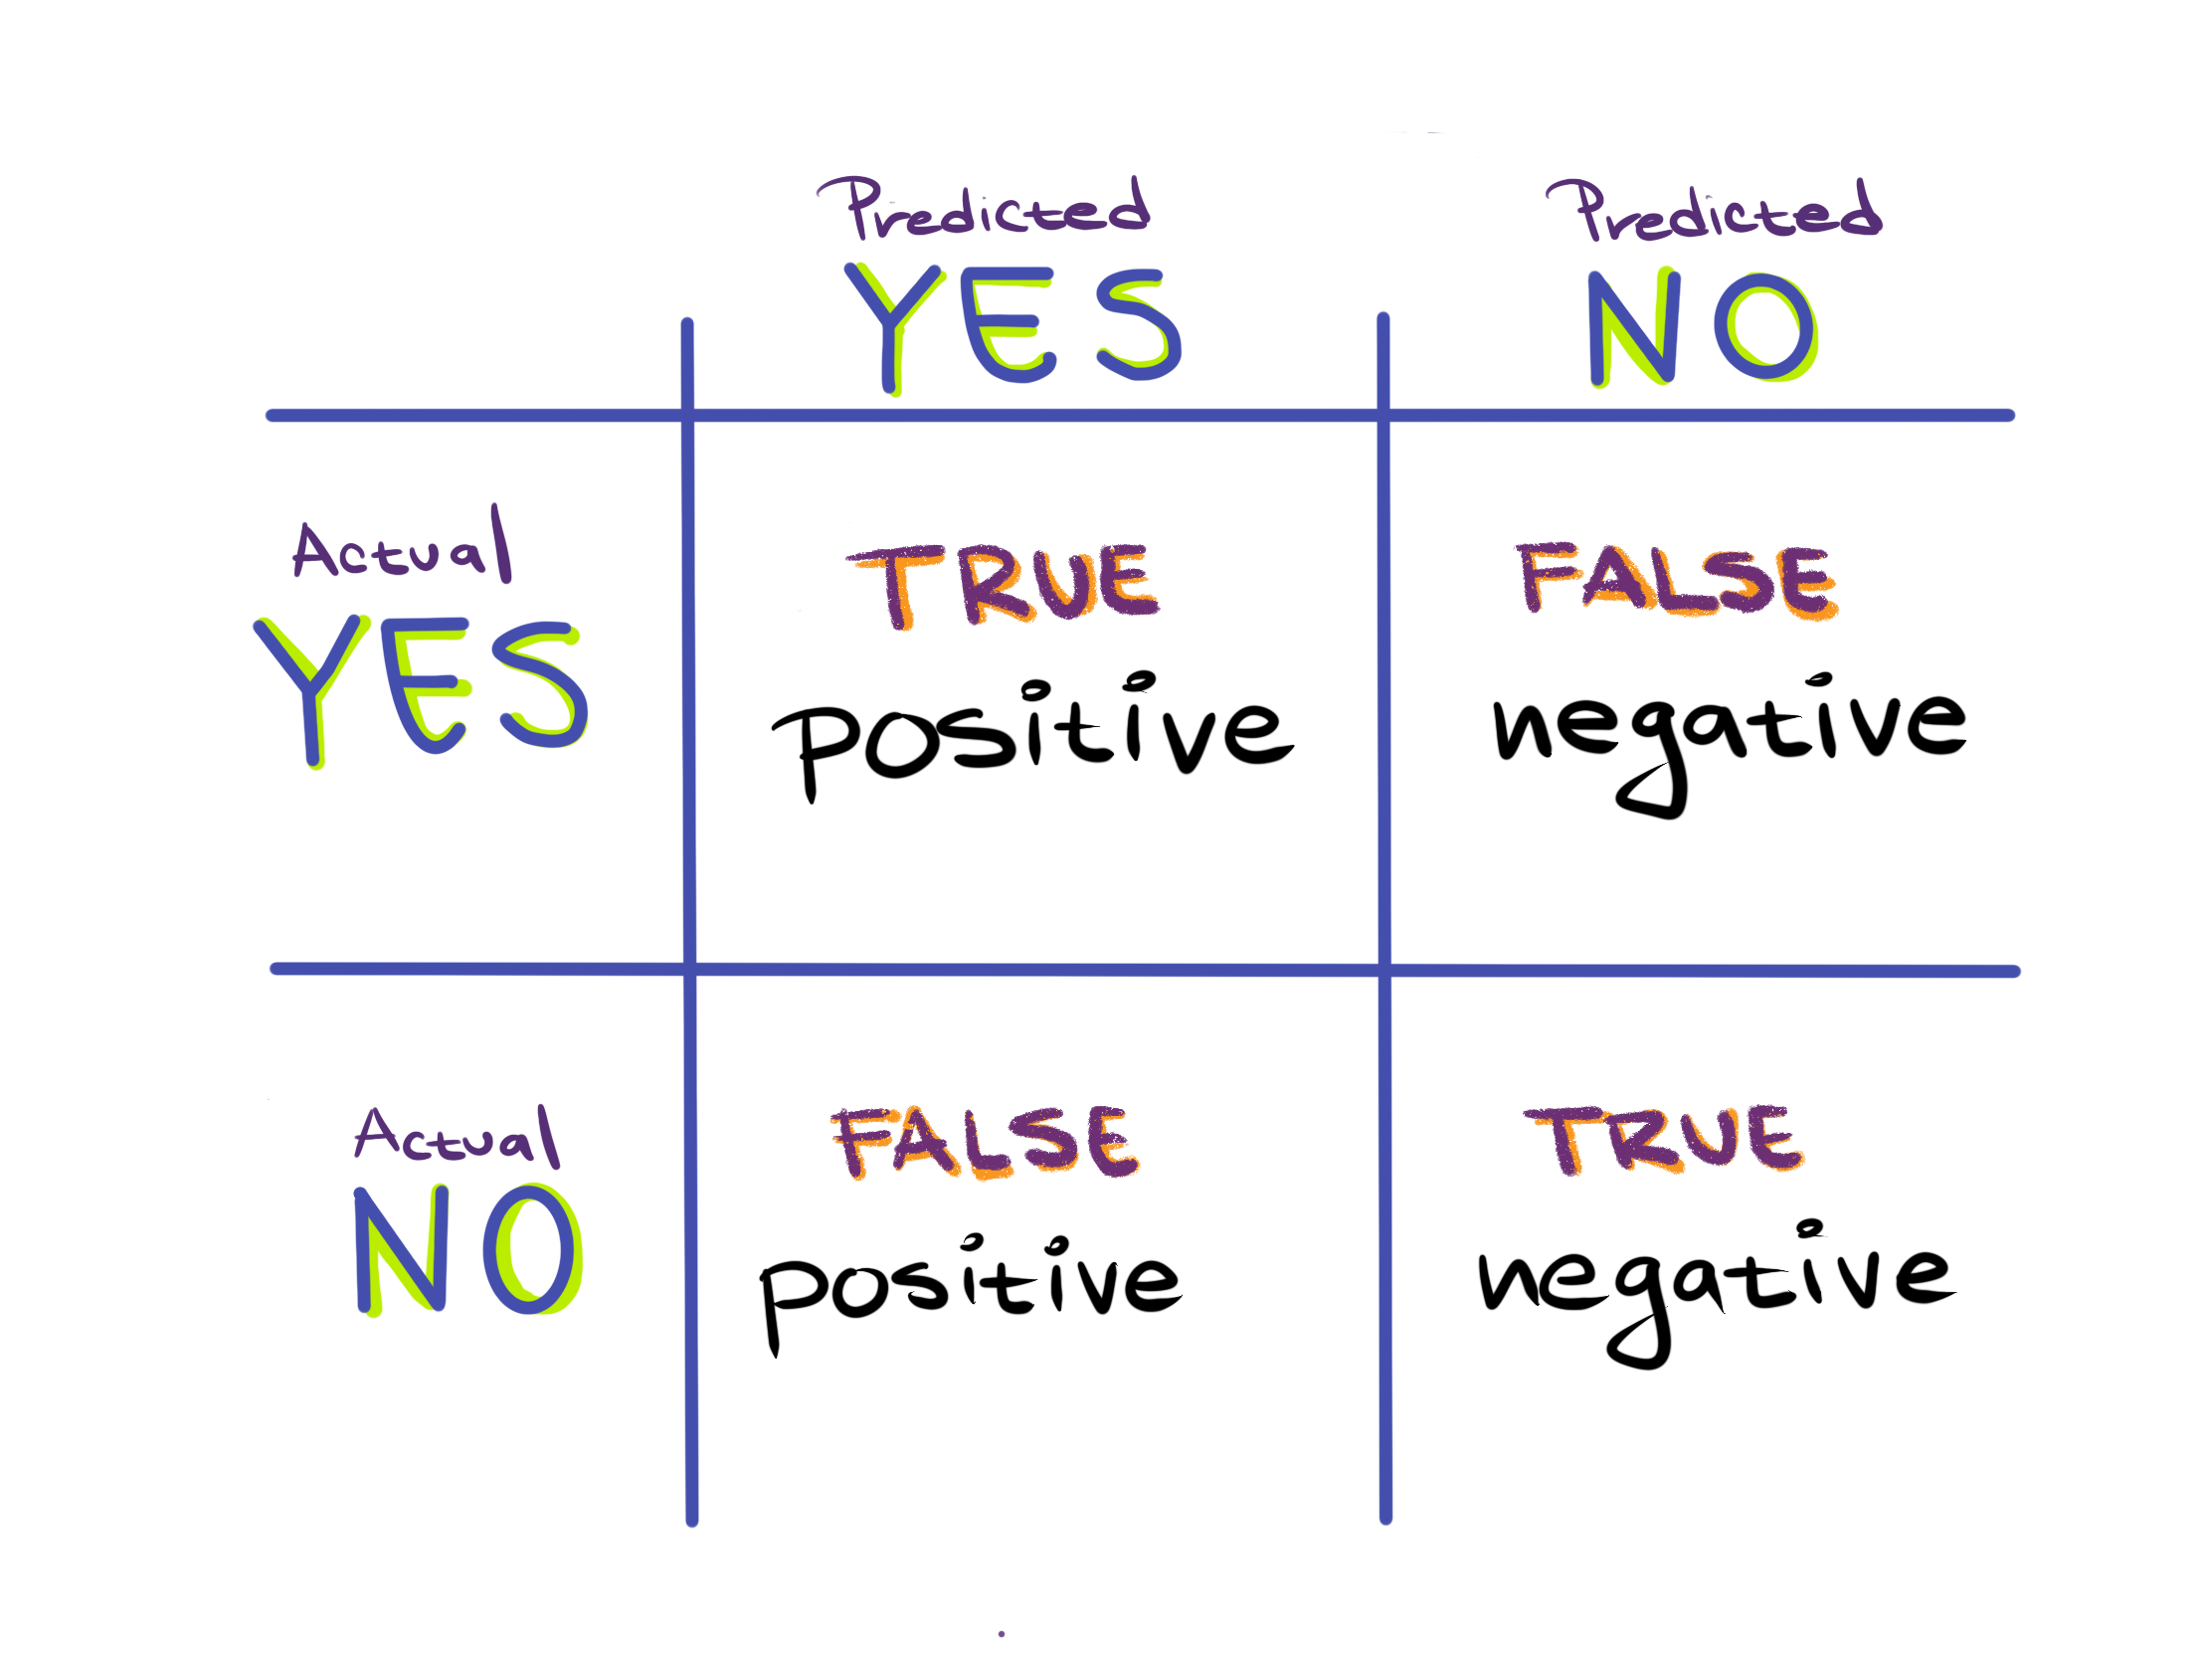
Here, all possible types of predictions are split by 1) What the actual, true class is and 2) what the predicted class is, that is, what our classifier thinks the truth is. This results in the 4 entries of the confusion matrix, two of which means our classifier got something right:
Definitions
True Positives (TP): These instances are actually true (activated) and have been correctly predicted to be true.
True Negatives (TN): These instances are actually false (quiescent) and have been correctly predicted to be false.
And two of which means our classifier got something wrong:
Definitions
False Positives (FP) - These are instances which are actually false but our classifier predicted to be true. False positives are sometimes called type I errors or $\alpha$ errors.
False Negatives (FN) - These are instances which are actually true but our classifier predicted to be false. False negatives are sometimes called type II errors or $\beta$ errors.
Almost all evaluation metrics used in machine learning can be derived from the entries in the truth table, typically as a ratio of two sets of entries. For instance, accuracy is defined as the percent of instances the classifier got right.
So to calculate accuracy we take the number of things we got right, which is the number of true positives and the number of true negatives:
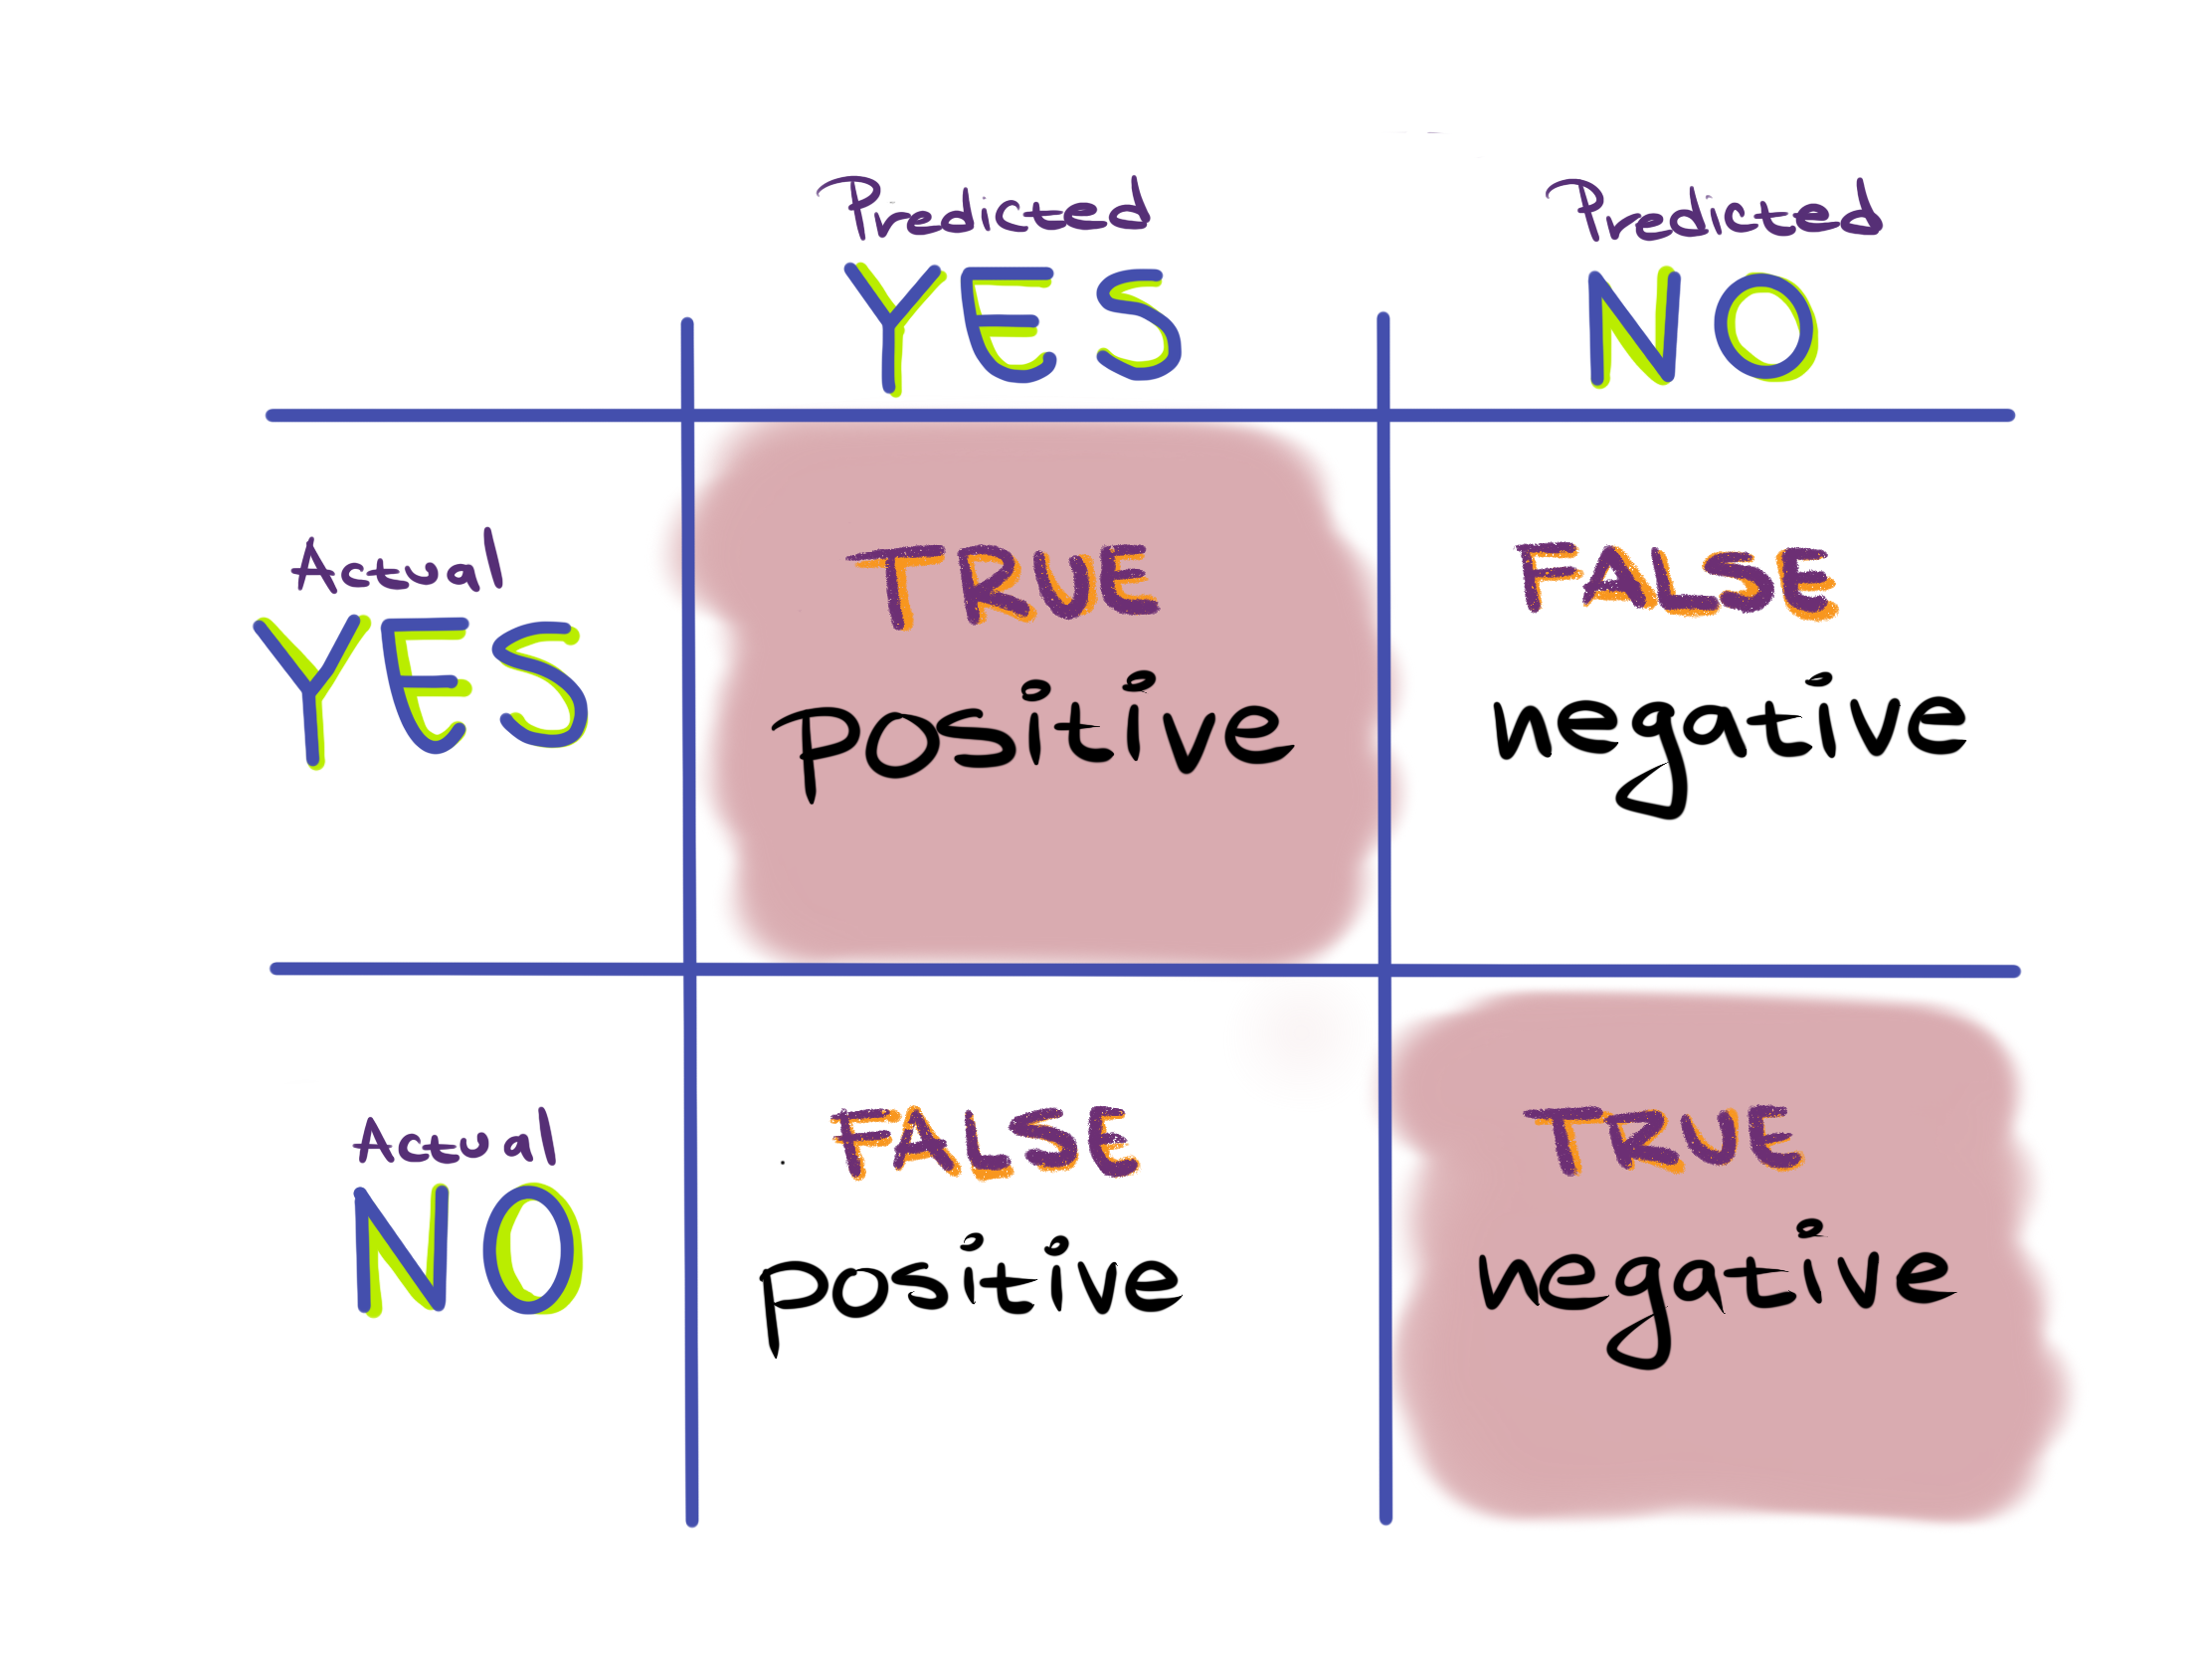
And divide it by the number total entries in the table, which is all four entries:
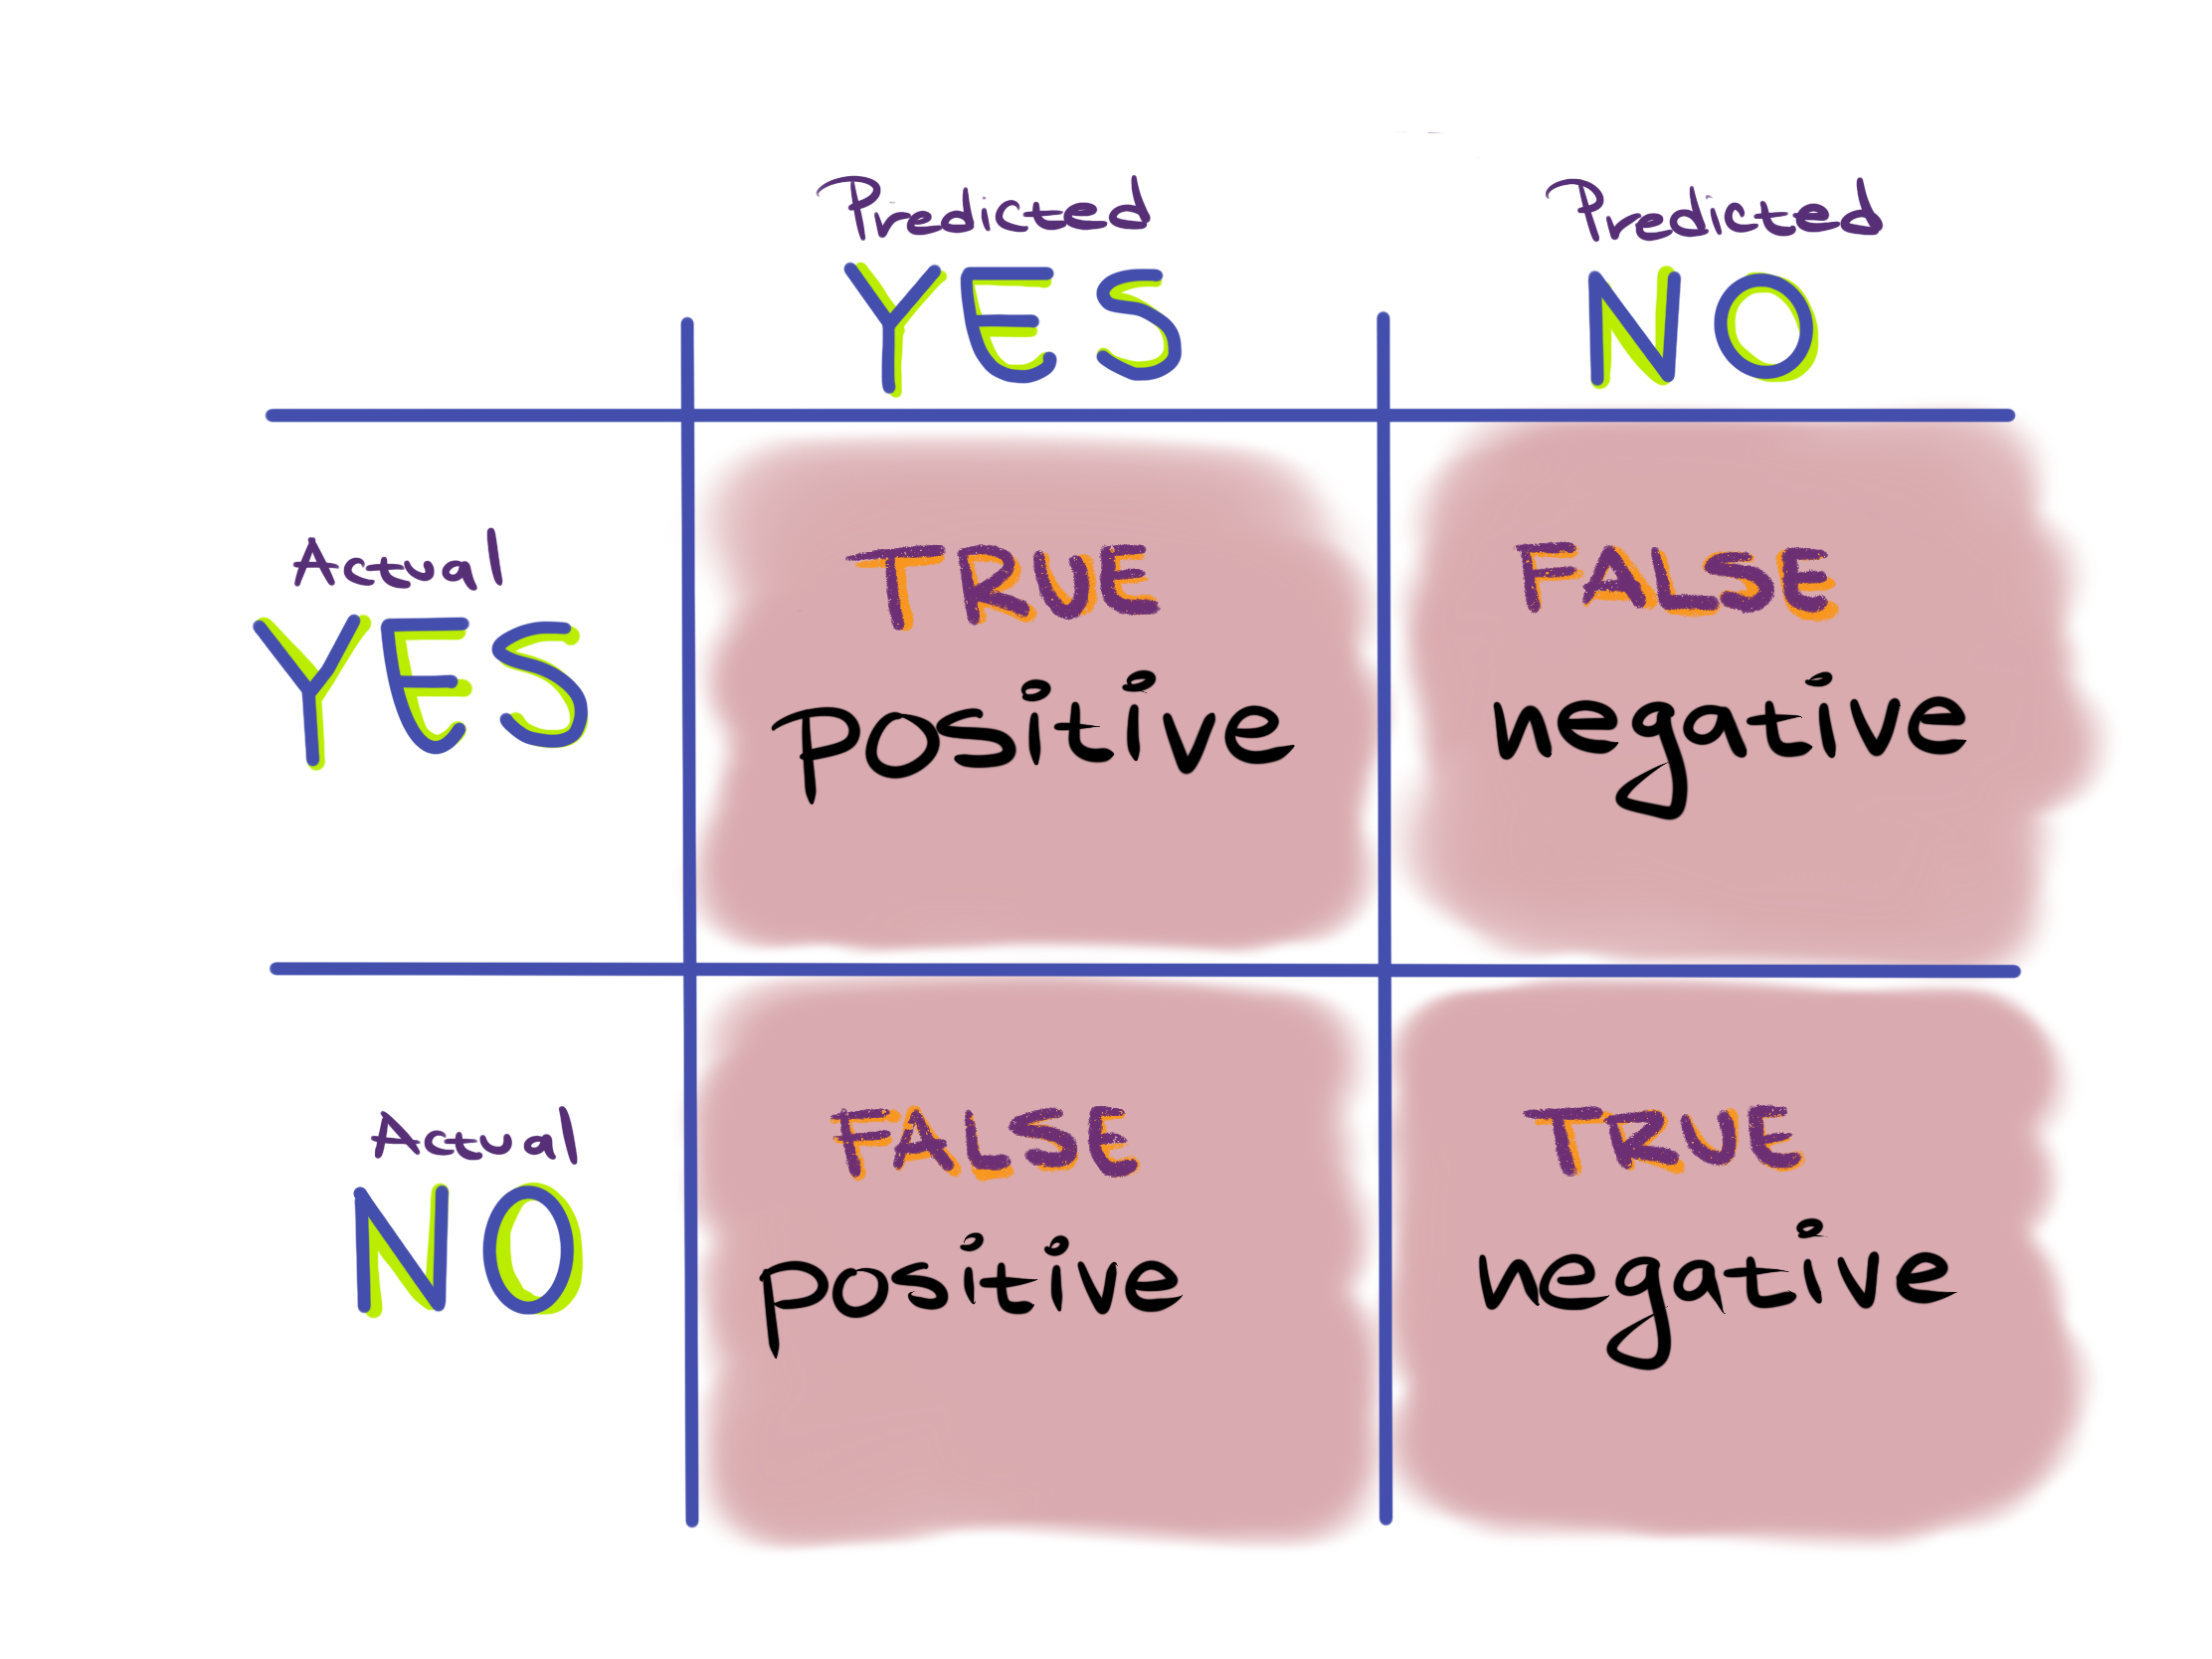
Therefore, accuracy is defined as $\frac{TP + TN}{TP+FP+TN+FN}$.
We can see accuracy as estimating the answer to the question How likely is our classifier to get a single instance right? However, for many models this might not be the right question.
An example of a different question we might want to ask about a model would be If our classifier predicts something to be true, how likely is it to be right?
To answer this question we would look at everything we predicted to be true, which is the true positive and false positives:
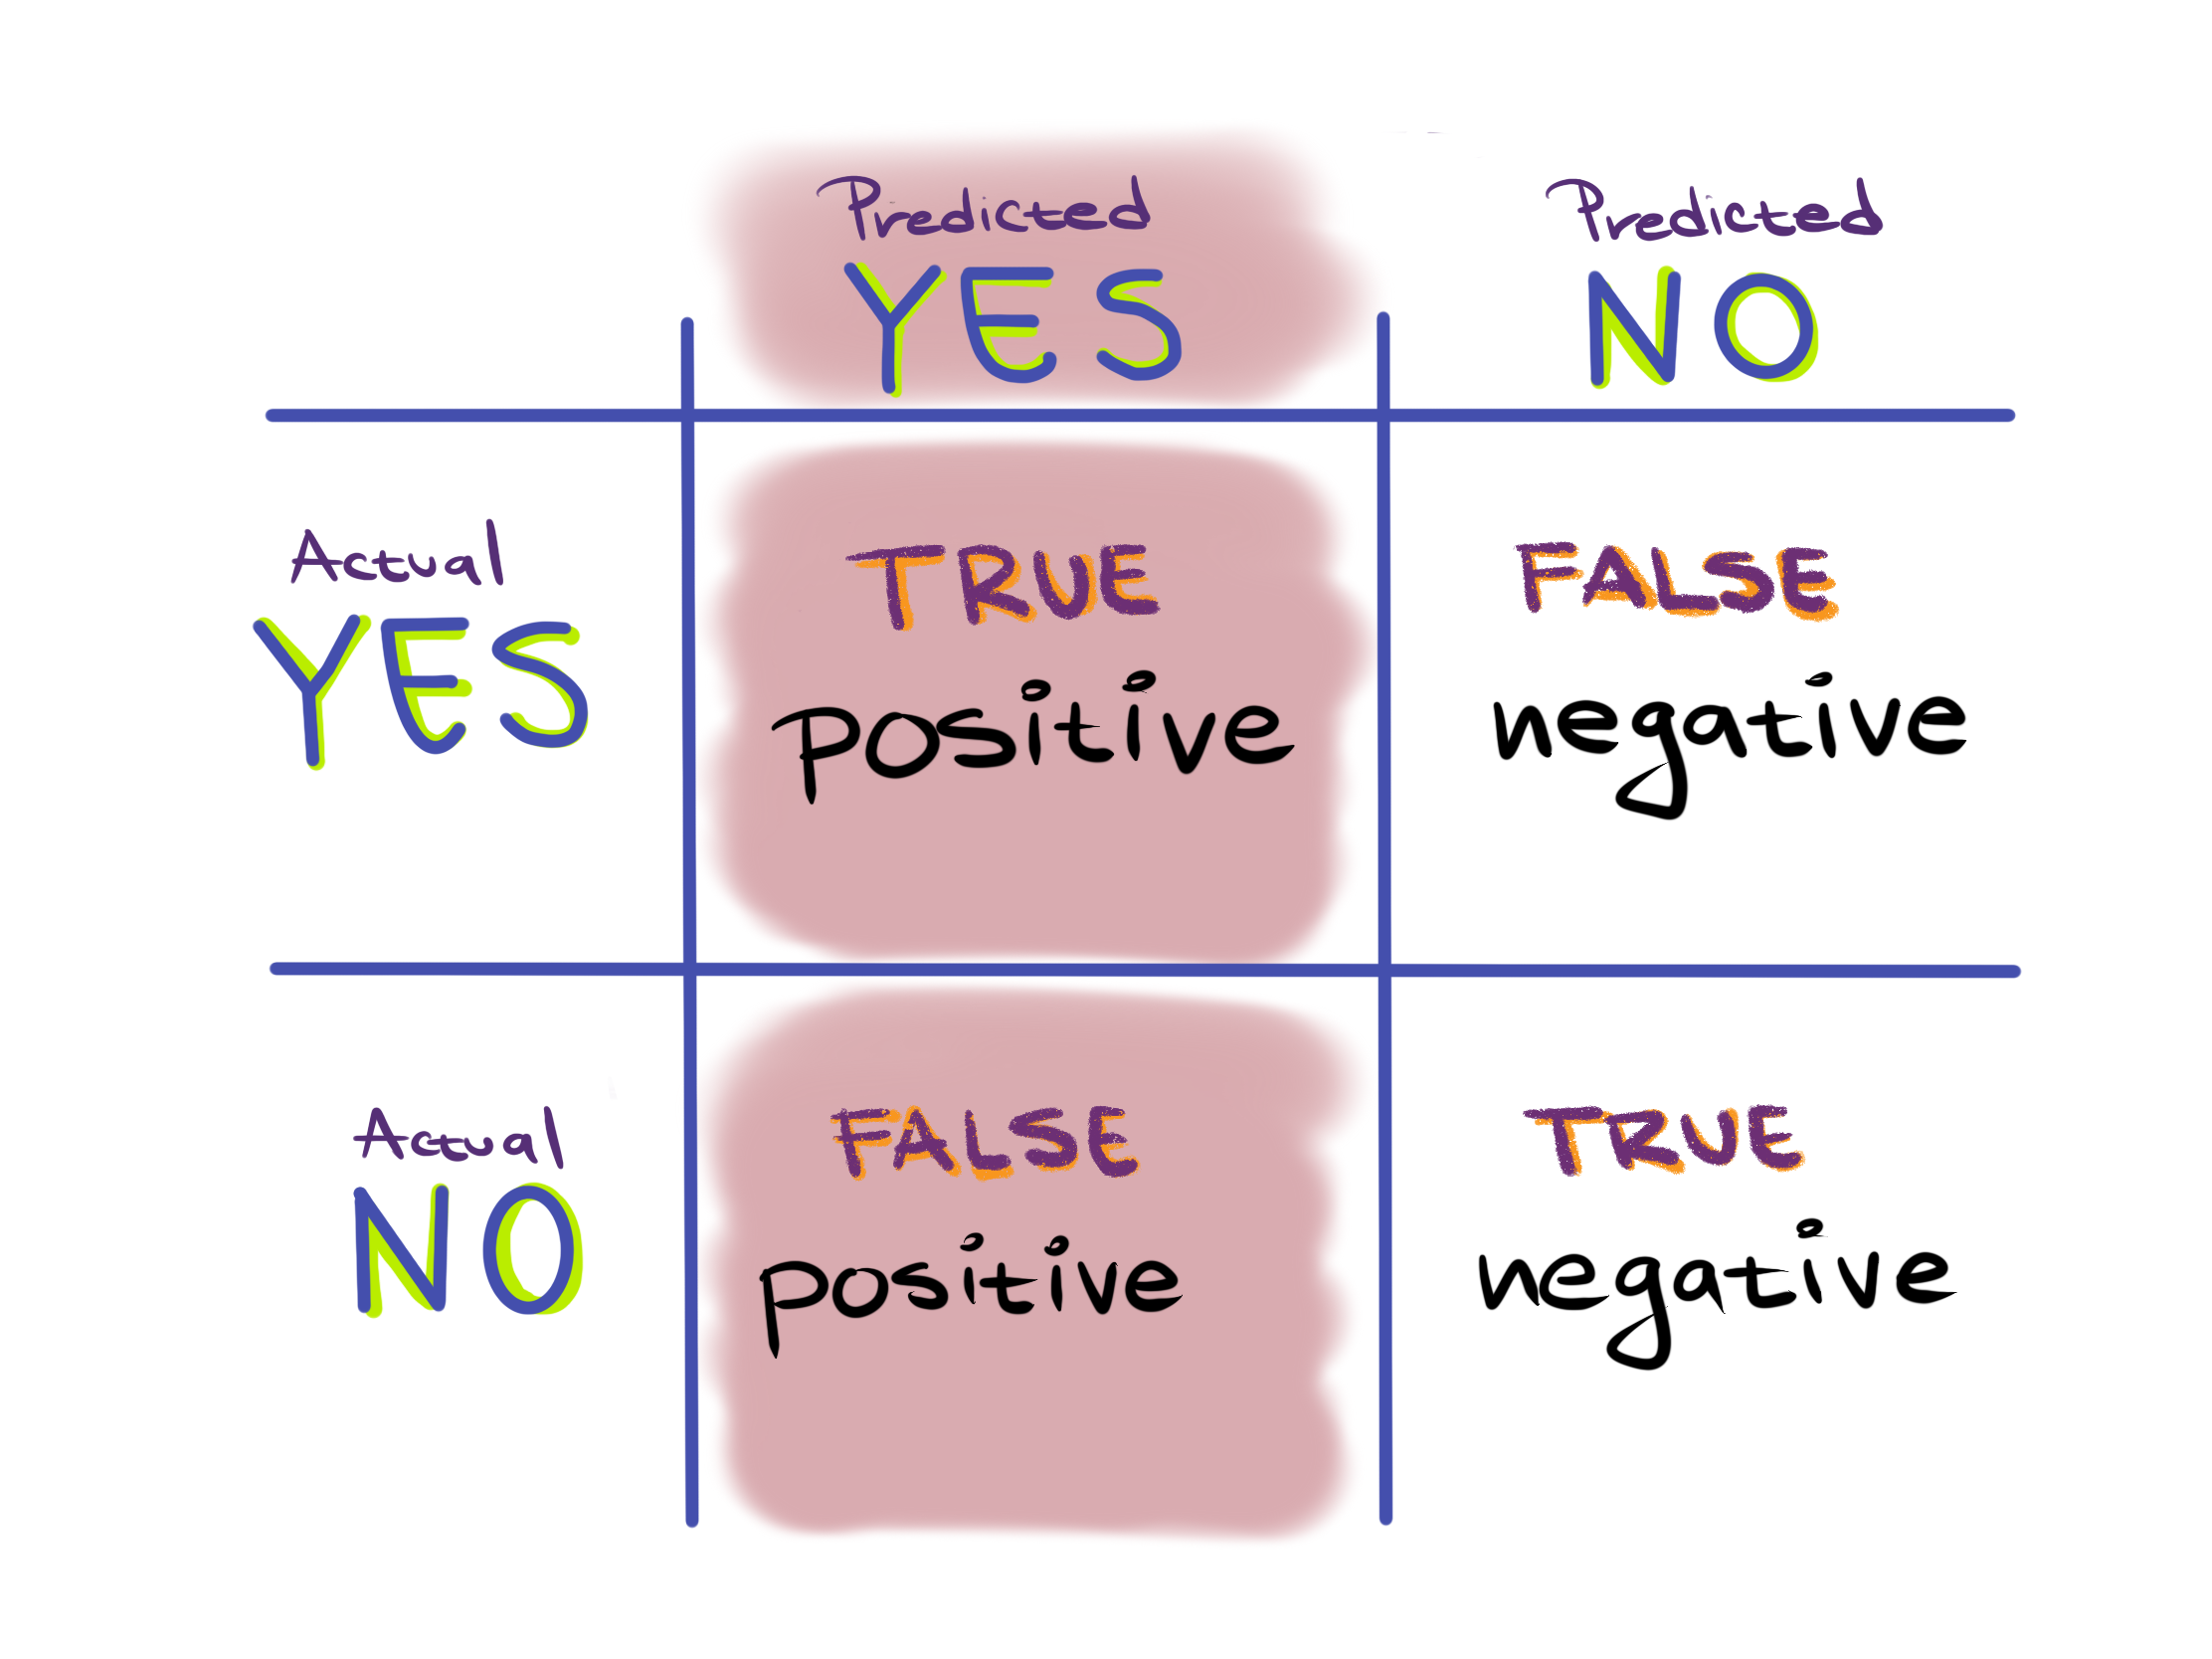
We would then calculate the percent of these predictions that were correct, which are the true positives. Thus, to answer this question we would use the metric $\frac{TP}{TP + FP}$.
This metric is called precision in machine learning (and may be different from the definition of precision you use in a laboratory setting).
Scenario 1 - Poll
You are designing a long-term study on the mutational rates of various breast cancer subtypes over several years using cell lines. Due to cost constraints you can only choose a few cell lines to monitor. However, there has been some recent research calling into question whether or not certain cell lines you were considering using are actually the cancer subtype they are believed to be. You cannot afford to include cell lines of the wrong subtype in your study. To aid in this task you decide to create a machine learning system to help verify that the cells lines you want to use are, in fact, the cancer subtypes you want to study. The model uses gene expression data to predict cancer subtype.
- Which entries in the confusion matrix are most important in this machine learning task? Is one type of correct or one type of incorrect prediction more important than the other for your machine learning system?
- Which metric would you use to evaluate this task?
Scenario 2 - Poll
You are designing a machine learning system for discovering existing drugs which may be effective in treating Malaria, focusing on the parasite Plasmodium falciparum. Your system takes in information on an FDA approved drug’s chemical structure, and predicts whether or not a drug may interact with P. falciparum. The machine learning system will be used as an initial screening step; drugs classified as interacting by your system will be flagged and tested in the lab. It is okay if some drugs sent to be tested in the lab end up having no effect. If your study leads to the approval of even a single new drug for treating P. falciparum you will consider the system a success. The vast majority of drugs will not be useful in treating P. falciparum.
- Which entries in the confusion matrix are most important in this machine learning task? Is one type of correct or one type of incorrect prediction more important than the other for your machine learning system?
- Imagine a classifier that predicted that all drugs are non-interacting. If you evaluated this classifier using the entire catalog of FDA approved drugs, what would the accuracy look like?
- What metric or couple of metrics would you use to evaluate your machine learning system?
Load the
simulated_drug_discovery/simulated-drug-discovery.csvdataset from thedatafolder into the ML4Bio software. Try training a logistic regression classifier on the dataset. Which metrics seem to accurately reflect the performance of the classifier?
Common Metrics:
| Name | Formula |
|---|---|
| Accuracy | $\frac{TP + TN}{TP+FP+TN+FN}$ |
| Precision (Positive Predictive Value) | $\frac{TP}{TP + FP}$ |
| Recall (Sensitivity, True Positive Rate) | $\frac{TP}{TP + FN}$ |
| True Negative Rate (Specificity) | $\frac{TN}{TN + FP}$ |
| False Positive Rate | $\frac{FP}{FP + TN}$ |
| F1 Score | $\frac{2TP}{TP + TN + FP + FN}$ |
Error Curves
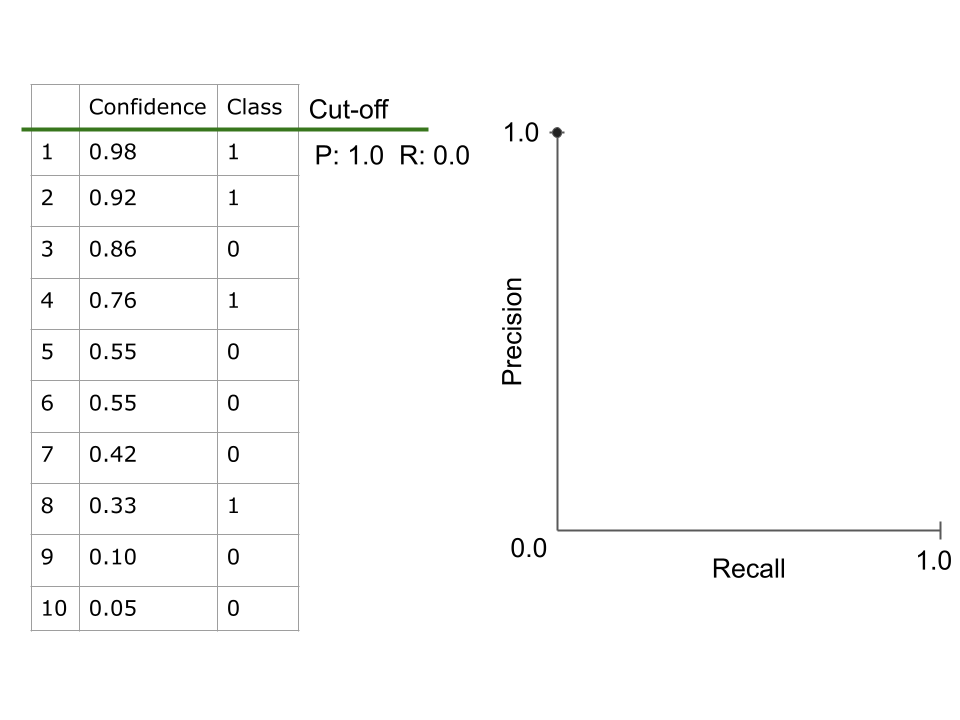
When evaluating machine learning models, multiple metrics are often combined into curves to be able to summarize performance into a single final metric. These curves are plotted at different confidence cut-offs, selecting different confidence thresholds for what is predicted to be in the positive class. The two most popular curves are the ROC curve and the PR curve.
.png)
.png)
.png)
.png)
.png)
.png)
.png)
.png)
.png)
Definitions
Receiver Operating Characteristic (ROC) Curve - A curve which plots the recall (true positive rate) against the false positive rate at different confidence cut-offs. The area under the curve (often called the AUROC) can then be used as a single metric to evaluate a classifier.
Precision Recall (PR) Curve - A curve which plots the precision against the recall at different confidence cut-offs. The area under the curve (often called AUPR) can then be used as a single metric to evaluate a classifier.
Key Points
The choice of evaluation metric depends on the relative proportions of different classes in the data, and what we want the model to succeed at.
Comparing performance on the validation set with the right metric is an effective way to select a classifier and hyperparameter settings.