Decision Trees, Random Forests, and Overfitting
Overview
Duration: 40 minQuestions
How do decision trees and random forests make decisions?
Objectives
Describe the decision boundary of a decision tree and random forest
Understand advantages and disadvantages of decision trees and random forests
Identify evidence of overfitting
What is the decision tree classifier?
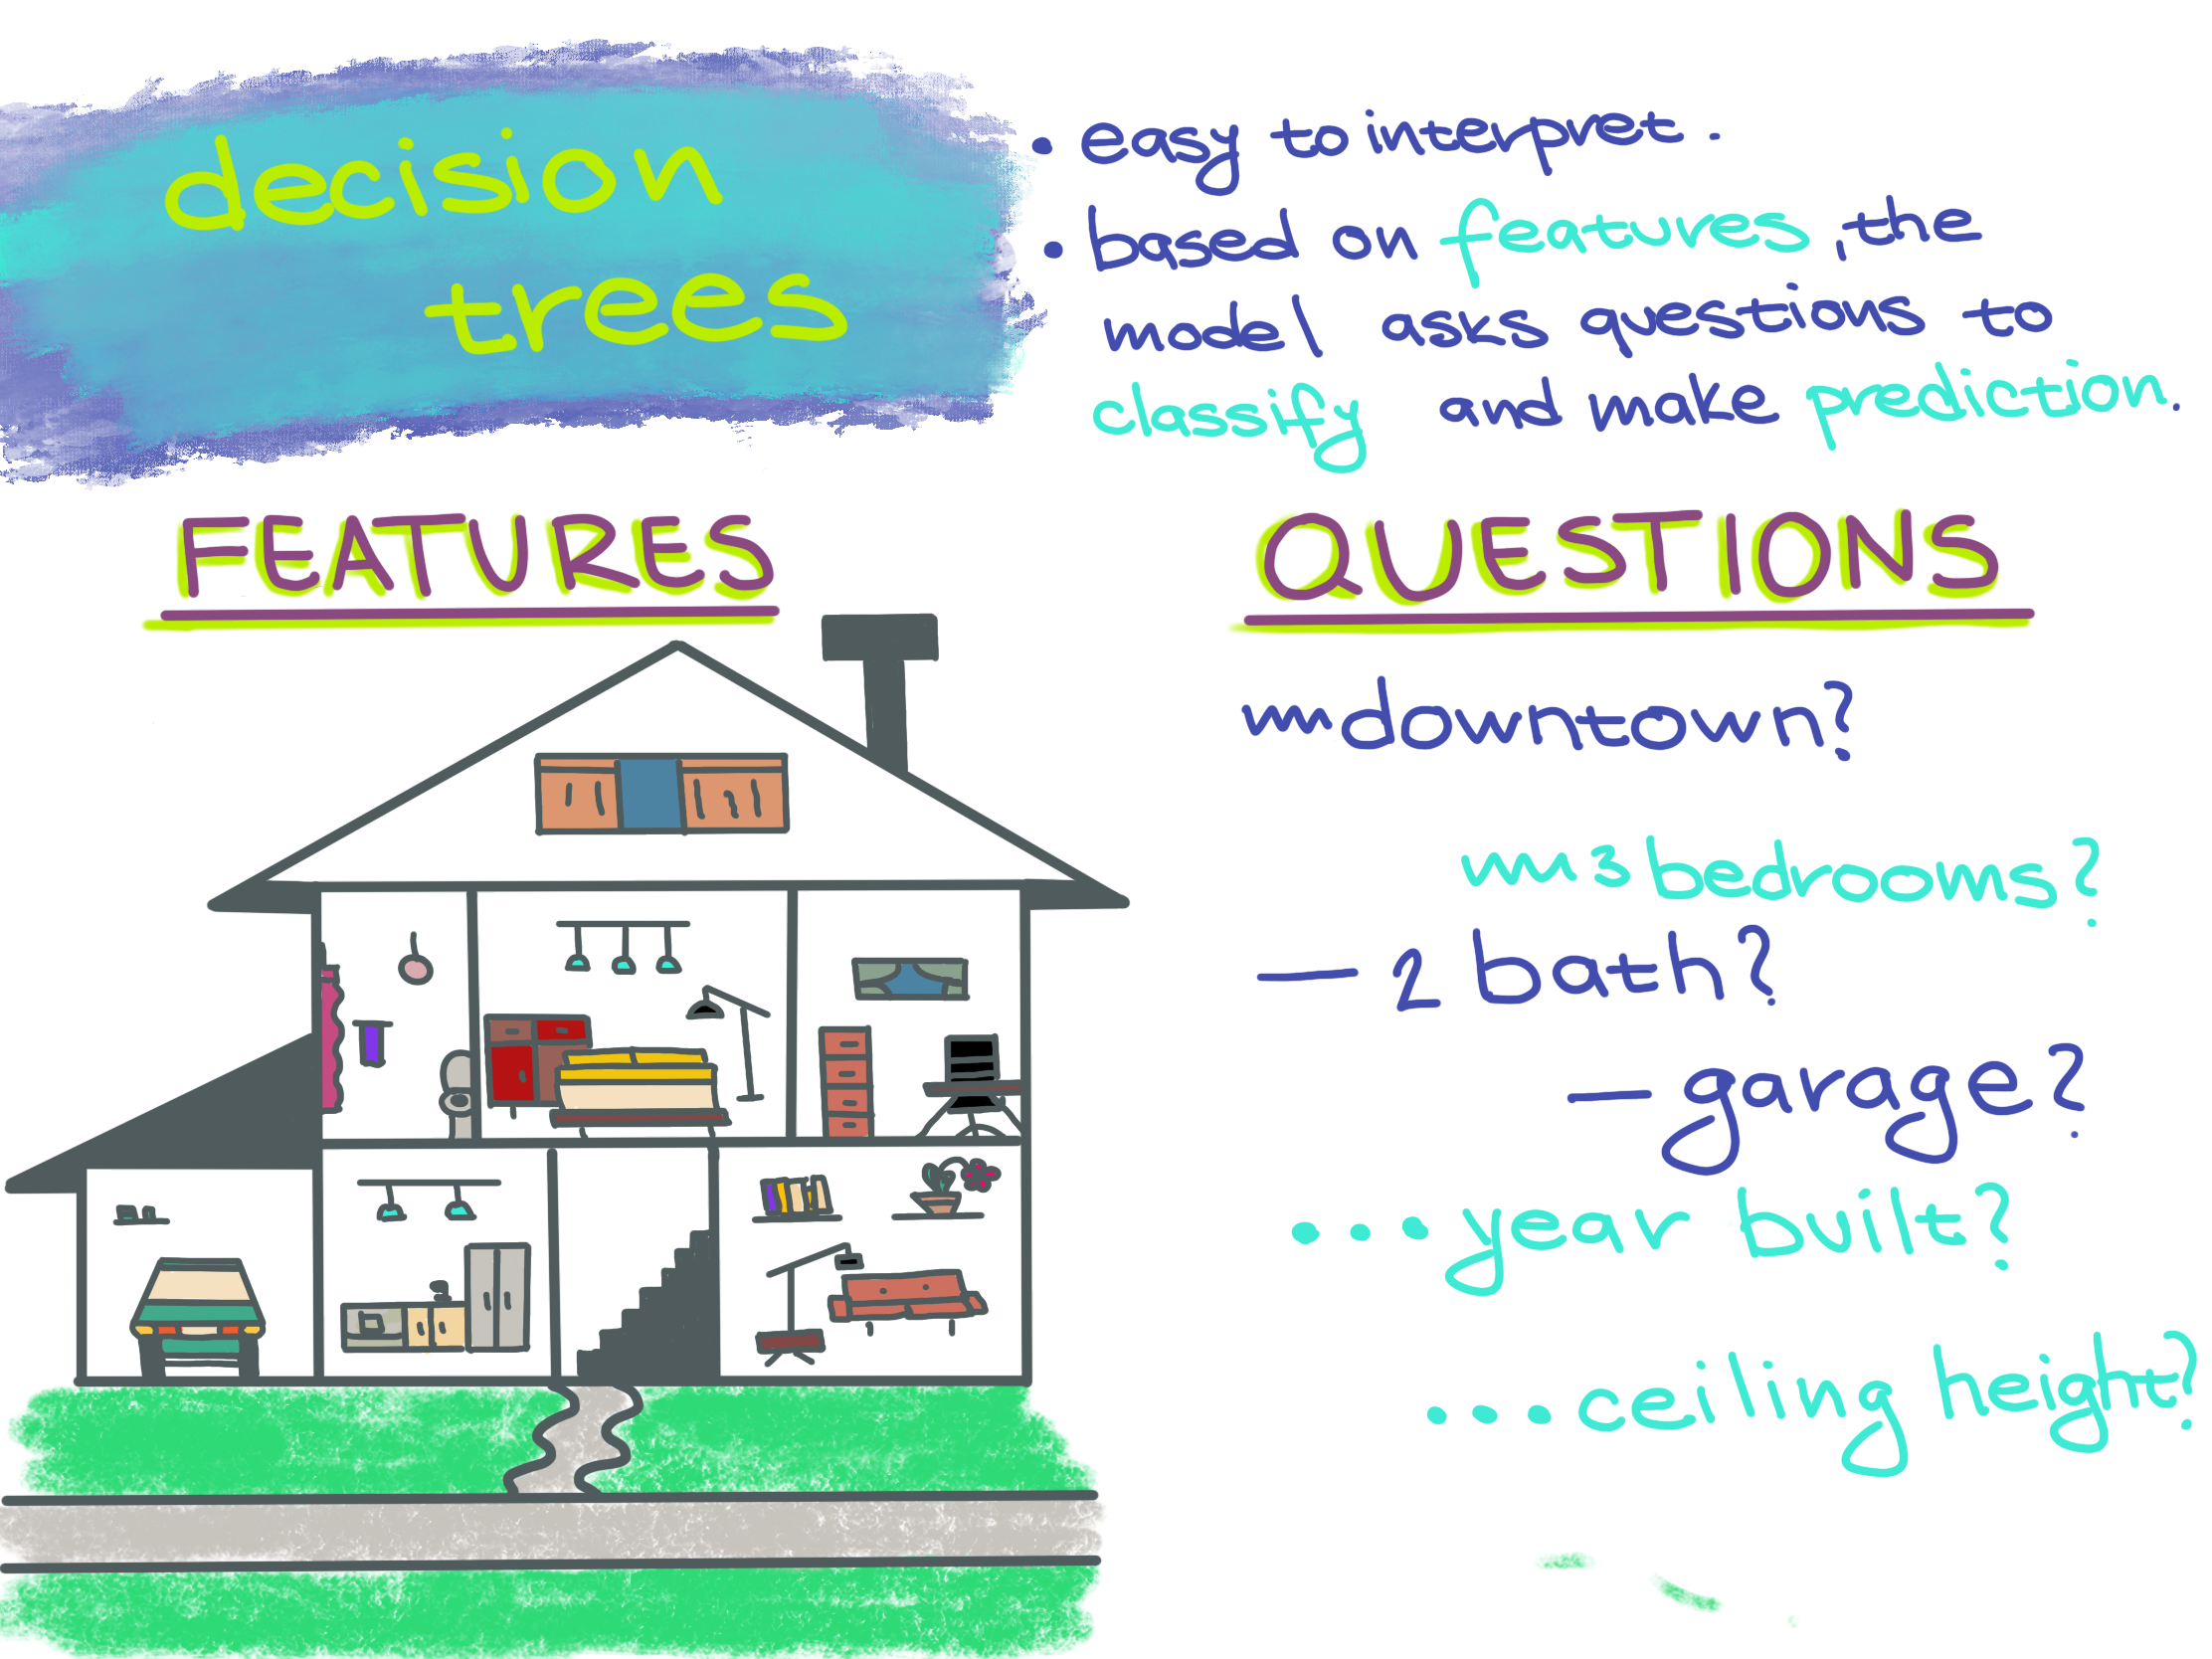
Decision trees make predictions by asking a sequence of questions for each example and make a prediction based on the responses. This makes decision trees intuitive. One of the benefits is that we can clearly see the path of questions and answers we took to get to the final prediction. For example, a doctor might use a decision tree to decide which medicine to prescribe based on a patient’s responses about their symptoms. Or in the case of T-cells, a decision tree can predict whether a T-cell is active or quiescent.
Example
To better understand the algorithm, consider the classification task of predicting whether a house has a low or high price. If the house price is higher than $200k, we will predict high, otherwise we will predict low. We are going to begin with an initial house price range, and for our neighborhood of interest the prices range from $100k - $250k. The first question we could ask is the number of bedrooms in the house. The answer is 3 bedrooms, and so our new range will be $180k-$250k. Then, we will ask about the number of bathrooms, and the answer is 3 bathrooms. The new range is $220-$250. Finally, we will ask the house’s neighborhood. The answer is Neighborhood A. That gives us the price of $230k. Our final class label is high.
How does the classifier make predictions?
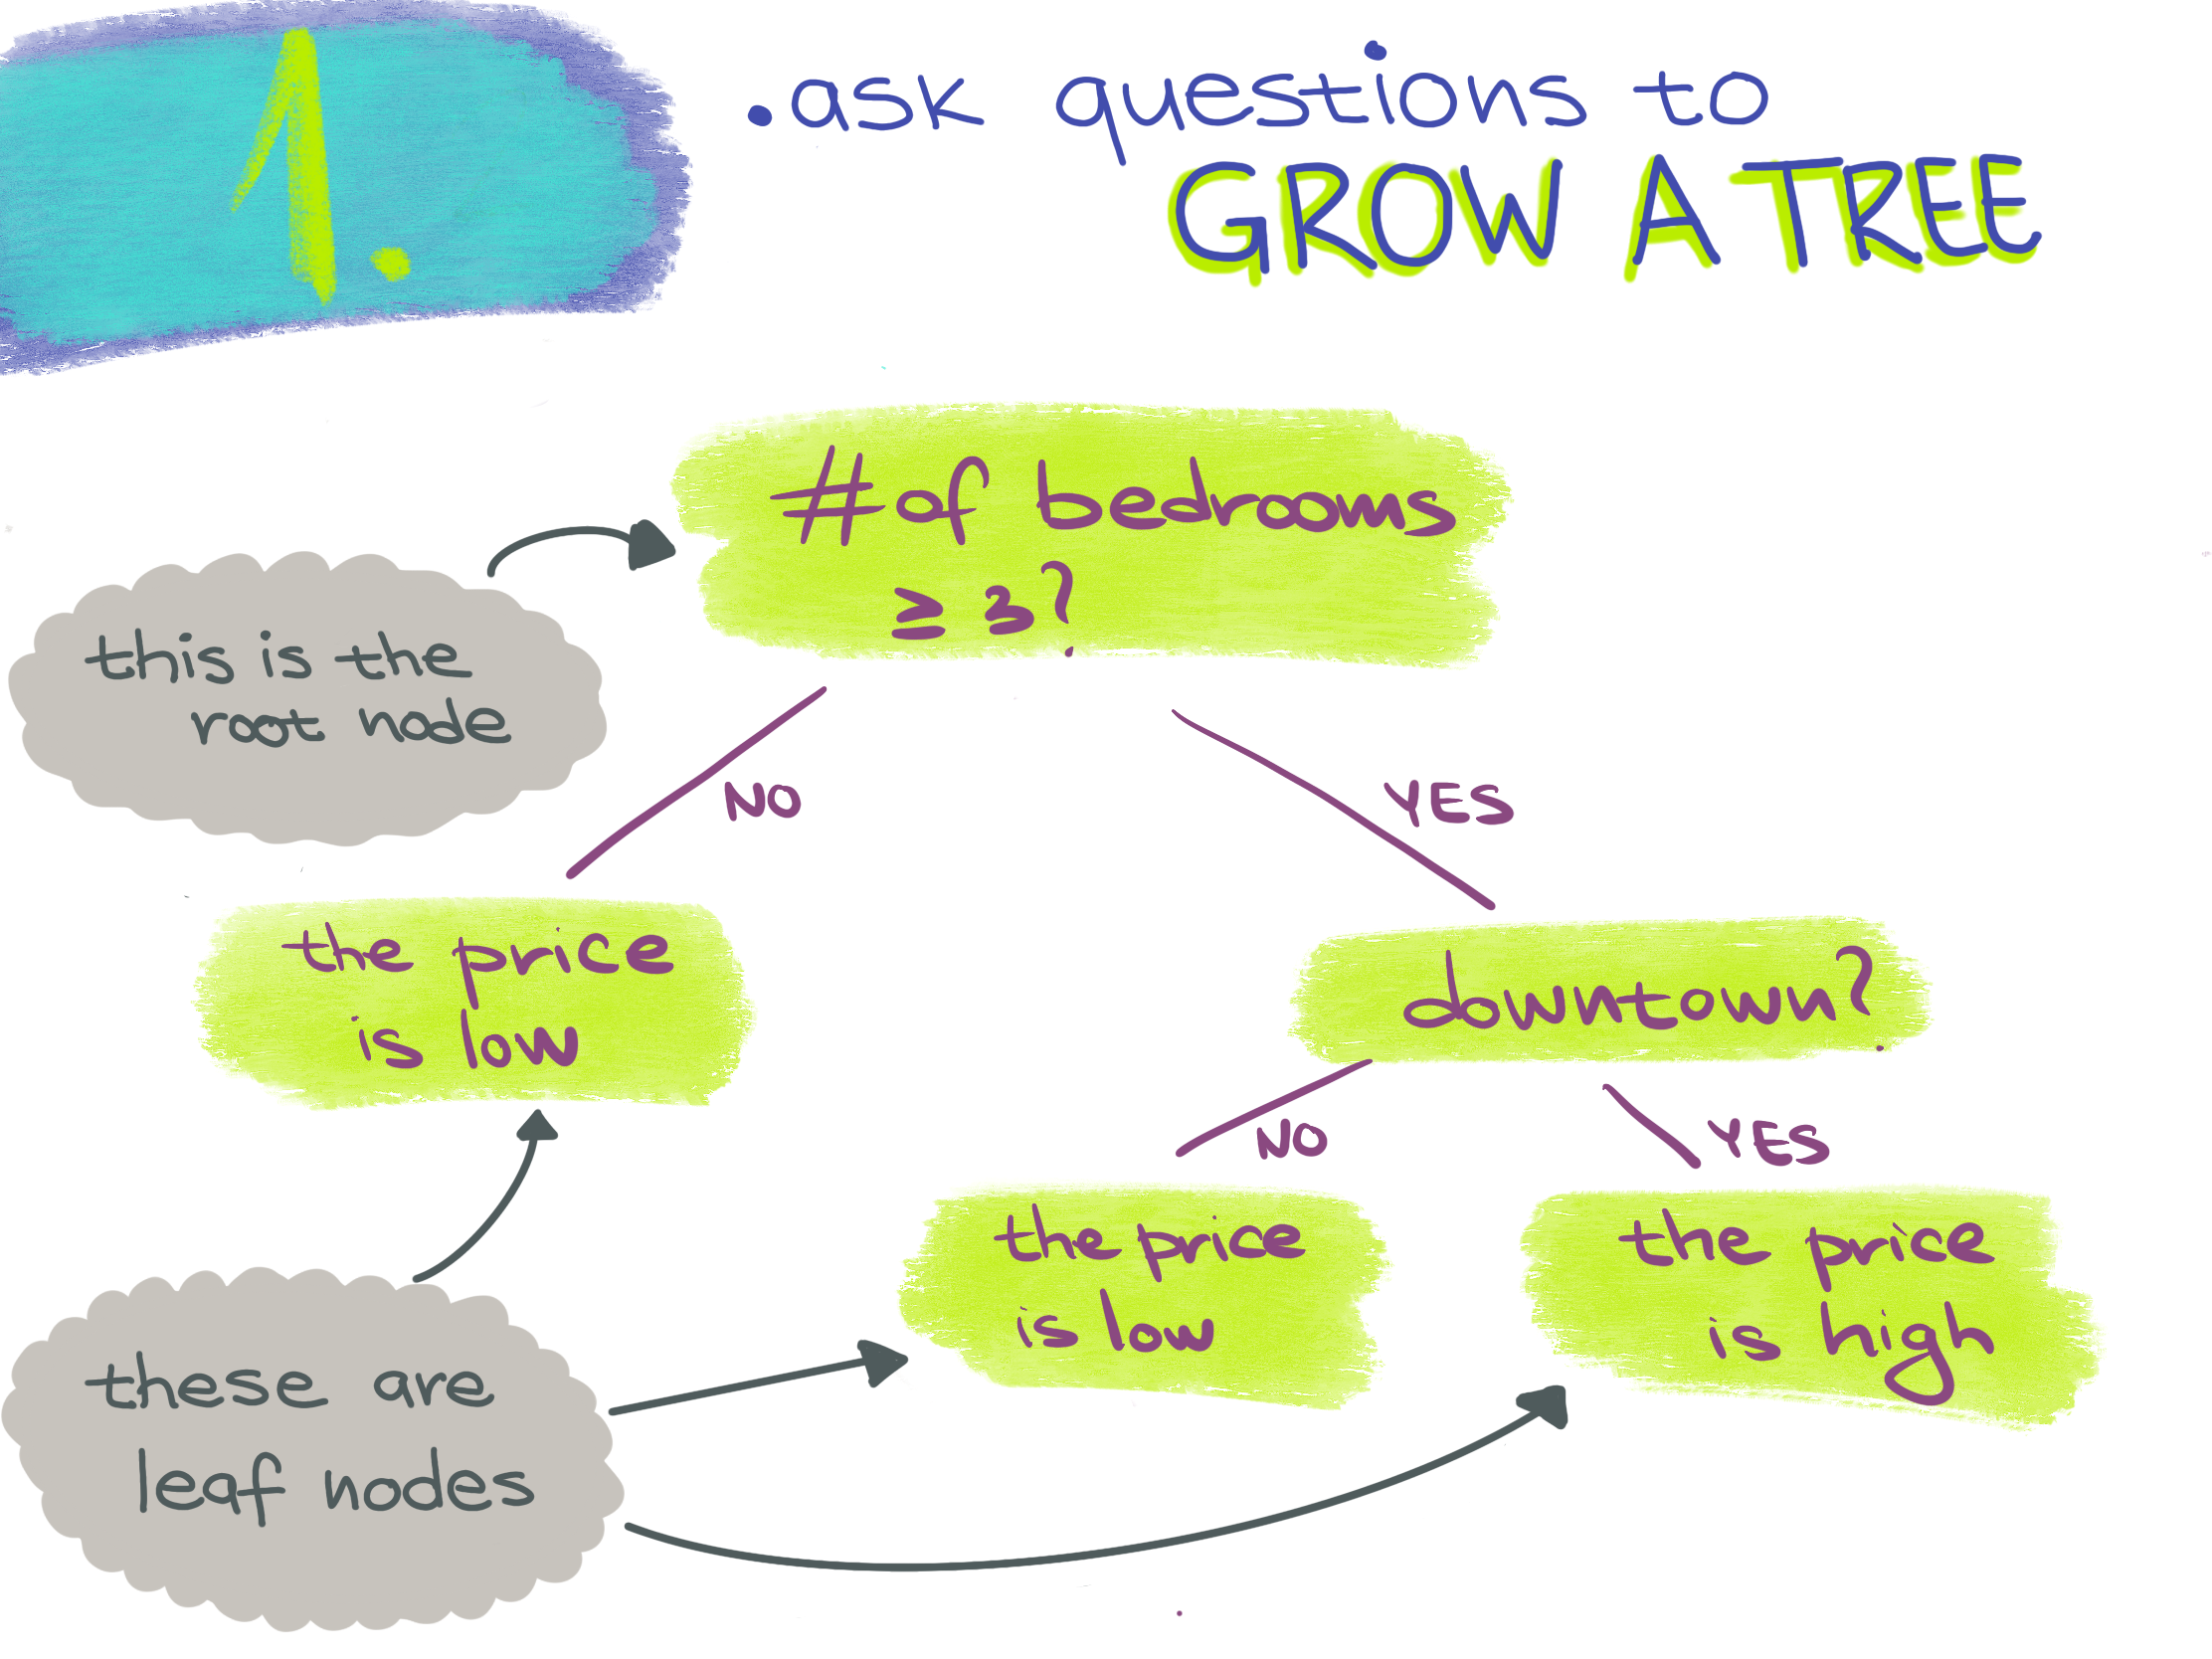
Each split of a decision tree classifies instances based on a test of a single feature. This test can be True or False. The splitting goes from the root at the top of the tree to a leaf node at the bottom.
Definitions
Root node - the topmost node where the decision flow starts.
Leaf node - a bottom node that doesn’t split any further. It represents the class label.
An instance is classified starting from the root and testing the feature specified by the node, then going down the split based on the outcome of the test and testing a different feature specified by another node. Each leaf node in the tree is a class label.
Definition
Node - a test performed on a feature. It splits into two branches.
About the classifier
A decision tree is a supervised learning classifier. It splits the initial population depending on a certain rule. The goal of the classifier is to predict the class label on a new set of data based on the rule that the classifier learned from the features of the training examples. An important property of the decision tree is the depth of tree.
Definition
Depth of tree - the number of times we make a split to reach a decision.
Some pros of using decision trees:
- often simpler to visualize and interpret than other models
- the classification can be visually followed and performed manually
- makes few assumptions about the data
- can ignore useless features
Some cons of using decision trees:
- prone to overfitting
- requires a way to turn numeric data into a single decision rule
Definition
Overfitting - an overfitting model fits the training data too well, but it fails to do this on the new data.
Select data
Software
Load
simulated_t_cell/simulated_t_cells_7.csvdata set into the software.Turn off “stratified sampling” under validation methodology (right above next) before continuing.
Conceptual Questions
What are we trying to predict?
We will continue working on the T-cells example. The goal is the same, predicting whether a cell is active or quiescent. We also have the same two features: cell size and intensity.
Train classifiers
In the original T-cells example, we left the hyperparameters settings as the defaults. Now we will look further into some of the hyperparameters. In this workshop, not all of the hyperparameters from the software will be covered. For the hyperparameters that we don’t discuss, use the default settings.
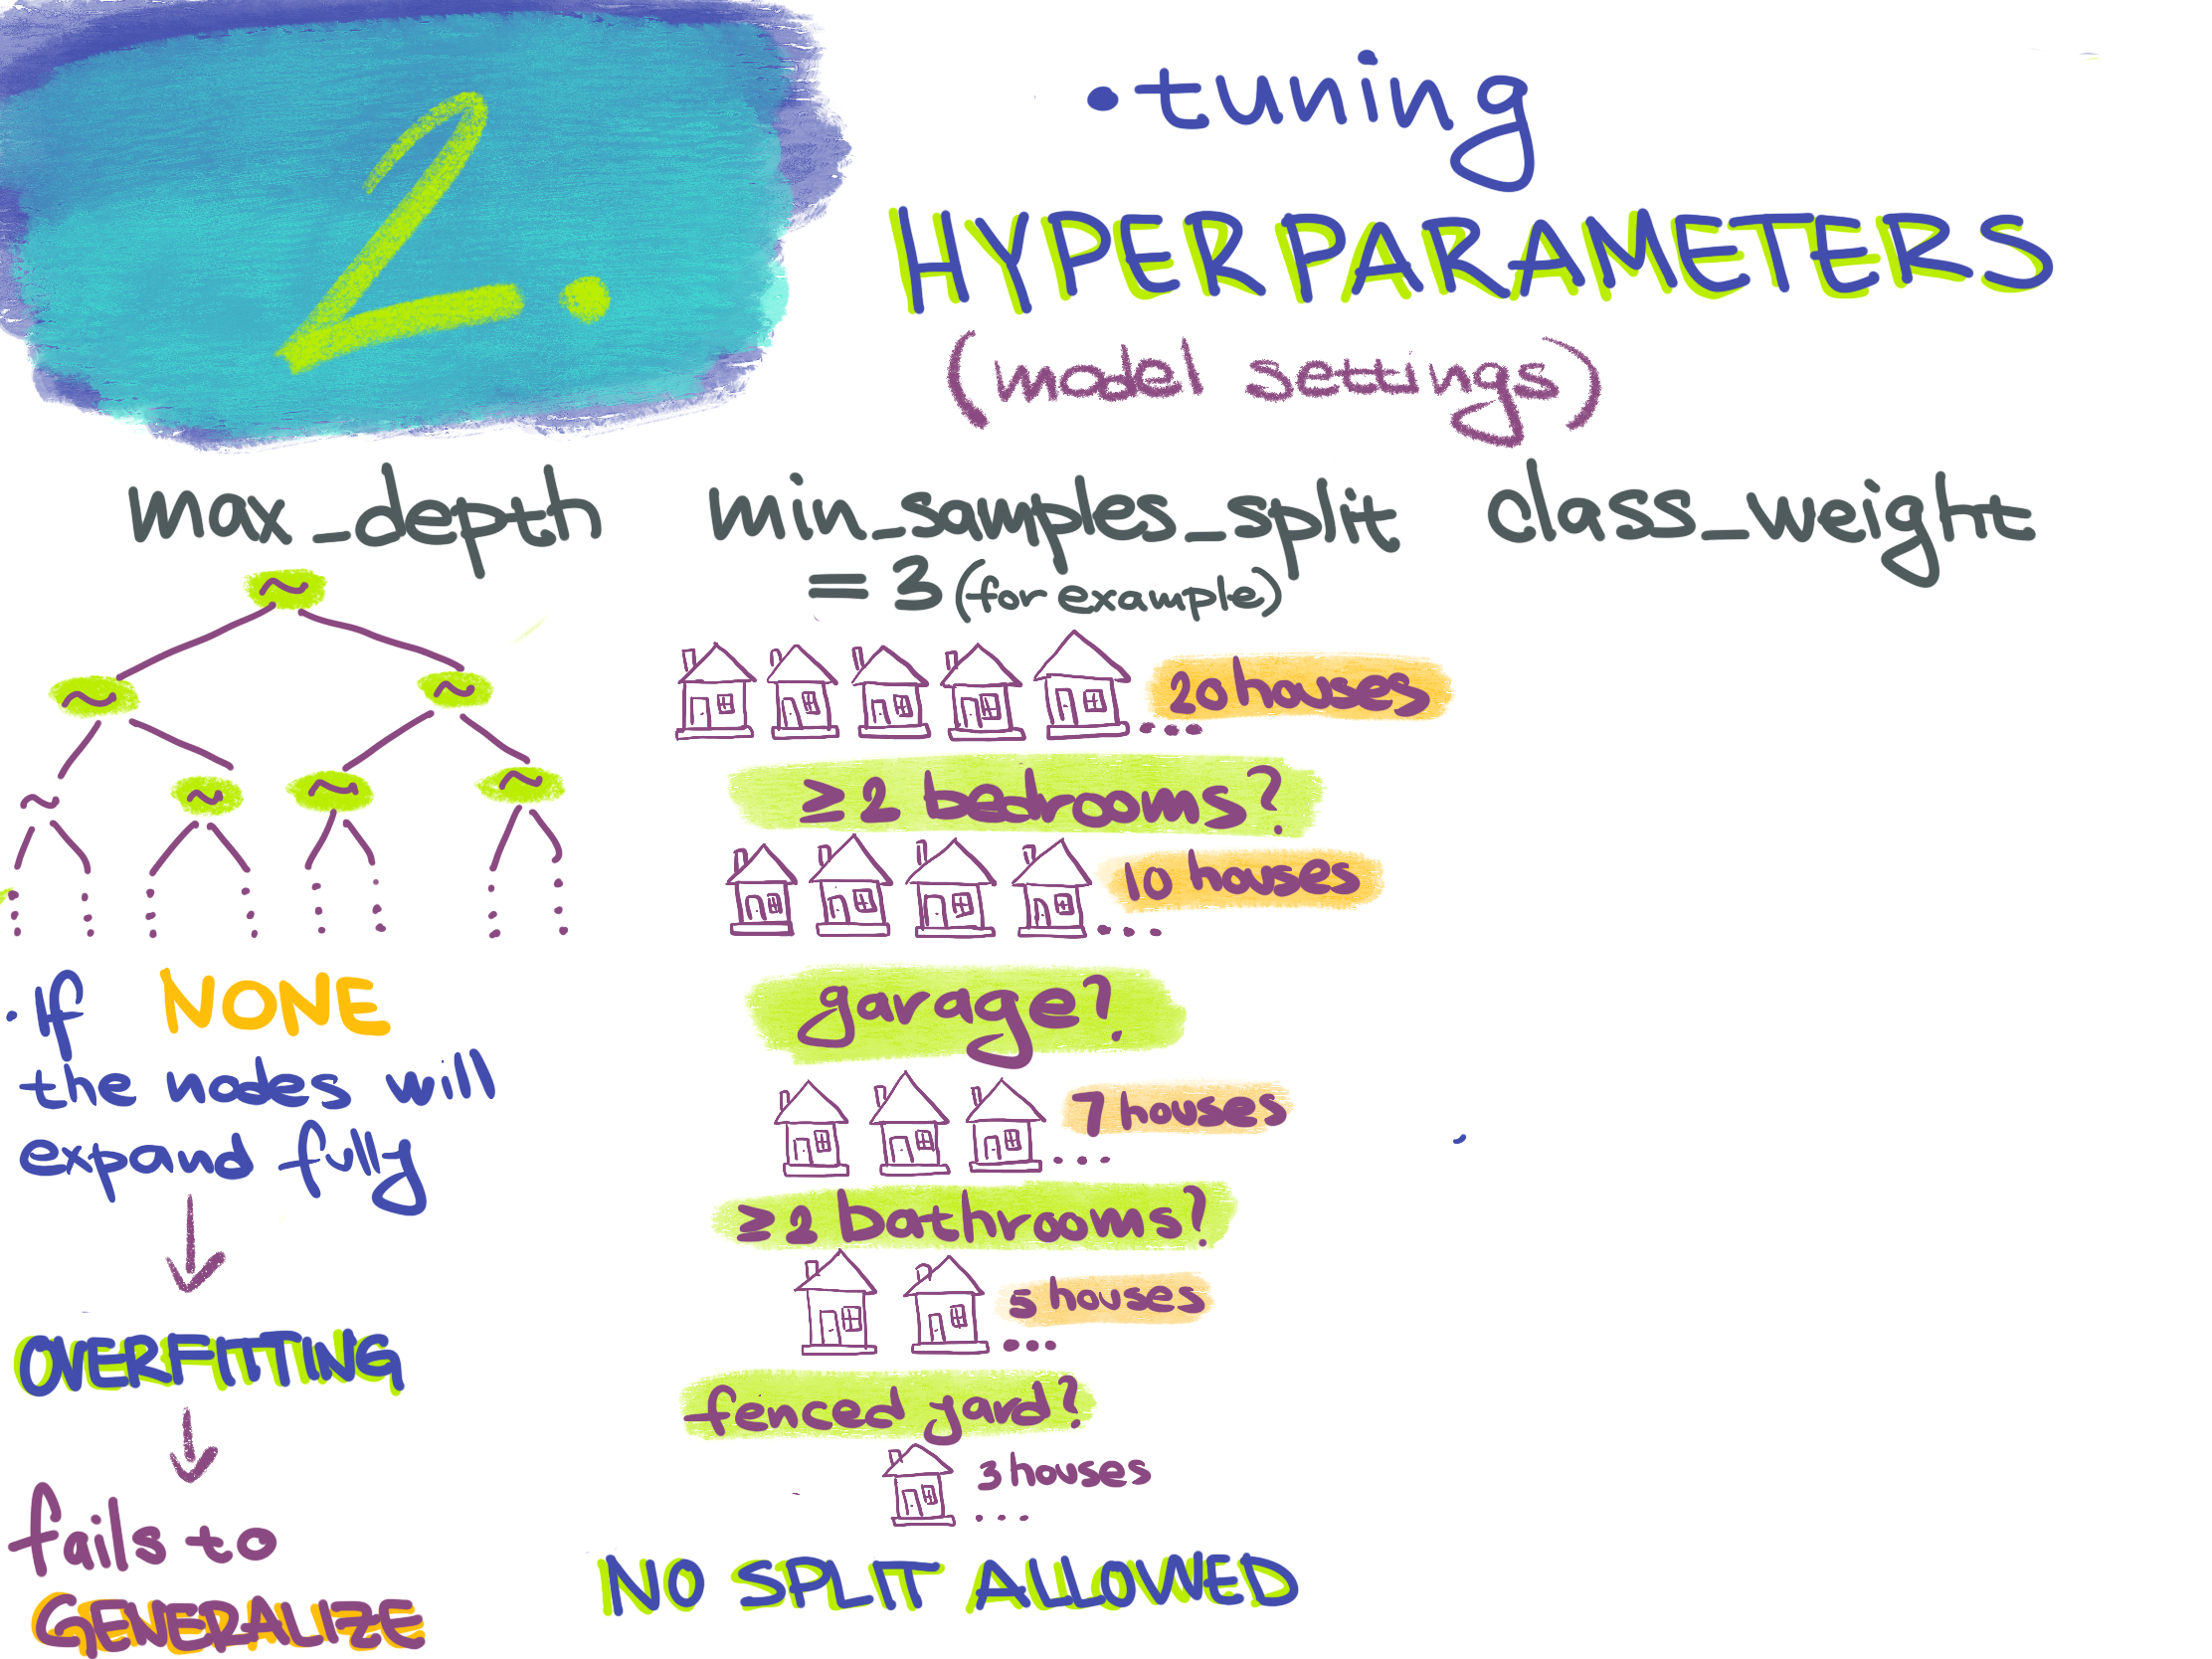
- Max_depth can be an integer or None. It is the maximum depth of the tree. If the max depth is set to None, the tree nodes are fully expanded or until they have less than min_samples_split samples.
- Min_samples_split and min_samples_leaf represent the minimum number of samples required to split a node or to be at a leaf node.
- Class_weight is important hyperparameter in biology research. If we had a training set and we are using binary classification, we don’t want to only predict the most abundant class. For example, in the T-cells example, if 2 samples are active and 98 samples are quiescent, we don’t want to train a model that predicts all of the cells to be quiescent. Class_weight parameter would allow putting weight on 2 cells labeled as active so that predicting them incorrectly would be penalized more. In biology, it is common to have this type of imbalanced training set with more negative than positive instances, so training and evaluating appropriately is essential! The uniform mode gives all classes the weight one. The balanced mode adjusts the weights.
Definition
Imbalanced training set - a data set that contains a large proportion of a certain class or classes.
Software
Train a decision tree with the default hyperparameter settings, then look at the Data Plot.
Conceptual Questions
What is the decision boundary?
Solution
If we look at the Data Plot, the decision boundaries are rectangular.
Question
What do the individual line segments which make up the decision boundary represent?
Solution
They each represent a node in the decision tree. The line segment shows the split at that node.
Conceptual Question
What hyperparameter might be important for this example? (hint: what is not ideal about this dataset?)
Software
One thing we can see from the data plot is that this dataset is imbalanced, with more quiescent cells than active cells. Let’s change the class_weight hyperparameter to balanced.
Activity
Did this make any difference?
How does the data plot look for the uniform class_weight and how does it look for the balanced class weight?
Random Forests
Random forests deals with the problem of overfitting by creating multiple trees, with each tree trained slightly differently so it overfits differently. Random forests is a classifier that combines a large number of decision trees. The decisions of each tree are then combined to make the final classification. This “team of specialists” approach random forests take often outperforms the “single generalist” approach of decision trees. Multiple overfitting classifiers are put together to reduce the overfitting.
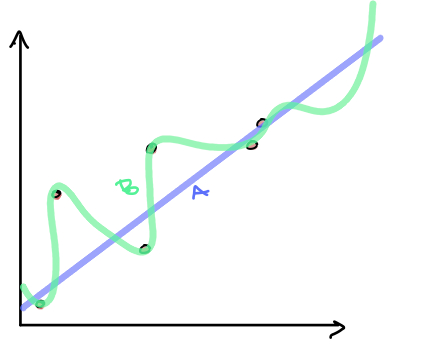
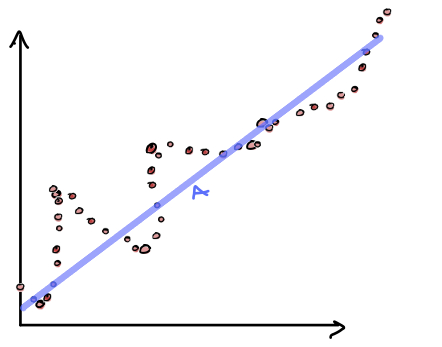
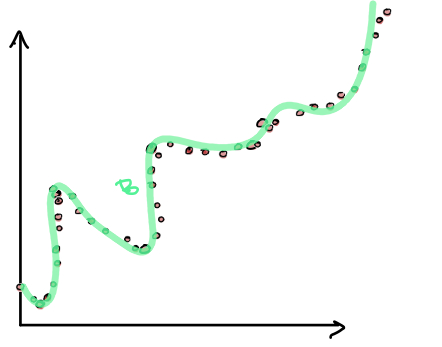
Motivation from the bias variance trade-off
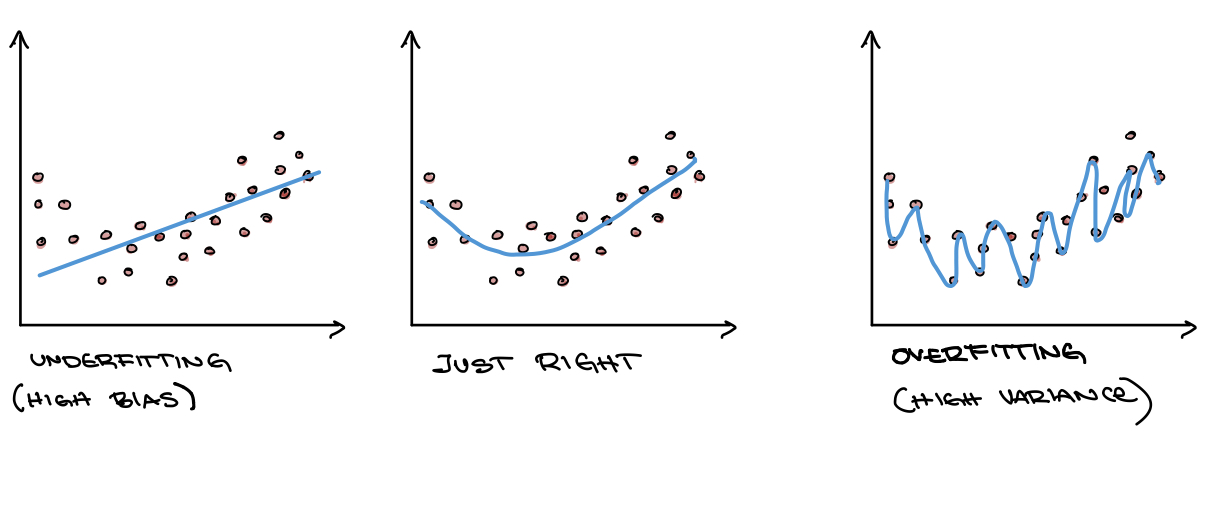
If we examine the different decision boundaries, note that the one of the left has high bias while the one on the right has high variance.
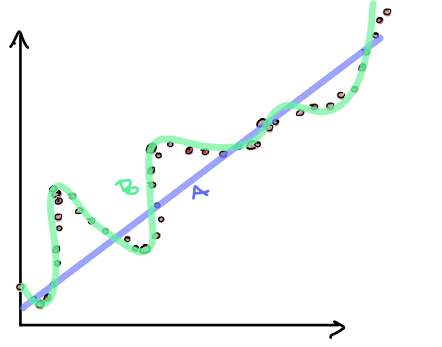
Definitions
Bias - The assumptions made by a model about what the decision boundary will look like. Models with high bias are less sensitive to changes in the training data.
Variance - The amount the training data affects what a model’s decision boundary looks like. Models with high variance have low bias.
Note that these concepts have more exact mathematical definitions which are beyond the scope of this workshop.
Random forests are based on mitigating the negative effects of this trade-off by creating multiple high variance models that work together.
Why is it called “random” forests?
If when training each tree in the forest, we give every tree the same data, we would get the same predictions that are prone to overfitting. In order to train the decision trees differently we need to provide slightly different data to each tree. To do this, we choose a random subset of the data to give to each tree. When training at each node in the tree we also randomize which features can be used to split the data. This method of creating random subsamples of data to make an ensemble of classifiers which are then combined is called bagging. The final prediction is based on a vote or the average taken across all the decision trees in the forest.
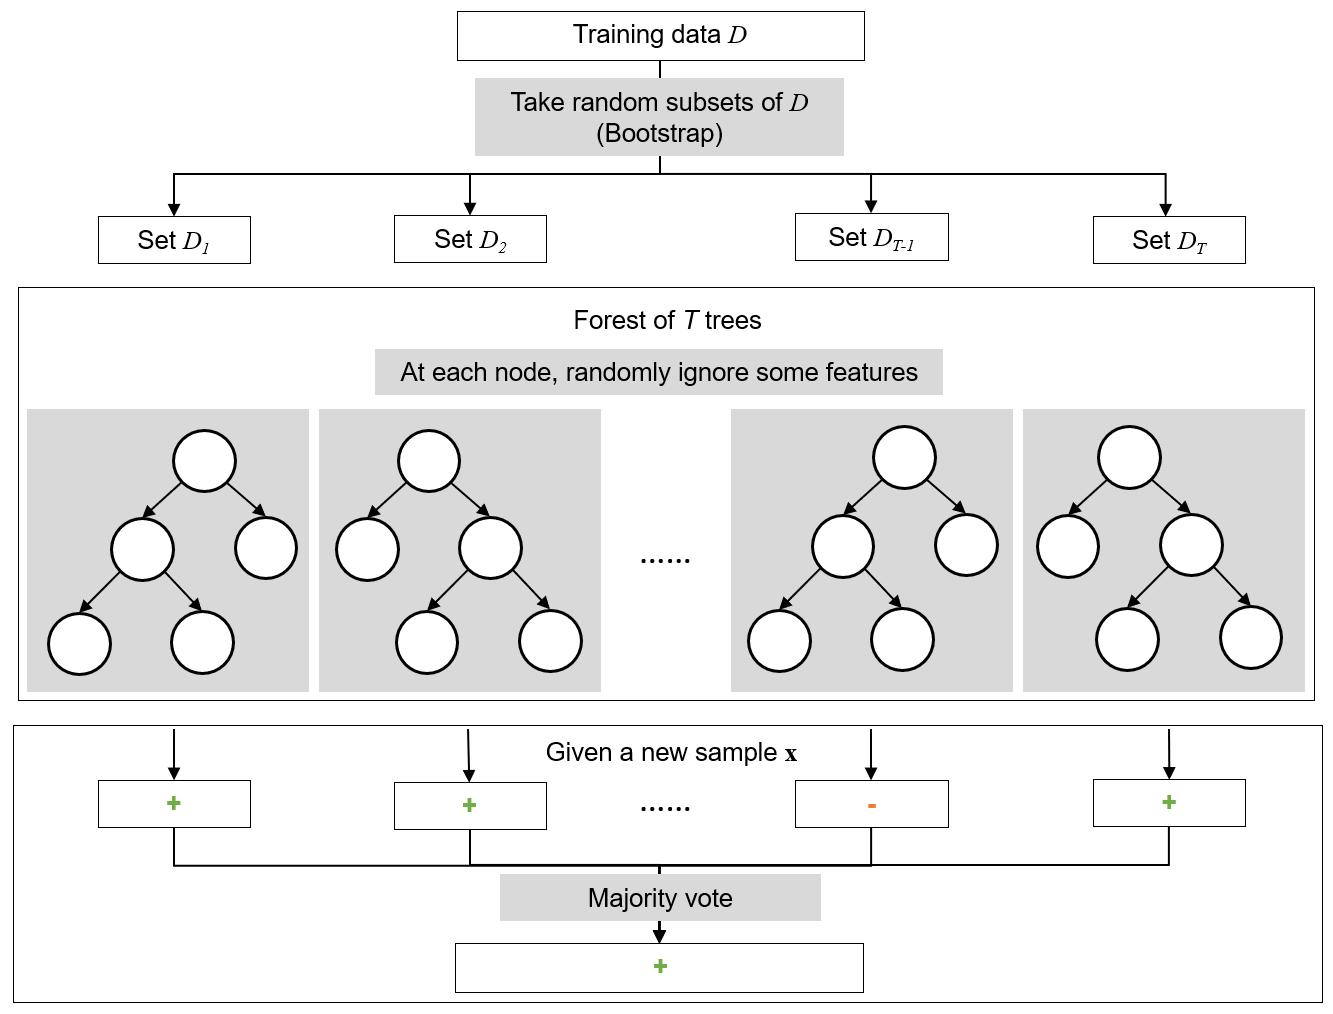
Definitions
Ensemble method - A general method where multiple models are combined to form a single model.
Bagging - An ensemble method where many training sets are generated from a single training set using random sampling with replacement. Models are then trained on each sampled training set and combined for a final prediction. It is short for bootstrap aggregating.
Overfitting Example
Software - Poll
Load
t_cell/cellprofiler_feature.csvdata set into the software.Try training both a decision tree and a random forest on the data.
What do you notice after you trained the model?
How did the classifier perform on the training data compared to the validation data?
Try training a decision tree with the max_depth hyperparameter set to 2.
Did you notice any difference?
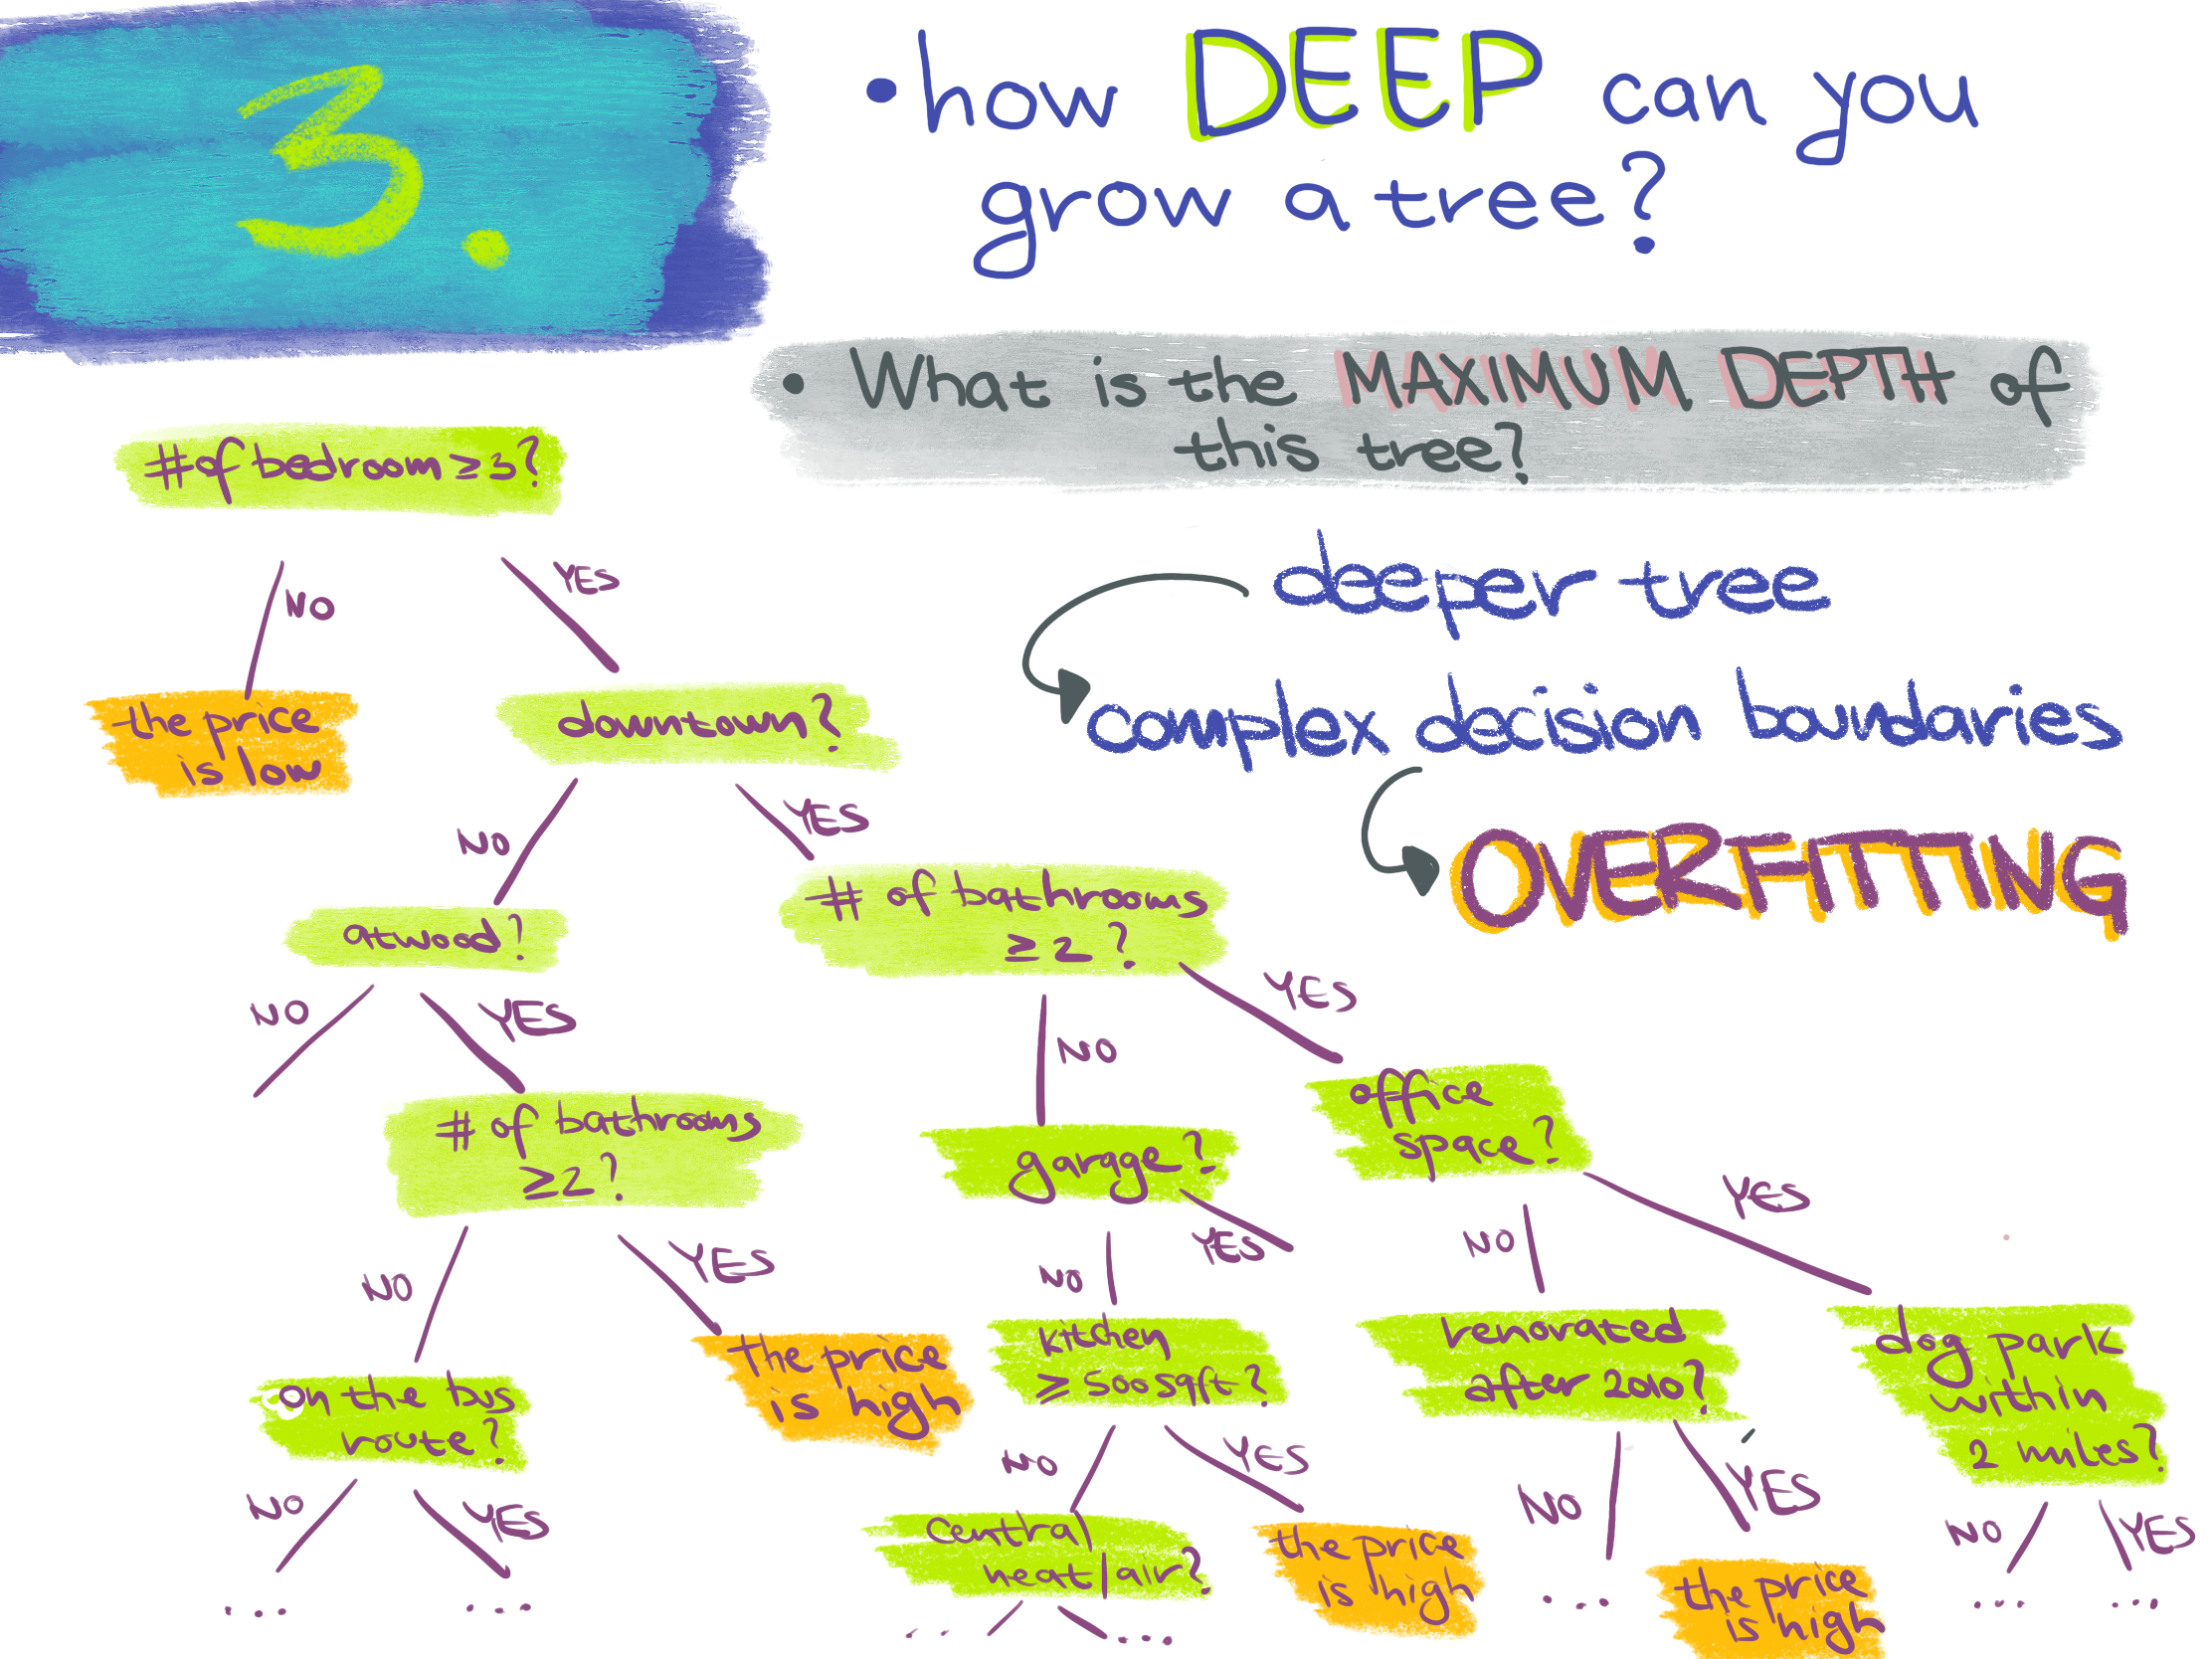
A good model will learn a pattern from the data and then it will be able to generalize the pattern on the new data.
It is easy to go too deep in the tree, and to fit the parameters that are specific for that training set, rather than to generalize to the whole dataset. This is overfitting. In other words, the more complex the model, the higher the chance that it will overfit. The overfitted model has too many features. However, the solution is not necessarily to start removing these features, because this might lead to underfitting.
The model that overfits has high variance.
Software
To check if the classifier overfit, first look at the training data.
Switch between training data and validation data in the upper right corner.
By looking at the evaluation metrics and the confusion matrix we can see that when the training data evaluation metrics were perfect, but they were not as great on the validation data. The classifier probably overfit.
Software
Let’s go to the Step 3 in the software.
Questions
Based on accuracy, which classifier was best-performing?
Did the classifier overfit?
Classifier selection scenarios - Poll
In the following scenarios, which classifier would you choose?
You want to create a model to classify a protein’s subcellular localization (nucleus, mitochondria, plasma membrane, etc.). You have a labeled set of 15,000 human proteins with 237 features for each protein. These features were computationally derived from simulations using protein structure predicting software, and do not have any predefined meaning. Thus, you do not expect the features to be meaningful for human interpretation.
You want to create a model to predict whether or not a species’ conservation status (least concern, endangered, extinct, etc.) will be affected by climate change. You have a labeled dataset of 40 species, with 18 features for each species which have been curated by ecologists. These features include information such as the species’ average size, diet, taxonomic class, migratory pattern, and habitat. You are interested to see which features are most important for predicting a species’ fate.
Application in biology
PgpRules: a decision tree based prediction server for P-glycoprotein substrates and inhibitors
Key Points
Decision trees require less effort to visualize interpret than other models
Decision trees are prone to overfitting
Random forests solve many of the problems of decision trees but are more difficult to interpret