Classifying T-cells
Overview
Duration: 45 minQuestions
What are the steps in a machine learning workflow?
Objectives
Define classifiers
Identify the parts of a machine learning workflow using machine learning terminology
Summarize the stages of a machine learning workflow
Describe how training, validation, and test sets can avoid data leakage
Why classify T-cells
Consider how to answer a biological question using machine learning. The question pertains to immunotherapy, a type of cancer treatment that uses the body’s immune cells to attack cancer. T-cells are a common target for immunotherapies. For immunotherapy to be effective, the modified T-cells must be in an active state. Here we will study how to assess the activation state of individual T-cells.
Scientists at UW-Madison and the Morgridge Institute developed an imaging method to quickly acquire images of T-cells without destroying them. These images contain information that can be used to predict T-cell activity. The goal is to develop a classifier that can take an image of a T-cell and predict whether it is active or quiescent. The active cells would then be used for immunotherapy, and the quiescent cells can be considered inactive and would be discarded.
Definitions
Active cells - Cells that have become active in their functions. For T-cells, this means increased cell growth and differentiation, typically after being activated by an antigen.
Quiescent cells - Cells that are in an inactive state.
Dataset description
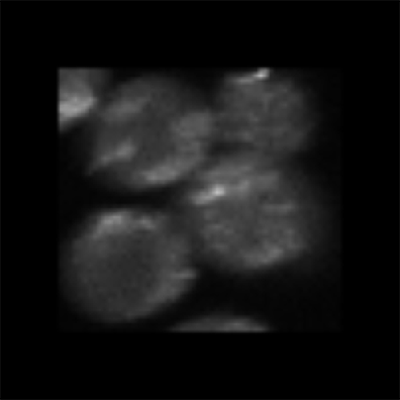
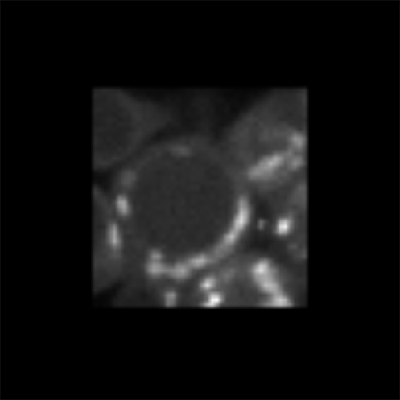
This microscopy dataset includes grayscale images of two type of T-cells: activated and quiescent. These T-cells come from blood samples from six human donors.
| Activated T-cell examples | Quiescent T-cell examples |
|---|---|
 |
 |
 |
 |
 |
 |
We will use a subset of the images and follow the workflow in a T-cell classification study.
Machine learning methods
The goal of this study is to develop a method to classify T-cell activation state (activated vs. quiescent).
Machine learning workflow
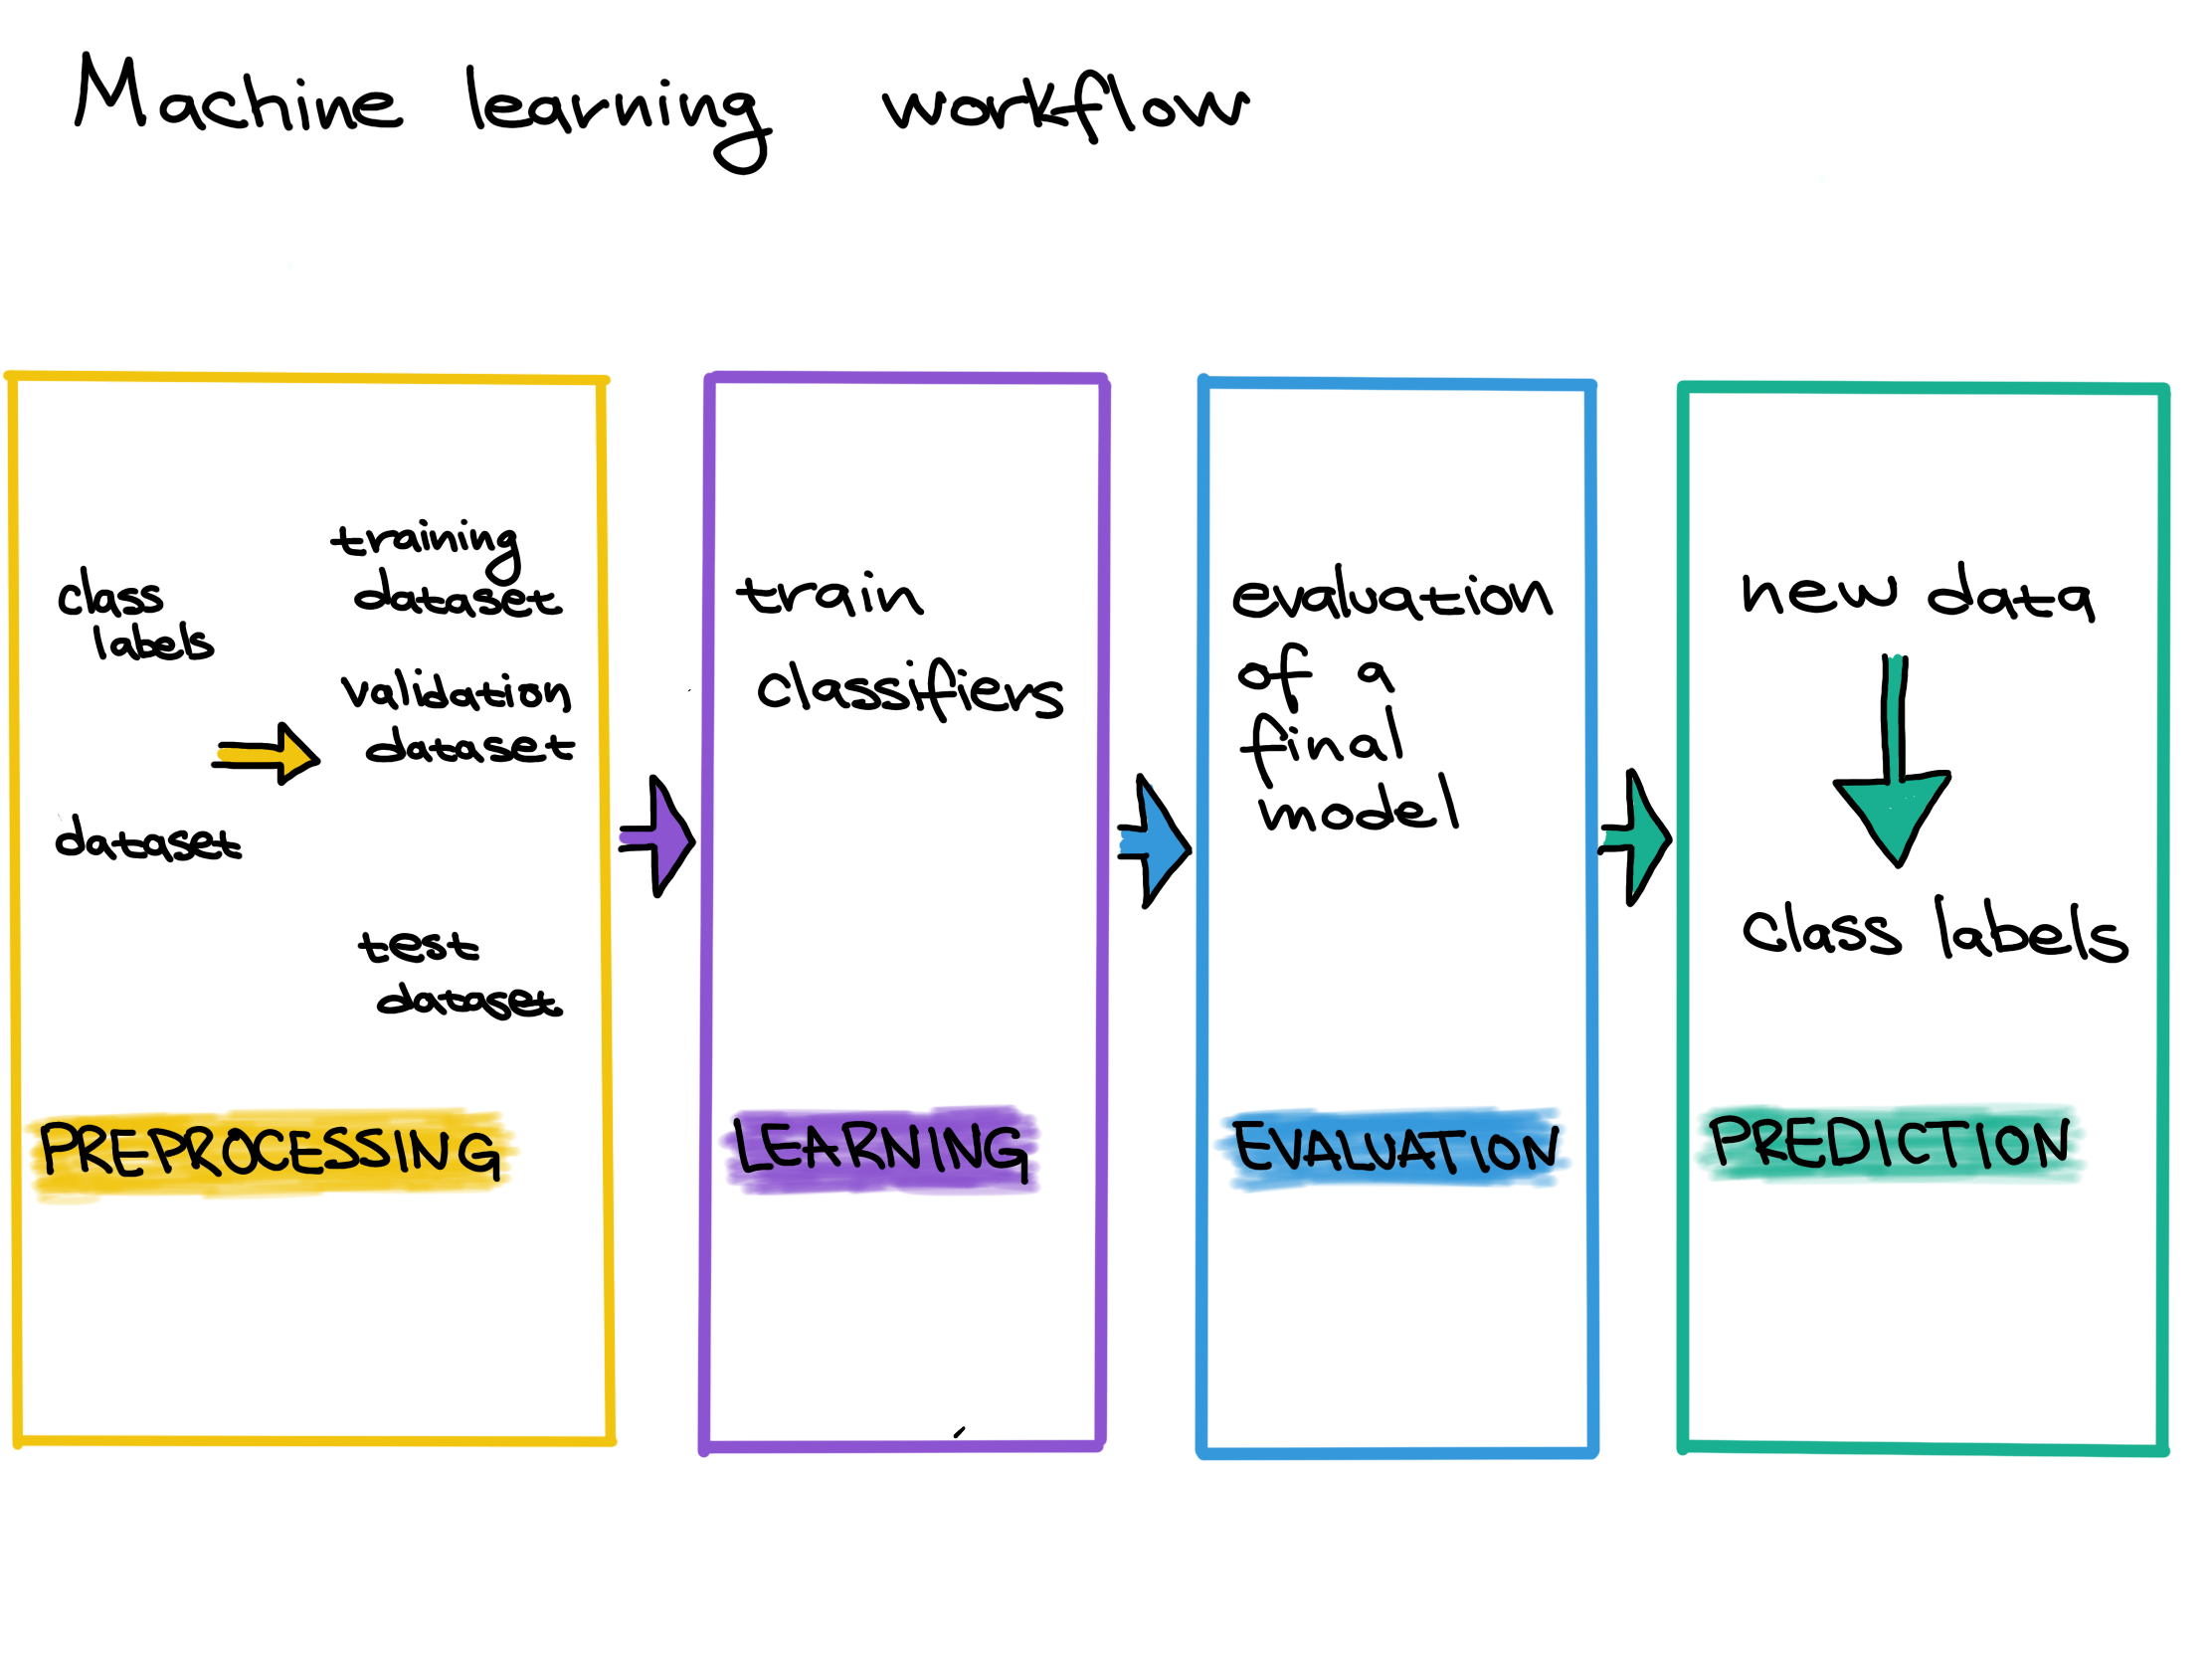
Before we can use a model to predict T-cell states, we have to do three steps:
- Preprocessing: Gather data and get it ready for use in the machine learning model.
- Learning/Training: Choose a machine learning model and train it on the data.
- Evaluation: Measure how well the model performed. Can we trust the predictions of the trained model?
Data preprocessing
The first step in machine learning is to prepare our data. Preprocessing the raw data is an essential step to have quality data for the model.
Definitions
Preprocessing - Anything done to a raw dataset before being used for analysis. This can include transformations, format changes, de-noising, removal of poor-quality data, or adding in data that is missing.
Missing values - Parts of a dataset that are not measured or reported. Missing values can be imputed, using statistics to guess their value, or removed.
Outliers - Parts of a dataset that are significantly different from the rest. Outliers can be caused by a true phenomenon or experimental error, in which case they may be removed or transformed to fit the rest of the dataset.
Data normalization - Transforming a feature or set of features of a dataset so they have a certain set of properties. An example would be changing a feature so that all of its values are between 0 and 1, or changing its variance to be 1.
Preprocessing data can include imputing missing values, checking the consistency of the data’s features, choosing how to deal with any outliers, removing duplicate values, and converting all features into a format that is usable by a machine learning algorithm. There are a variety of methods and tools for data normalization and preprocessing.
However, learning these methods and tools is outside the scope of this workshop. Preprocessing strategies are specific to both a dataset’s domain and the technology used to gather the data. Throughout this workshop, we will assume that all of the data has already been preprocessed.
In the T-cell study, preprocessing steps included removing images of red blood cells from the dataset, padding images with black borders to make them all the same size, and extracting cell features with Cell Profiler.
Step 1: Select data
Software
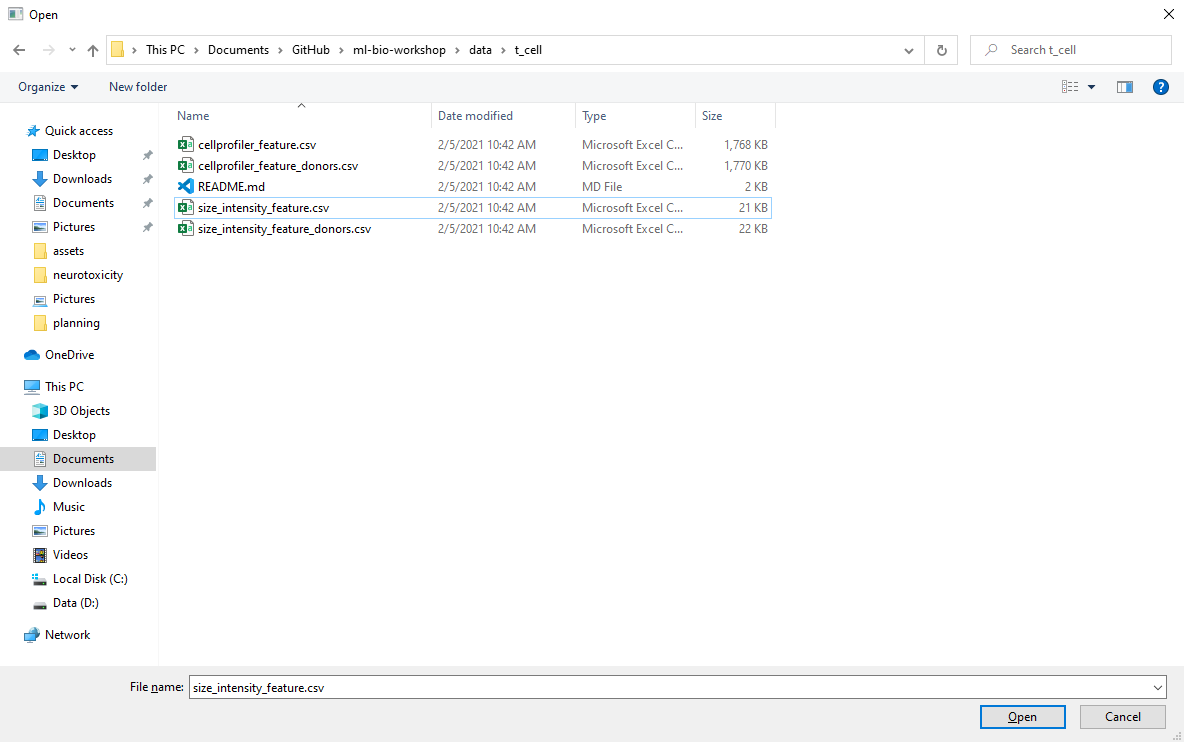
Load
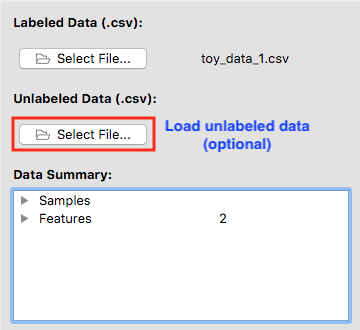
t_cell/size_intensity_feature.csvinto the ml4bio software under the Labeled Data by clicking on Select File…. Note that some of the screenshots below show different datasets being used.
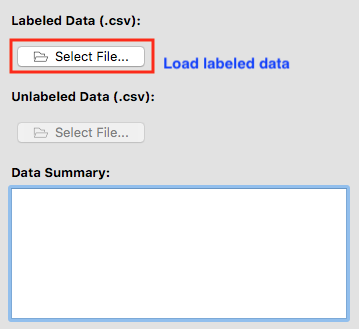
After a valid labeled dataset is loaded, the file name will be shown next to Select File….
Data summary
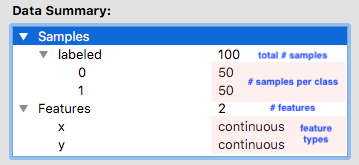
Data Summary gives us an insight into features, samples, and class for the dataset we selected.
Definitions
Sample - A specific observation in a dataset. In the T-cells example each T-cell is a sample. Also called instances or observations.
Class - The part of a dataset that is being predicted. In the T-cells example a T-cell’s state as active or quiescent is its class. Also called the target variable or label.
Feature - a property or a characteristic of the observed object. Used as an input.
Class label - prediction output. Also called the target variable or label.
In this particular dataset, we can see that we have two features cell_size and total_intensity. The total number of samples is 843.
Questions to consider
How many quiescent samples are in the dataset?
How many active samples?
Can we make any assumptions about the dataset based on the number of samples for each label?
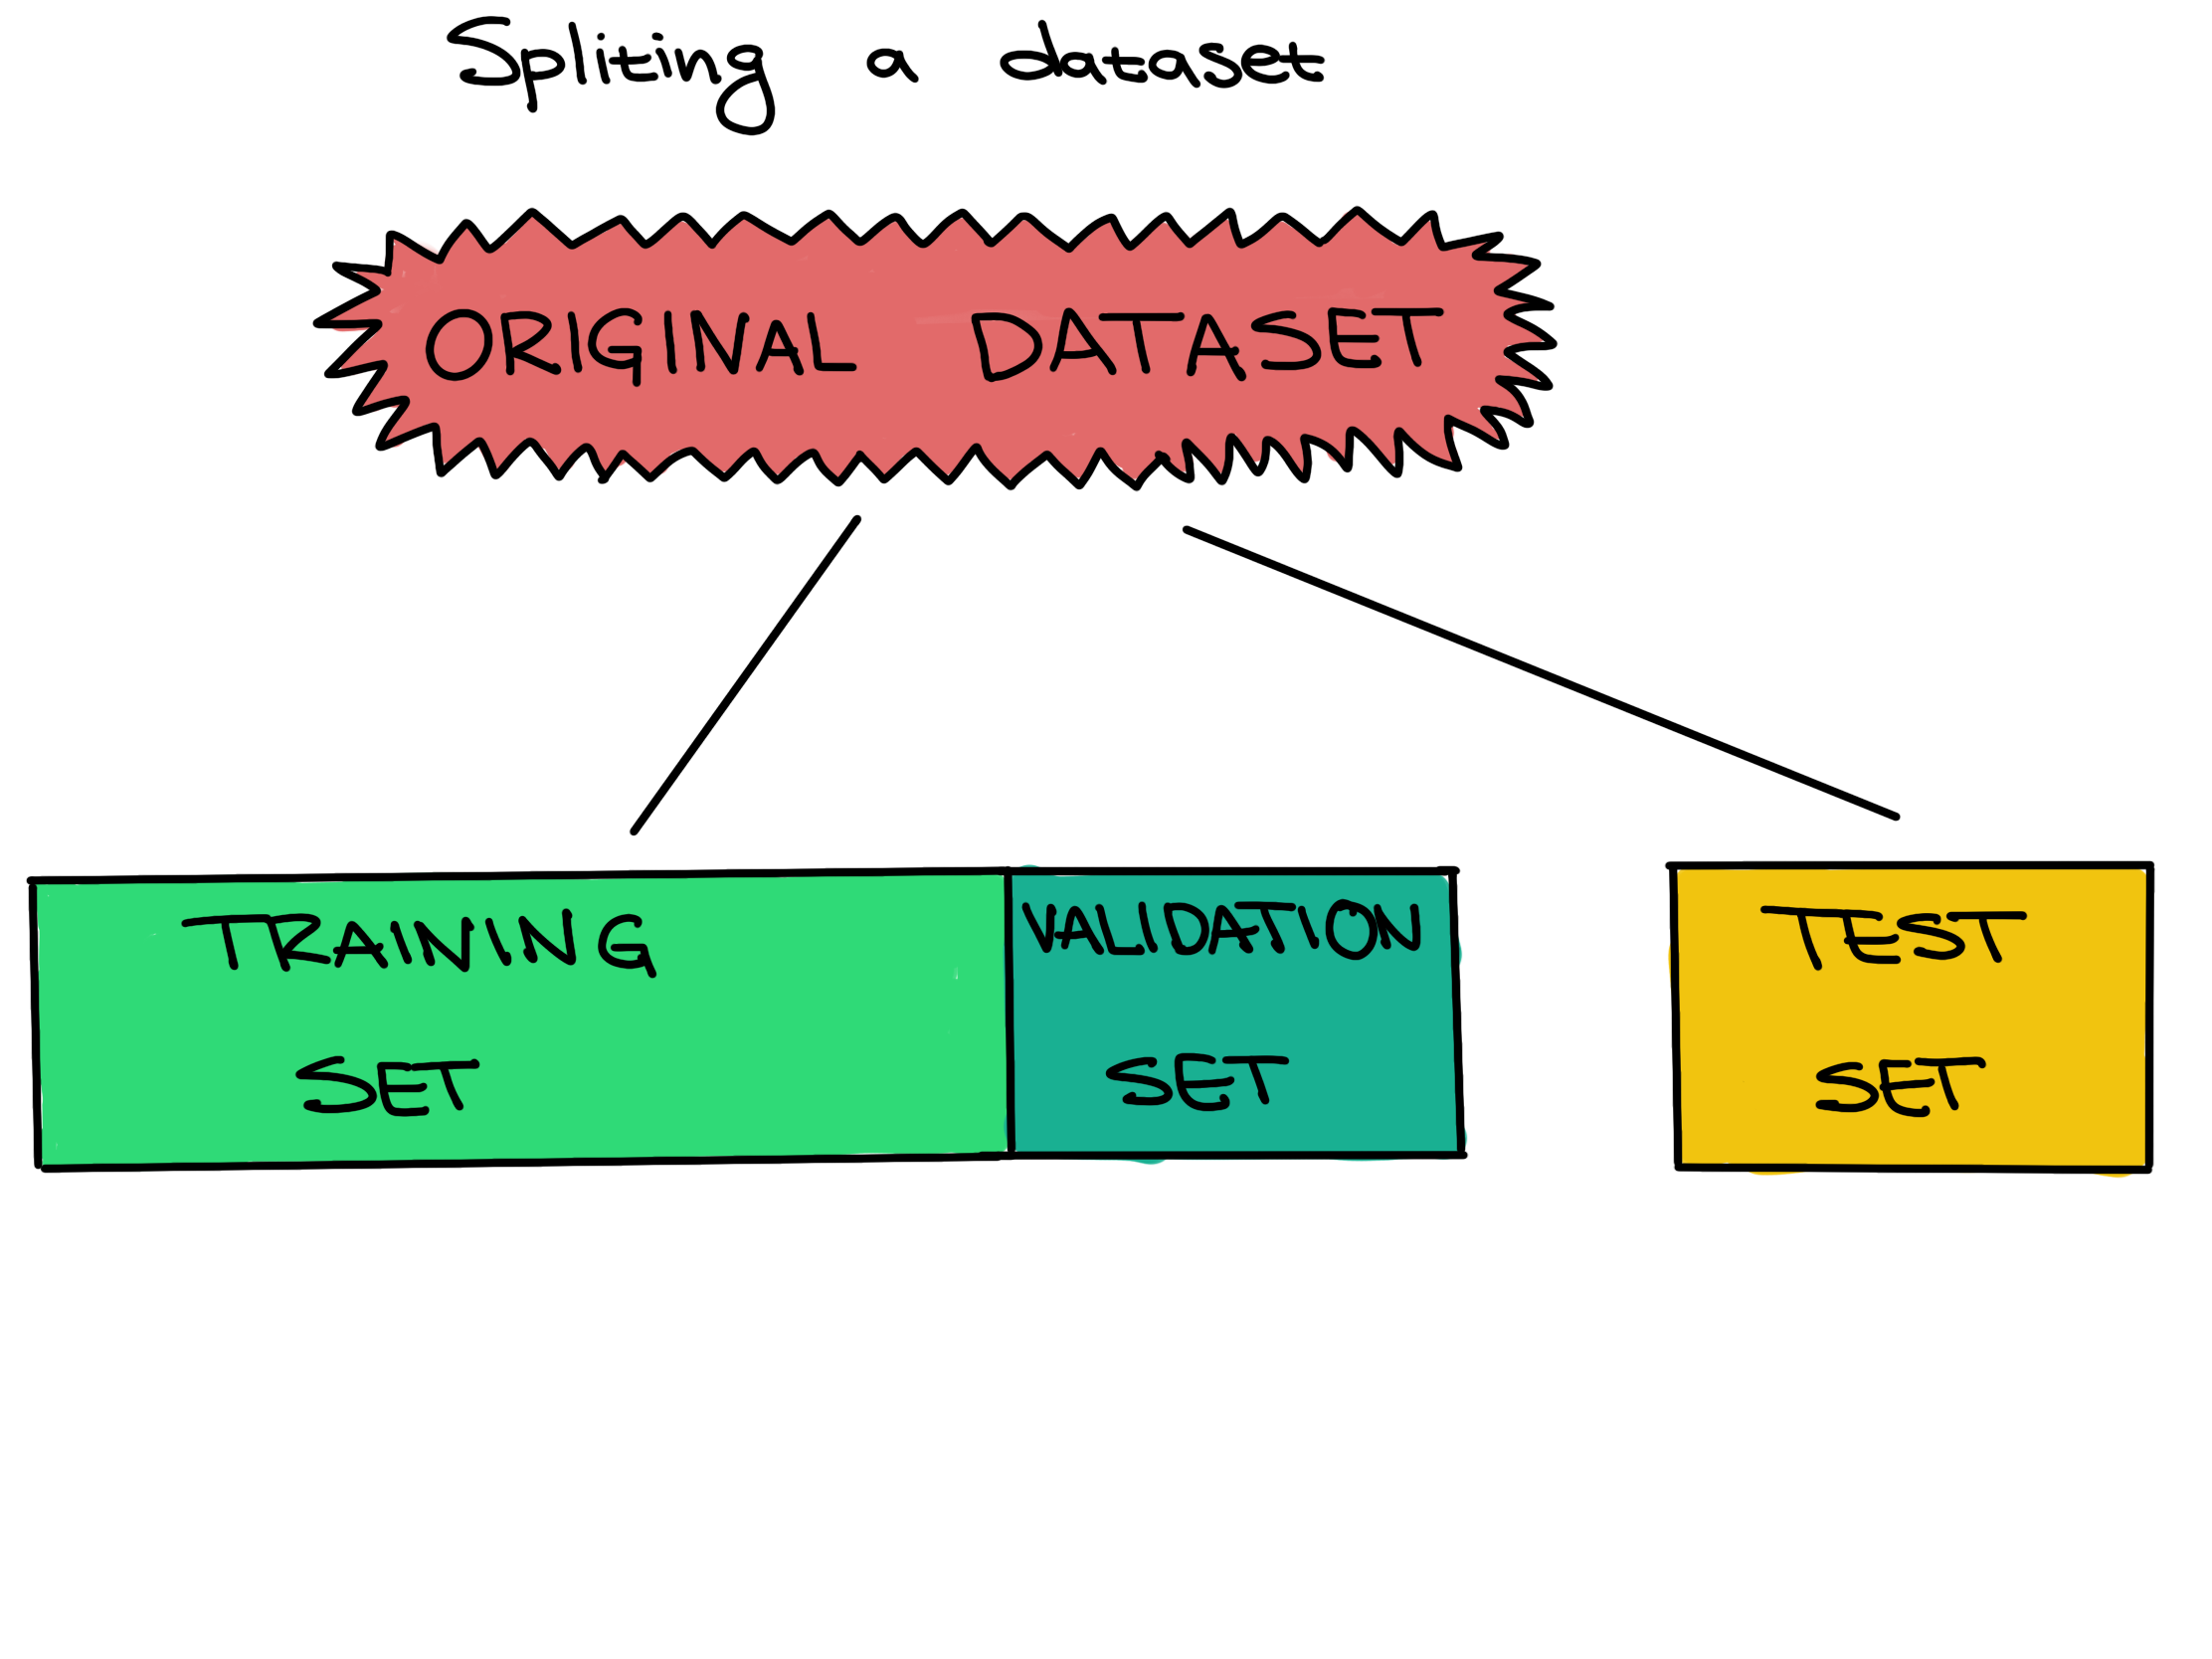
Training set vs. Validation set vs. Test set
Before we continue, split the dataset into a training set and a test set. The training set is further divided into a training set and a validation set.
Definitions
Training set - The training set is a part of the original dataset that trains or fits the model. This is the data that the model uses to learn patterns and set the model parameters.
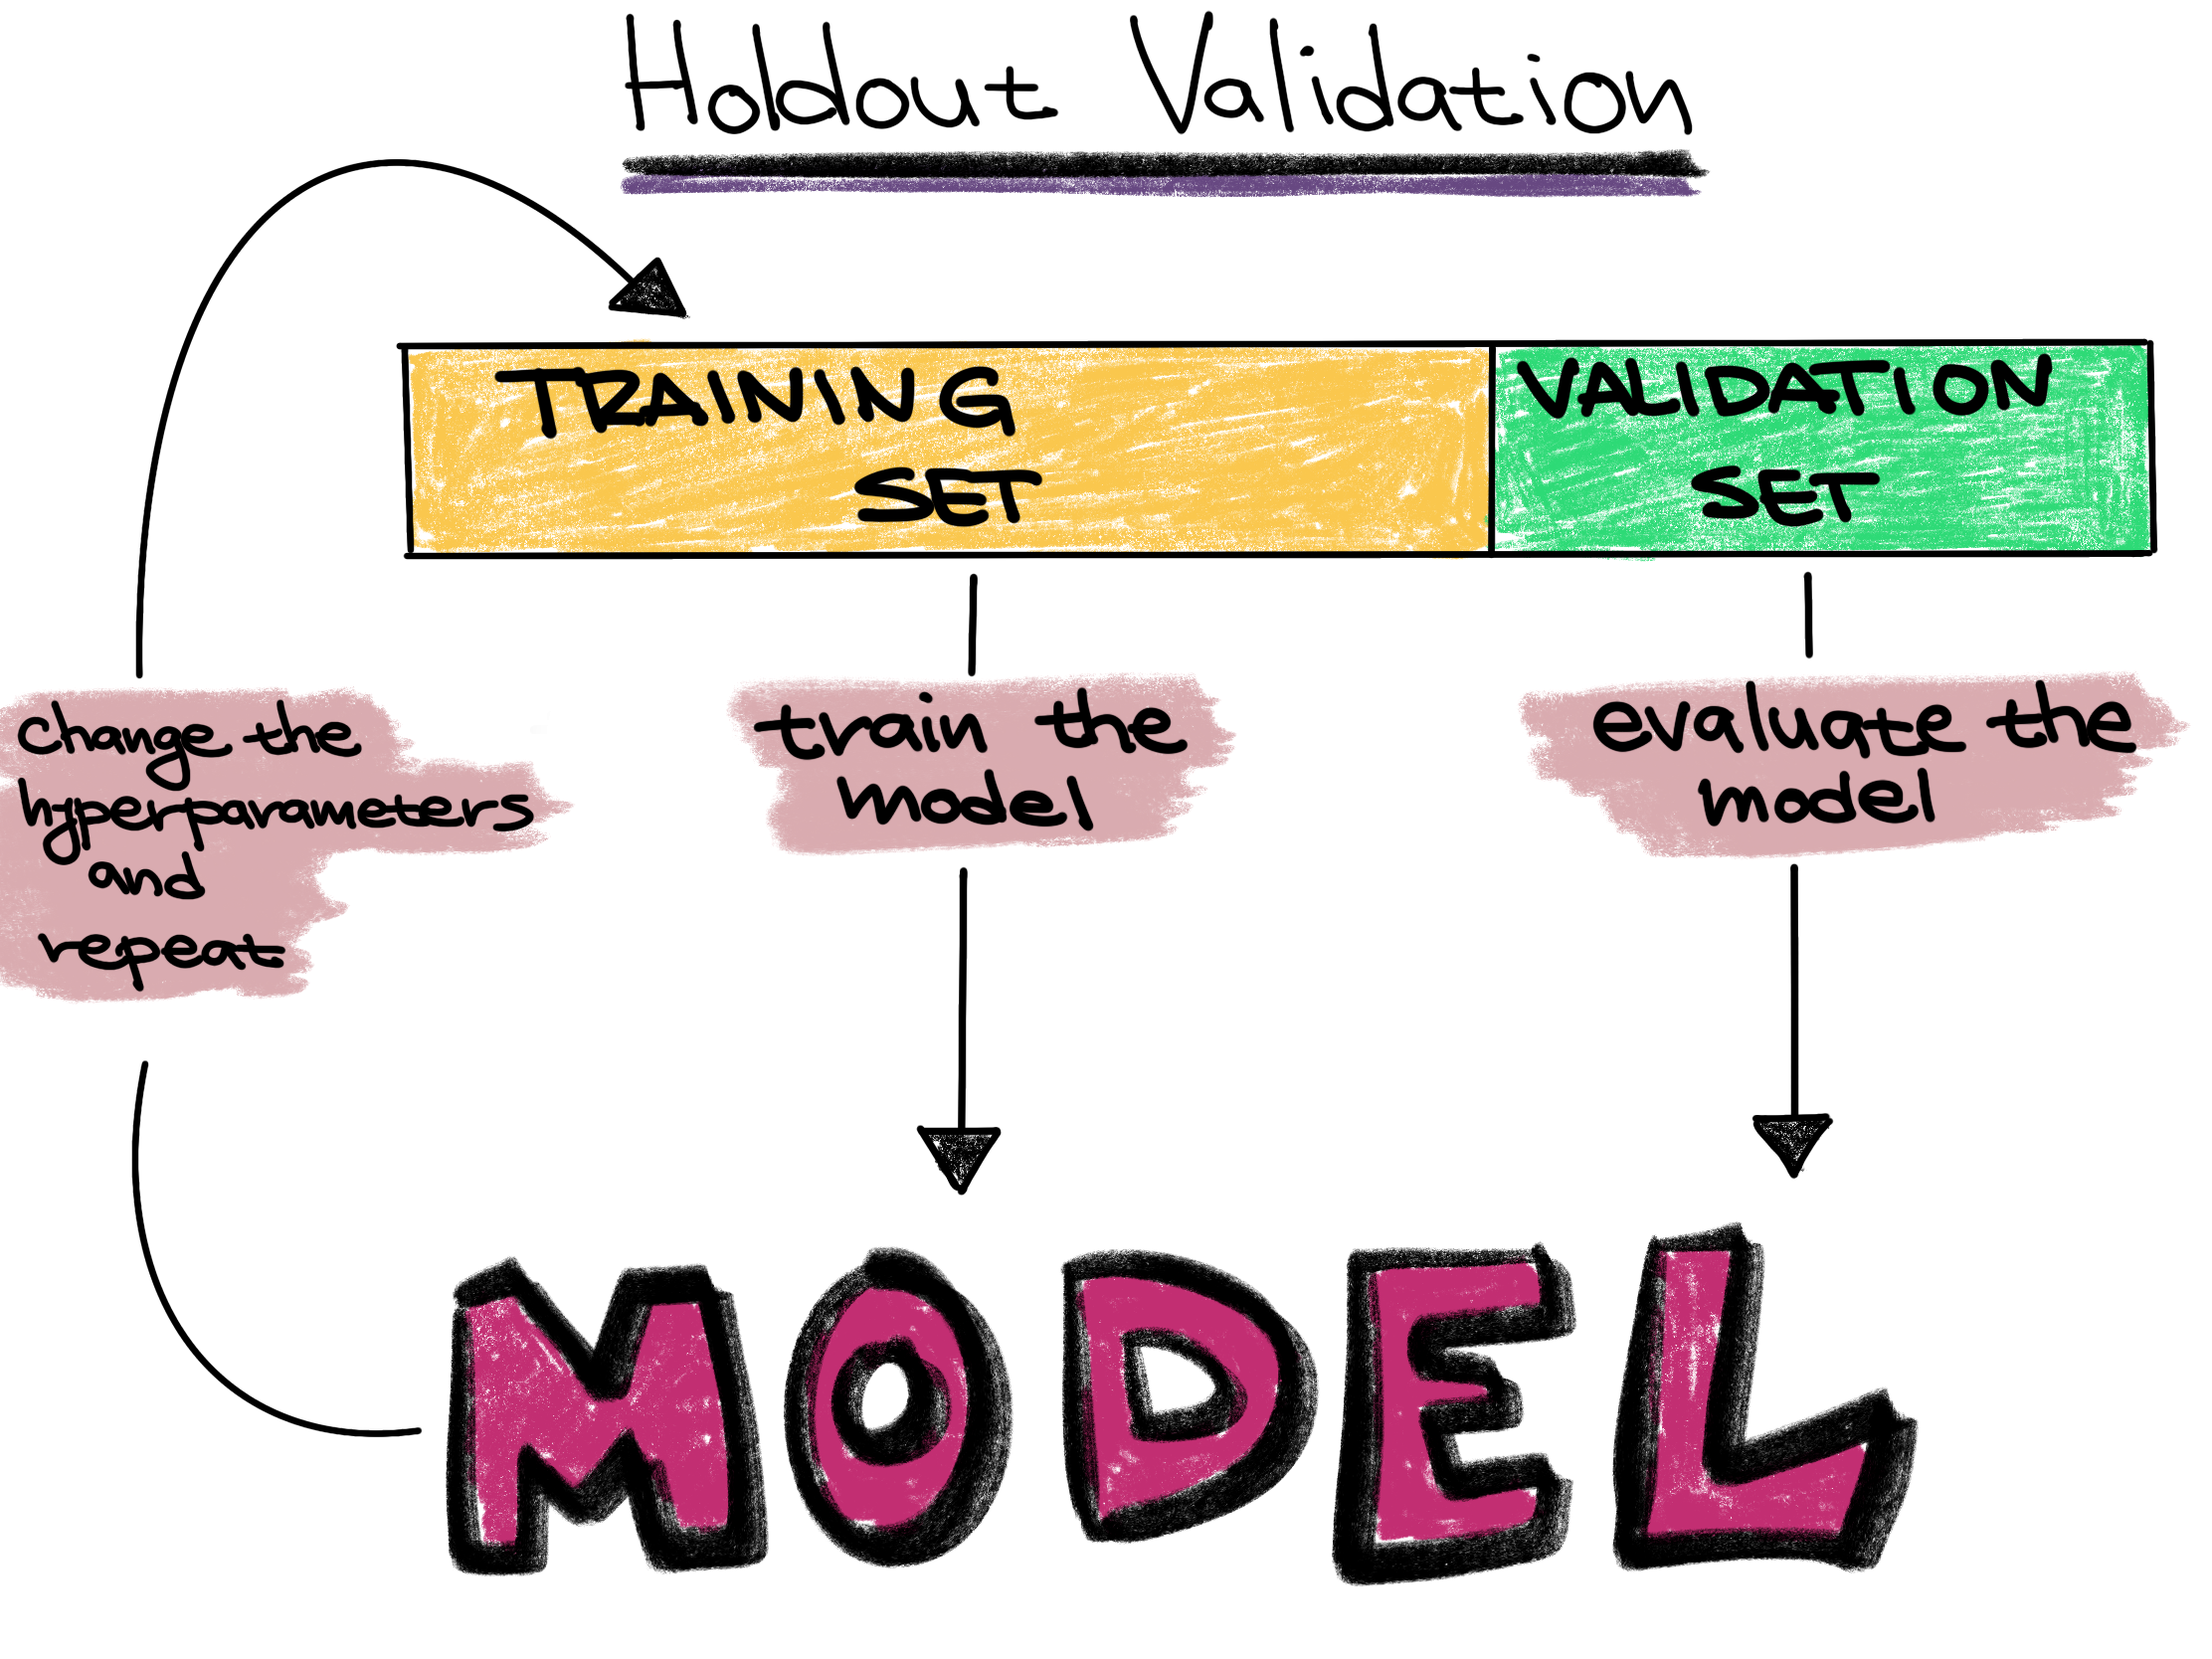
Validation set - Part of the training set is used to validate that the fitted model works on new data. This is not the final evaluation of the model. This step is used to change hyperparameters and then train the model again.
Test set - The test set checks how well we expect the model to work on new data in the future. The test set is used in the final phase of the workflow, and it evaluates the final model. It can only be used one time, and the model cannot be adjusted after using it.
Parameters - These are the aspects of a machine learning model that are learned from the training data. The parameters define the prediction rules of the trained model.
Hyperparameters - These are the user-specified settings of a machine learning model. Each machine learning method has different hyperparameters, and they control various trade-offs which change how the model learns. Hyperparameters control parts of a machine learning method such as how much emphasis the method should place on being perfectly correct versus becoming overly complex, how fast the method should learn, the type of mathematical model the method should use for learning, and more.
Setting a test set aside from the training and validation sets from the beginning, and only using it once for a final evaluation, is very important to be able to properly evaluate how well a machine learning algorithm learned. If this data leakage occurs it contaminates the evaluation, making the evaluation not accurately reflect how well the model actually performs. Letting the machine learning method learn from the test set can be seen as giving a student the answers to an exam; once a student sees any exam answers, their exam score will no longer reflect their true understanding of the material.
In other words, improper data splitting and data leakage means that we will not know if our model works or not.
Definitions
Data leakage - A model being influenced by data outside the training and validation sets. Data leakage can result in incorrectly estimating how well that model is performing.
Scenarios - Poll
In the following excerpts, consider the methodology presented and determine if there is evidence of data leakage:
We created a decision tree model to predict whether a compound would inhibit cell growth. We trained the model on the 48 available instances, and found that the decision tree was able to predict 96 percent of those instances correctly. Thus, the decision tree is high performing on this task.
We trained 36 different models, each using a different combination of hyperparameters. We trained each model on 80% of the data, withholding 20% of the data to test each model. We present the highest performing model to show the effectiveness of machine learning on this task.
We split the data into training and testing sets of 80% and 20%, and further split the training set into a training and validation set. We trained 200 models on the training data, and chose the best-performing model based on performance on the validation set. After choosing and training the model, we found that the model was able to predict correctly 93 percent of the time on the testing set.
Cross Validation
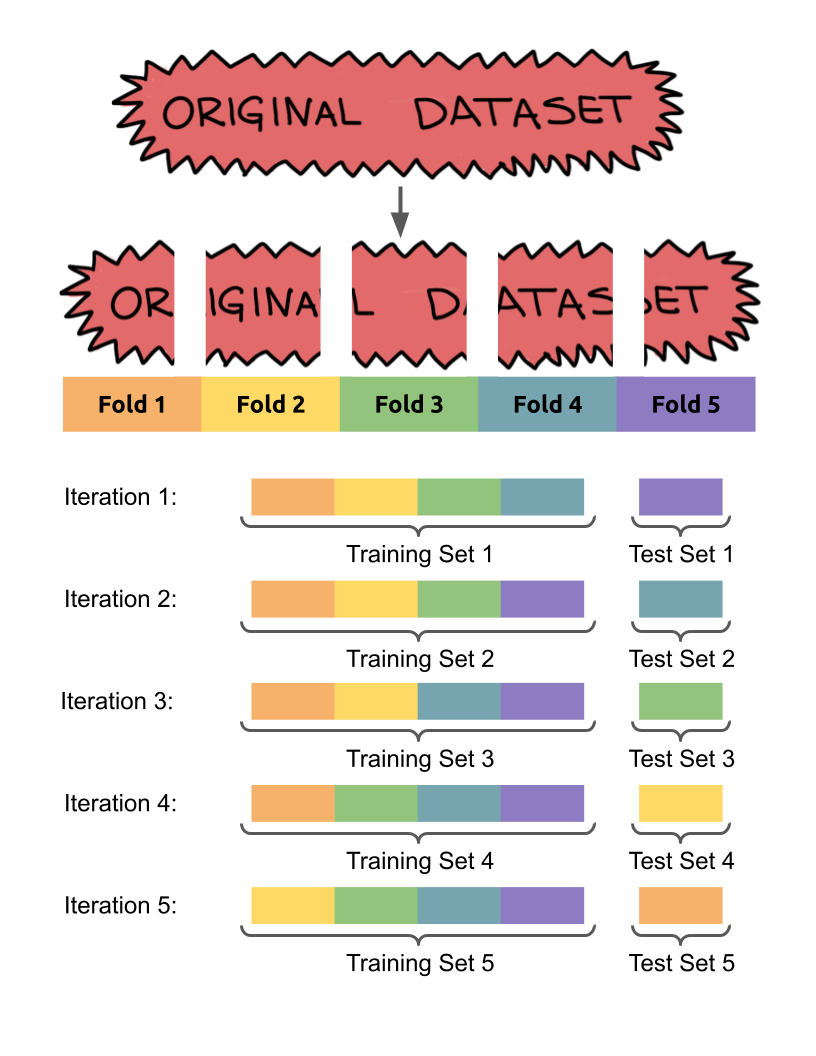
Cross validation is a data splitting method based on holdout validation which allows more information about the performance of a model to be gathered from a dataset. The data is split into training and testing sets multiple times in such a way that every instances is included in the testing set once. The number of times the data is split is referred to as the number of folds. For instance, 5-fold cross validation would split a dataset into 5 equal subsets, then run 5 different iterations of training and testing:
Software
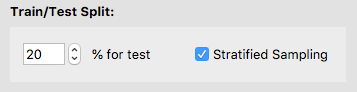
We will be using the holdout validation method in the software. This reserves a single fixed portion of the data for evaluation.
We will use the software’s default of 20% of the training set for the validation set.
Select Next to proceed to Step 2.
Step 2: Train classifiers
Classification is a process where given some input we are try to predict an outcome by coming up with a rule that will guess this outcome. Tools that use classification to predict an outcome are classifiers.
Definitions
Classification - The task in supervised learning when the label is a category. The goal of classification is to predict which category each sample belongs to.
Classifier - A specific model or algorithm which performs classification.
Regression - The task in supervised learning when the label is numeric. Instead of predicting a category, here the value of the label variable is predicted.
Software
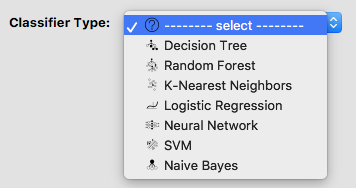
The software has a dropdown menu of some of the most frequently used classifiers. Choose one of them to continue with for this lesson.
In this workshop, we will be further talking about Decision Trees, Random Forests, Logistic Regression, and Artificial Neural Networks.
Each classifier has its own hyperparameters specific to that classifier that can be tuned. Intuitively, think of the hyperparameters as the “knobs and dials” or settings of the classifier. You can adjust the hyperparameters and explore how they impact performance on the training and validation sets. If you train an SVM, you will have to increase the max_iter parameter to be at least 1000.
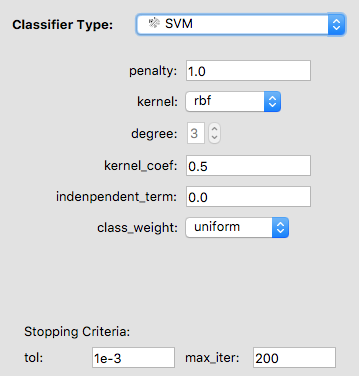
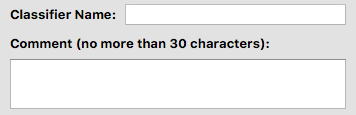
You may give your classifier a name and add a comment. If you do not specify a name, the software will use “classifier_[int]” as its default name. For example, if the classifier is the third one you trained, its default name is “classifier_3”.
Software
If you changed the hyperparameters but want to start over, click on Reset. The hyperparameters will be back to default. Otherwise, click on Train.
We will use accuracy to evaluate the classifiers. Accuracy measures the fraction of the predictions that are correct. In the T-cells dataset, this is the number of correctly predicted quiescent and activated cells compared to the total number of predictions made.
Software
In the software, look at the prediction metrics on the validation data.
Remember, you can switch between the training set and validation set at any time.
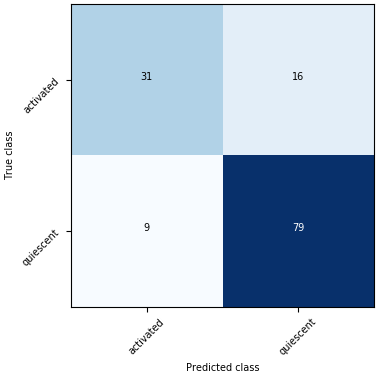
In the T-cells example, we want to predict whether a cell was quiescent or activated. The accuracy gives us the count of the cells that were correctly predicted.
This type of exploration of multiple algorithms reflects how a good model is often found in real-world situations. It often takes many classifiers to find the one that you are satisfied with.
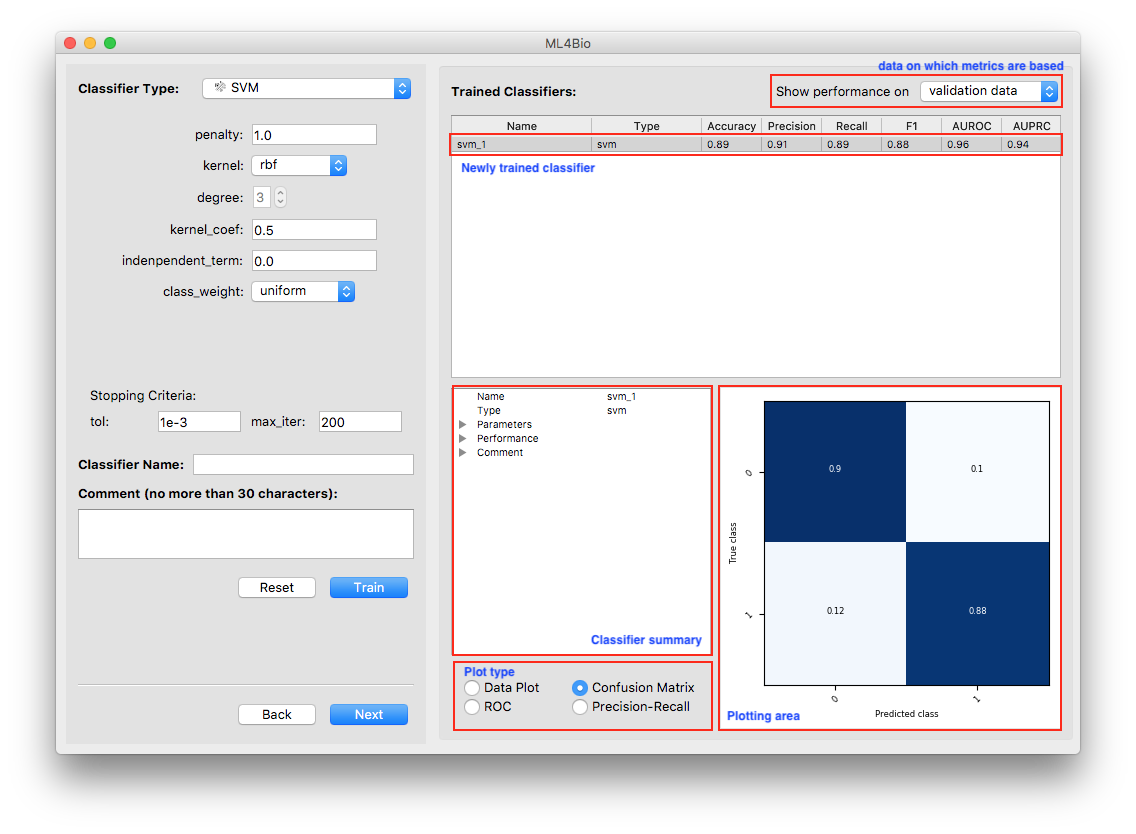
At the bottom right of the software window, there is a variety of information about the trained model.
Three types of plots that reflect the classifier’s performance are always available. The data plot is only available when the dataset contains exactly two continuous features. Note that the plots are all with respect to the type of data shown at the top-right corner of the software window.
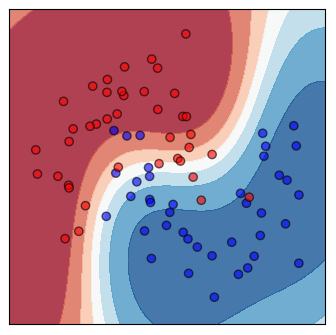
Shown on the top is a scatter plot of the training data and contours of the decision regions. This is a visualization of the decision boundary of the classifier. The darker the color, the more confident the classifier is.
Shown on the bottom is the confusion matrix. The Confusion Matrix reflects the selected dataset (training or validation). The T-cells dataset has two labels so that the Confusion Matrix will be 2 x 2. The sum of all the predictions will be the total number of samples in the selected dataset (training or validation).
Software - Poll
Train a few different classifiers and explore the following questions:
How does the decision boundary change as the classifier and hyperparameters change?
What is the highest validation set accuracy you can achieve?
How does this compare to the training set accuracy?
Definitions
Decision boundary - A region where all the patterns within the decision boundary belong to the same class. It divides the space that is represented by all the data points. Identifying the decision boundary can be used to classify the data points. The decision boundary does not have to be linear.
Confusion matrix - A matrix used in classification to visualize the performance of a classifier. Each cell shows the number of time the predicted and actual classes of samples occurred in a certain combination.
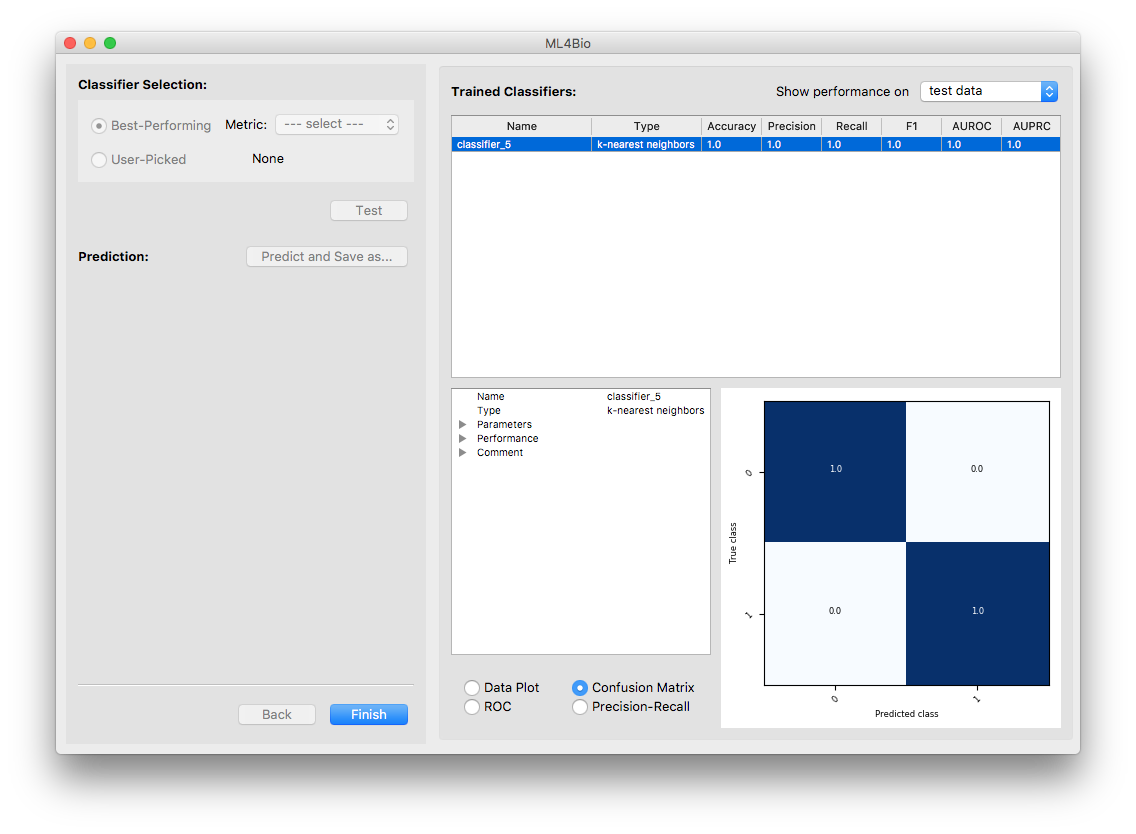
Step 3 Test and Predict
Our final step is model selection and evaluation. After we trained multiple classifiers and did holdout validation, the next step is to choose the best model. Hit Next to continue.
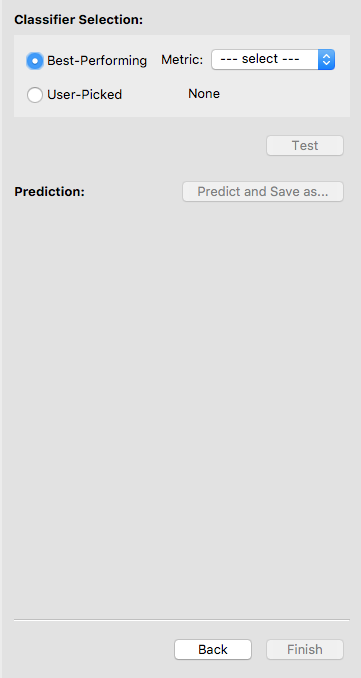
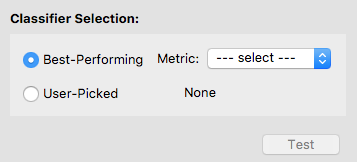
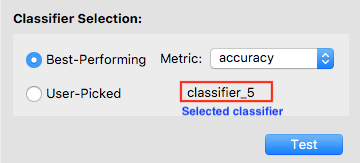
To select a classifier, you may let the software pick one for you by specifying a metric. In this case, the software will select the best classifier with respect to that metric. Otherwise, you may pick a classifier on your own. We let the software select the classifier with the highest accuracy.
After a classifier is selected, its name will show up. Double-check that it is the one you want to test. Now the Test button is enabled, and you may click on it to test the selected classifier. Note that once you hit Test, you are no longer allowed to go back and train more classifiers.
Now the only classifier in the list is the tested one. Note that the software is showing the classifier’s performance on the test data. You may examine the performance using either the summary or the plots.
Questions to consider
How did your final test set accuracy compare to your validation accuracy?
Image attributions
The T-cell images come from Wang et al. 2019 with data originally from Walsh et al. 2020.
Break
Let’s take a short break.
Key Points
The ml4bio software supports interactively exploring different classifiers and hyperparameters on a dataset
The machine learning workflow is split into data preprocessing and selection, training and model selection, and evaluation stages
Splitting a dataset into training, validation, and testing sets is key to being able to properly evaluate a machine learning method