ICA artifact isolation (removal)
Overview
Teaching: 0 min
Exercises: 0 minQuestions
How can ICA be used to isolate signal from noise?
What types of EEG artifacts can be isolated with ICA
How are ICA corrections performed?
Objectives
Understand how ICA can be used to clean EEG from specific types of artifacts
An ICA model provides a signal factor layer to the EEG file
With an ICA model present in the EEG structure factors can be purged from the data instead of channels or time points
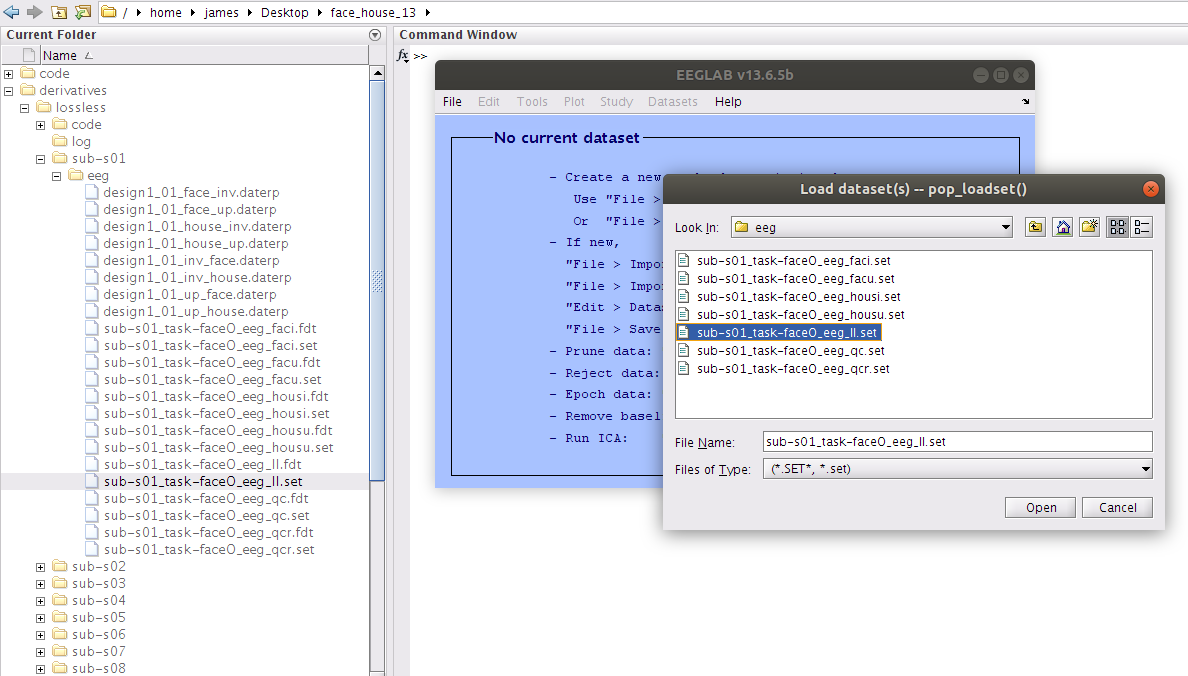
The data in the derivatives/lossless folder of the demo project were pre-processed with a pipeline whose goal is to establish a reliable ICA decomposition while at the same time minimizing the data reduction and manipulation. The output files of the automated portion of the “Lossless” pipeline are stored in *ll.set files. Let’s load the *ll.set file for the first participant and examine the ICA model in relation to the scalp data.
Remove channels that were not included in the ICA model
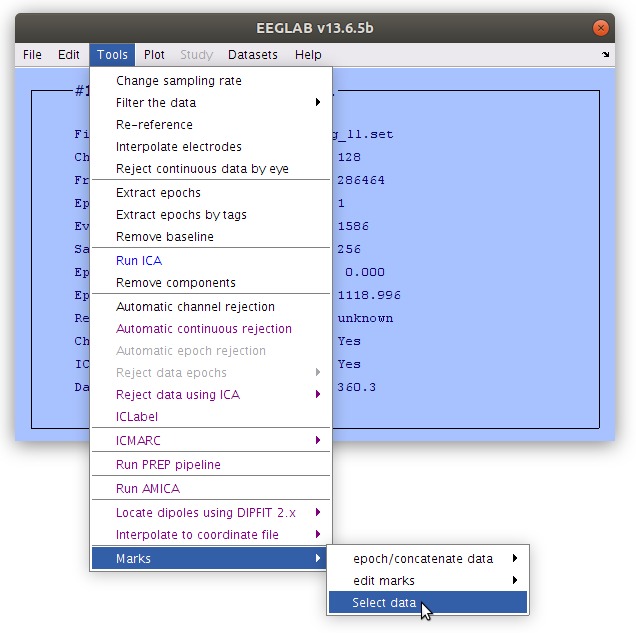
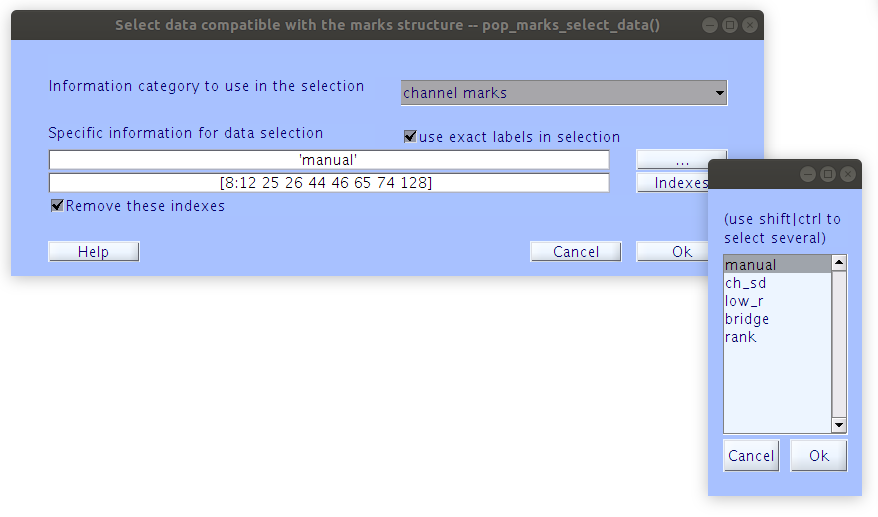
The Lossless pipeline minimizes data loss by storing information about dat channels and time points in annotation that can be visualized along with the data in quality control procedures. For this exersize in removing artifactual components we need to first remove channels that were not included in the ICA decomposition from the data array before applying any interactions between the scalp data and ICA model in the EEG structure. The vised_marks extension for EEGLAB which provides tool for annotating the data also provides tools for selecting data based on the annotations. Let’s use the “Marks” selection tool to purge the channels that have been flagged for rejection.
Examine the scalp scroll plot
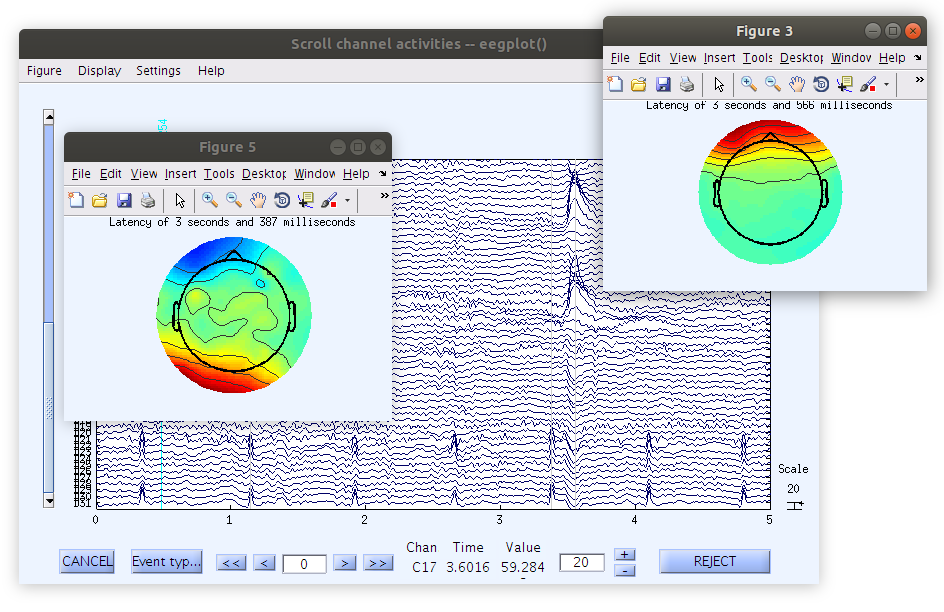
In this case we are interested in examining the properties of different artifacts in the scalp data that would typically be rejected with basic preprocessing procedures, or remain in the data and influencing ERP measures (or other post-processing hypothesis test measures). Right clicking on the scalp scroll plot axis generates a topographical map of the voltages at the specific time point selected. In this example we see a clear eye blink as well as clear heart artifact. It is important to note how each of these artifacts distributes themselves across channels in a systematic way. This fixed distribution of voltages across channels is referred to as spatial stationarity. This is to say that the voltage projection for these artifacts do not move around the scalp.
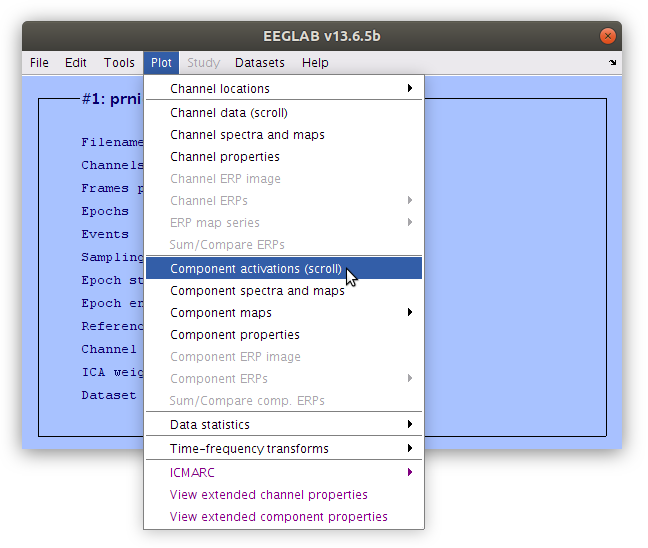
Examine the IC scroll plot
Looking at the IC activation waveforms the relationship across signals is very different than the relationship among scalp channels. Specifically, the pattern of the eye blink and the heart beat are each isolated to one signal and do not spread across signals. Notice as well that each IC does not have a single location (like a scalp recording channel) but rather each IC has a project (a weight pattern over the entire recording surface). Component 1, which has a clear eye blink waveform pattern, has a projection that resembles the topography that was plotted from the scalp signals at the time of a blink. Component 2, which has a clear heart beat waveform pattern has a topographical projection that resembles the topography that was plotted from the scalp signal at the time of a heart beat.
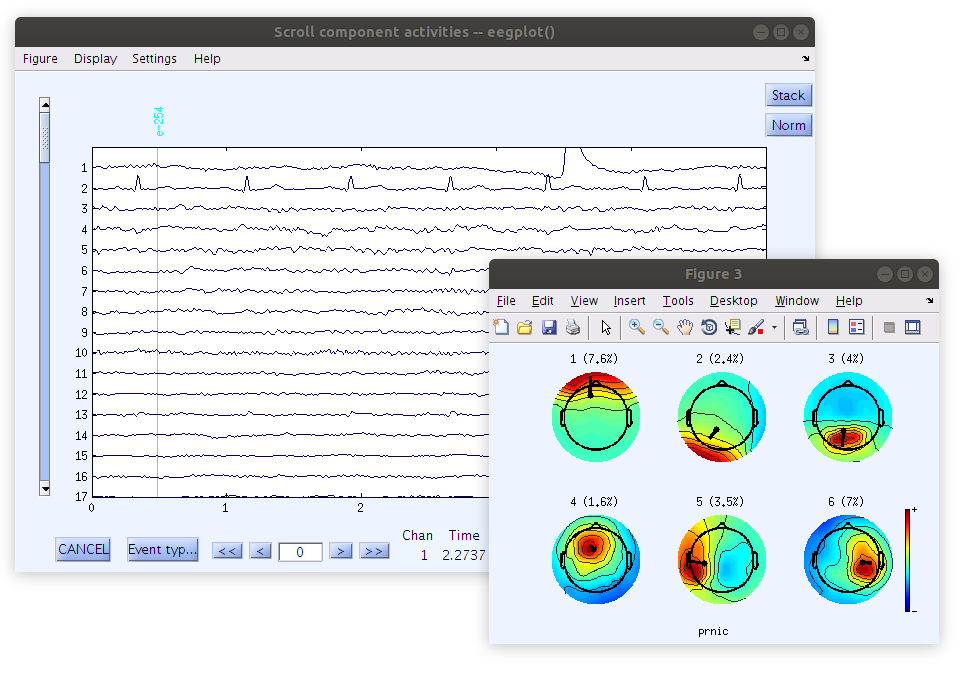
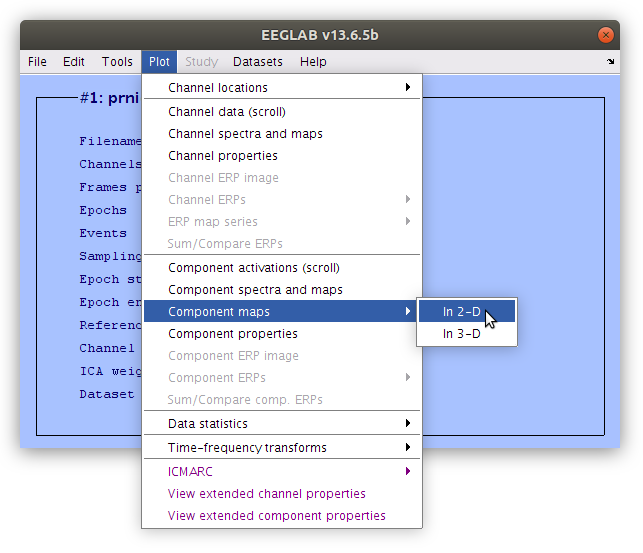
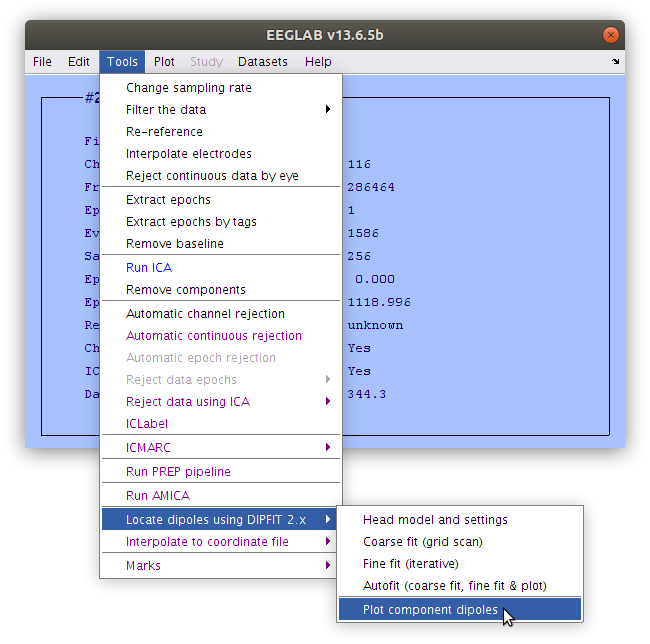
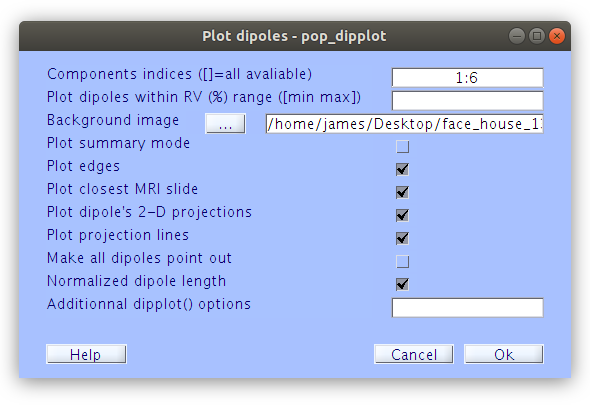
How to generate the ica plots
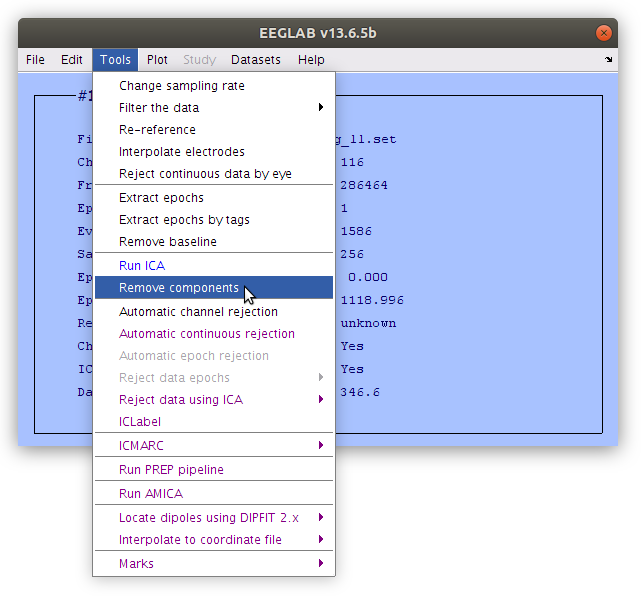
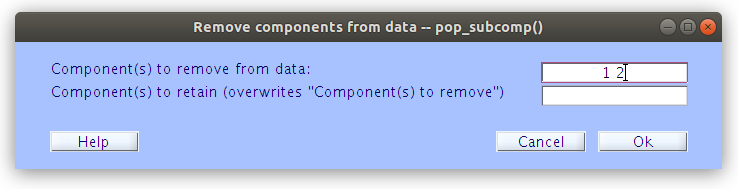
Remove IC from the scalp signals
Once that ICs have been isolated and classified as having captured artifacts, those IC weights can be reduced to zero and then the scalp data can be regenerated without containing the voltage projections from the removed ICs.
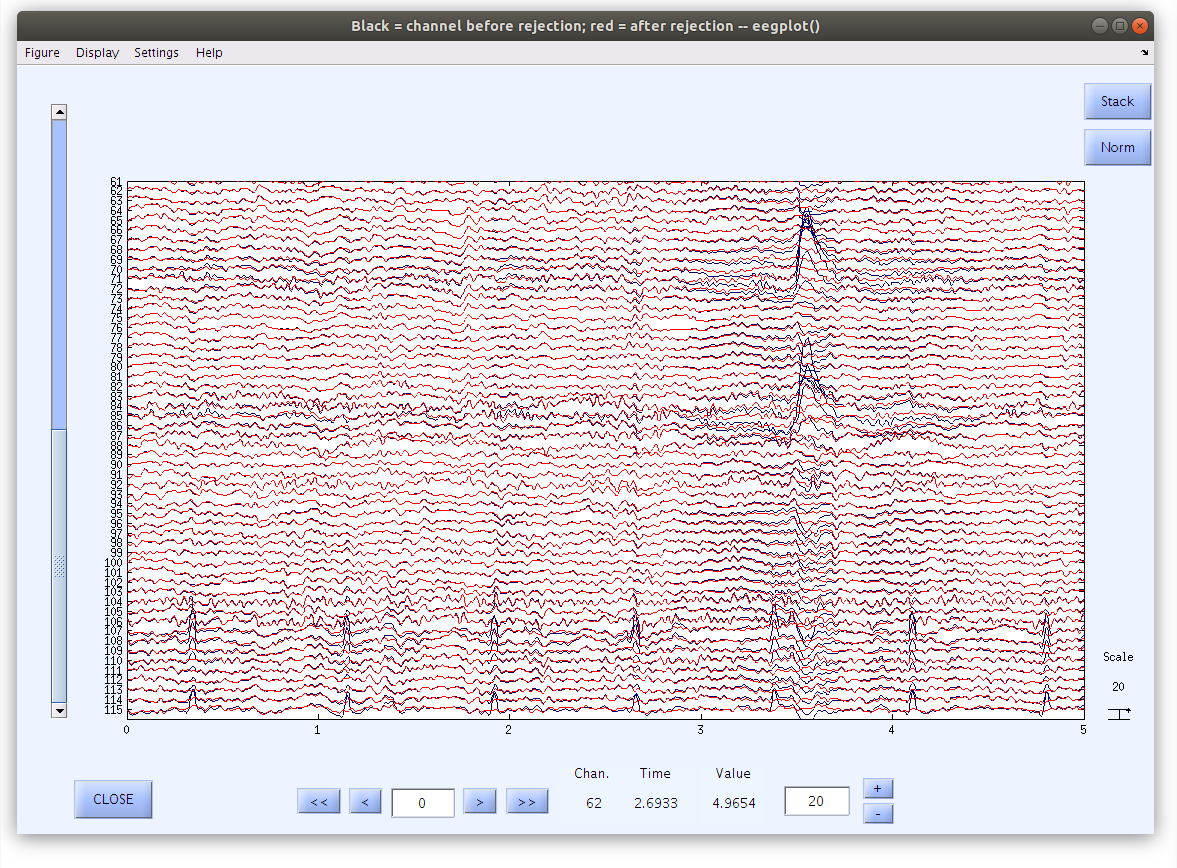
Examine the IC removal at the scalp
In the process of removing components there is an opportunity to plot the scalp data with the reduced IC projection overlayed so that the effects of the artifact correction can be seen clearly. In this case the blue waveforms depict the original data and the red waveforms depict the corrected waveforms. Note that while there are substantial voltage differences at the times and locations of the eye blinks and heart beats, the rest of the data are largely unchanged.

Key Points
Some EEG artifacts in EEG can be isolated with ICA