Summarizing EEG data measures across recordings
Overview
Teaching: 0 min
Exercises: 0 minQuestions
How are group level summaries generated in EEGLAB via the STUDY structure?
Organizing the data for the STUDY structure
Plotting group level ERPs and making comparisons
Objectives
Understand how to summarize and visualize data across EEG sessions
Understand the relationship of single session ‘set’ files in relation the STUDY structure
Understand how to explore the EEG data measures across groups, conditions, etc.
The STUDY structure in EEGLAB allows for the summary of measures across set files
EEGLAB’s STUDY structure contains the information to index processed files in an EEG project
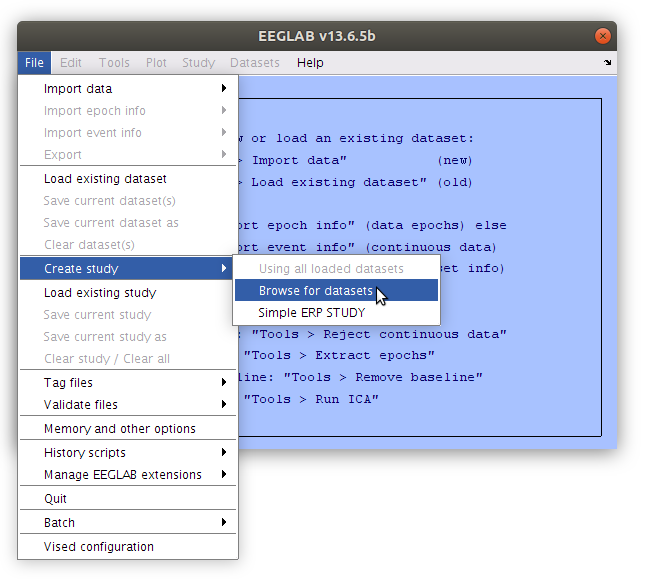
Having worked with single EEG files and then having scripted across files it is now a good time to explore how EEGLAB enables group summaries of set files. The process of building a STUDY structure and then defining designs within it allows users to summarize measures across multiple files or test differences across independent variables.
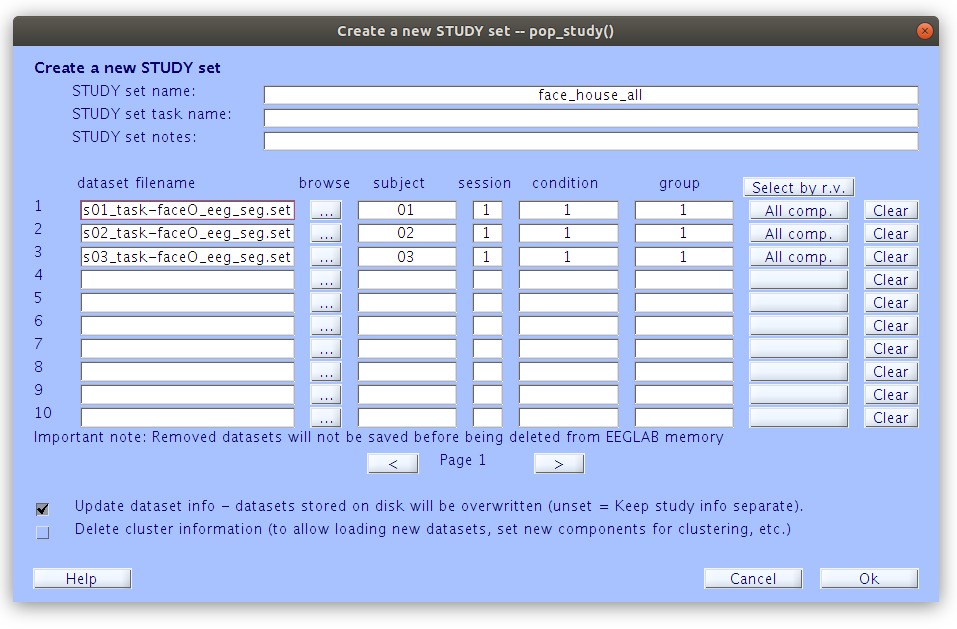
The interface for building a STUDY structure in EEGLAB provides a method for indexing segmented *.set files across subjects and independent variables.
Building a study structure
The STUDY structure in EEGLAB holds indexes for the segmented *.set files according to their participant ID as well as other independent variables. This information can be added manually while adding *.set files from a browsing interface.
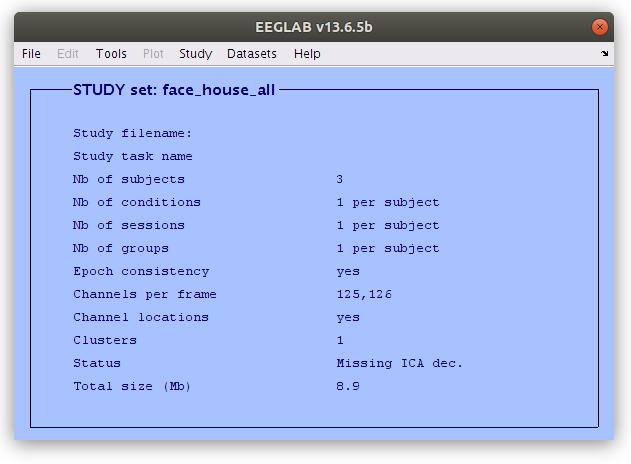
Once a STUDY structure is present in the workspace the EEGLAB panel provides a brief summary of the STUDY structure properties.
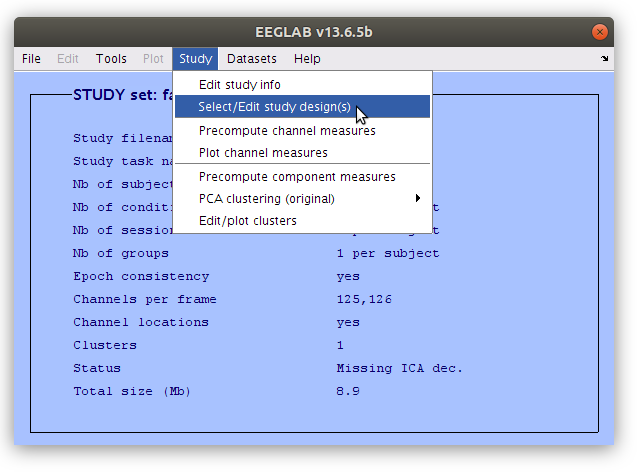
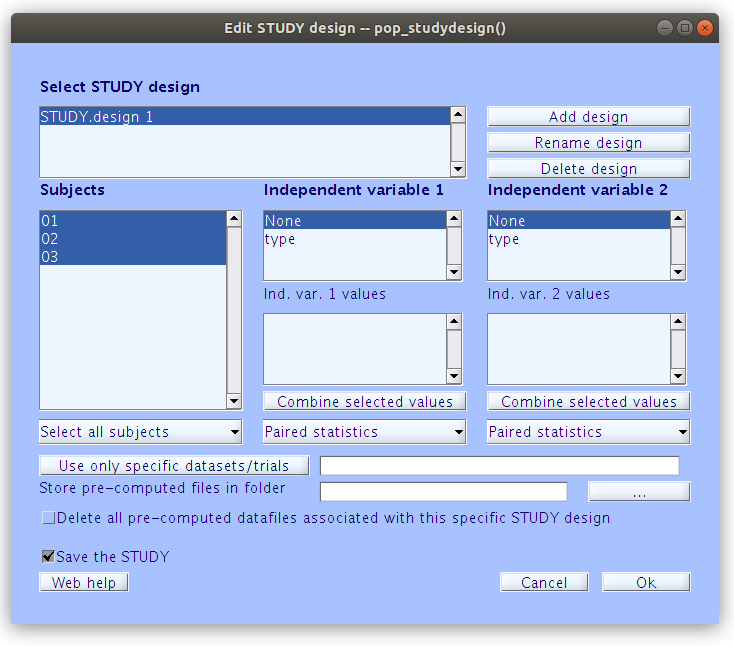
Examine the STUDY Design
Since a STUDY structure can index multiple independent variable it is possible to create several “Designs” that control how the indexed *.set files relate to each other in subsequent summary procedures.
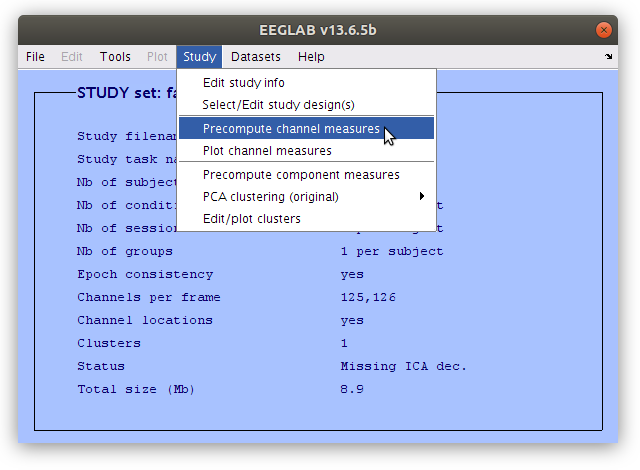
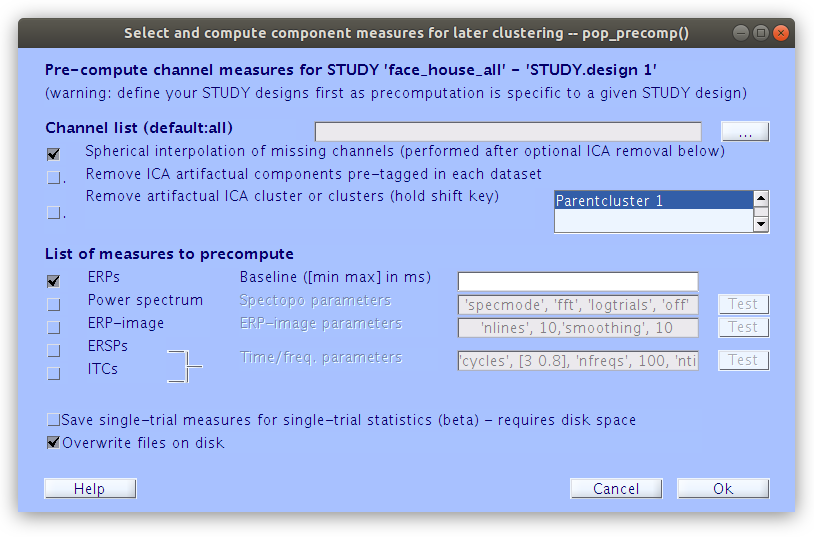
Pre-compute channel measures
Once that the STUDY is created and the design reflects the intended analysis, channel measures can be calculated from the indexed segmented *.set files.
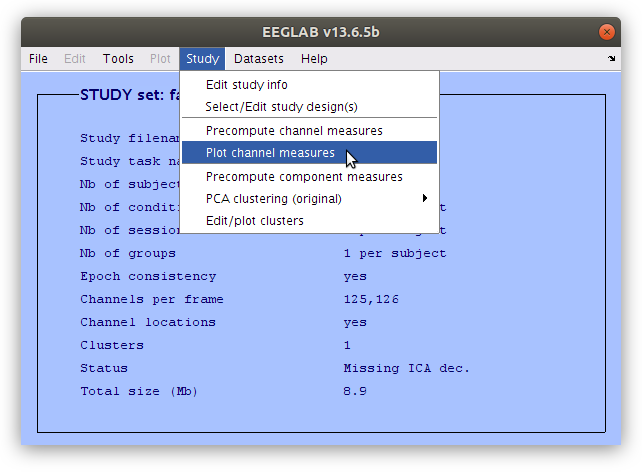
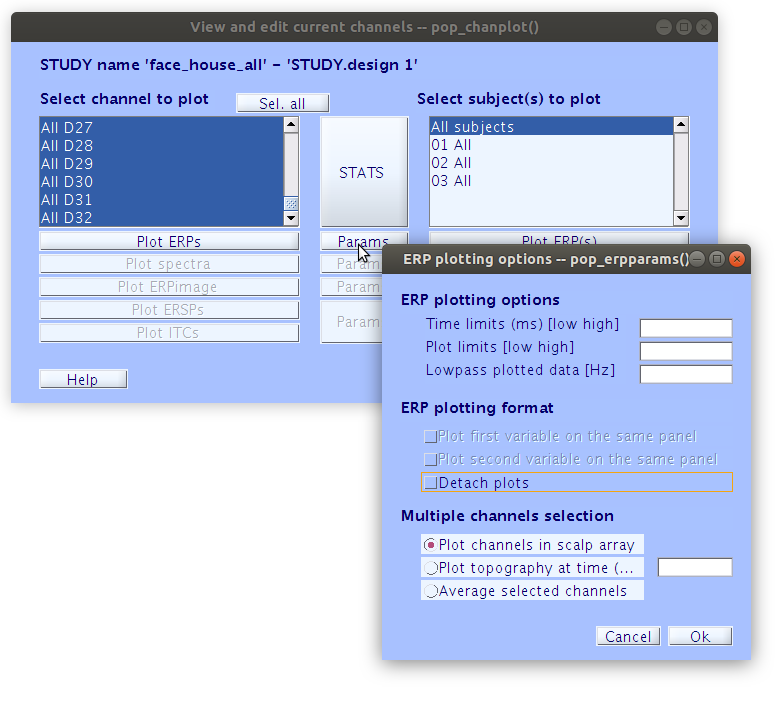
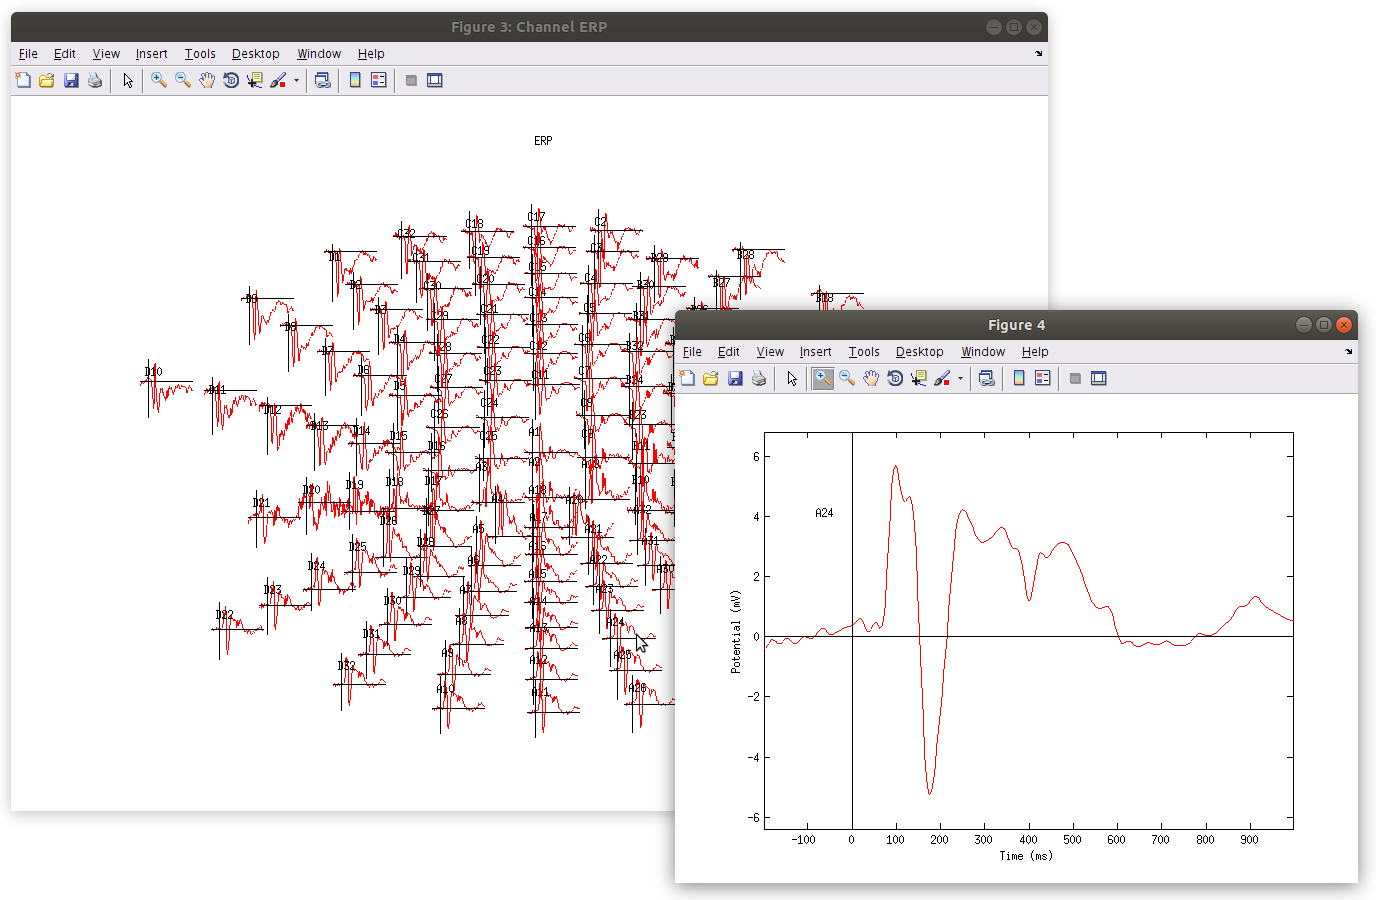
Plot channel measures
Having pre-computed channel measures, summary figures can be generated.
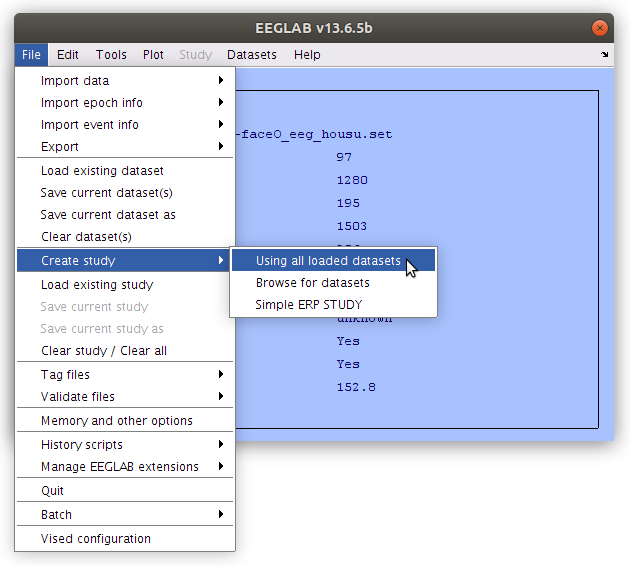
Created STUDY structure automatically from files loaded in EEGLAB
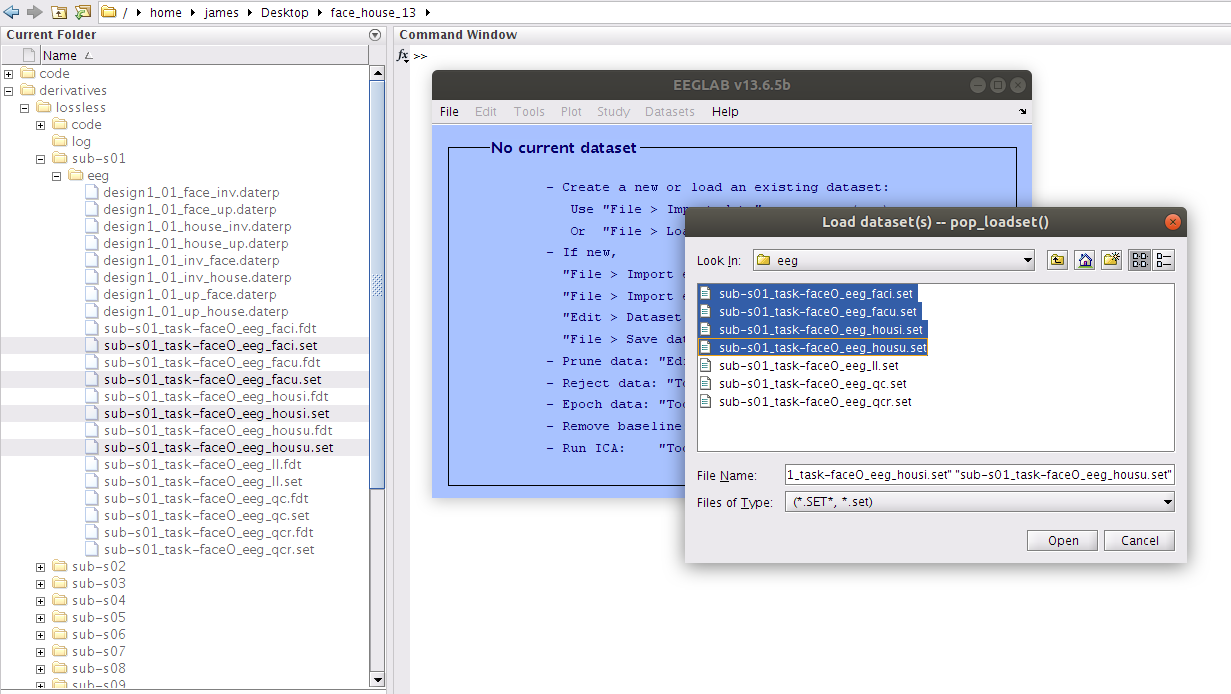
When segmented *.set files are indexed into a STUDY structure information is added into their EEG structure. Specifically, fields for “subject”, “group”, “condition” and “session” are populated. If these fields are populated during the segmentation of the data (or at some other point in script) then the STUDY structure can be created automatically from *.set files that are loaded into the workspace. We can accomplish this by loading data files that had their STUDY variable fields populated during their segmentation script execution.
The ‘subject’, ‘group’, ‘condition’ and ‘session” fields of the EEG structure allow the STUDY import procedure to automatically populate the indexing of the independent variables in the STUDY design.
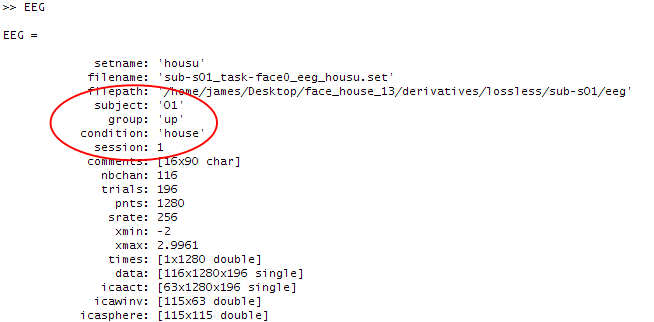
Not really ‘group’, ‘condition’ and ‘session’
Although the fields of the EEG structure for automating the STUDY design population are named ‘group’, ‘condition’ and ‘session’ the independent variables that they refer to in practice could be anything (e.g. ‘group’ = ‘up’ in this case which is actually a property of the stimulus “upright”). It is best to think of these ‘group’, ‘condition’ and ‘session’ fields as “independent variable 1”, “independent variable 2” and “independent variable 3”.
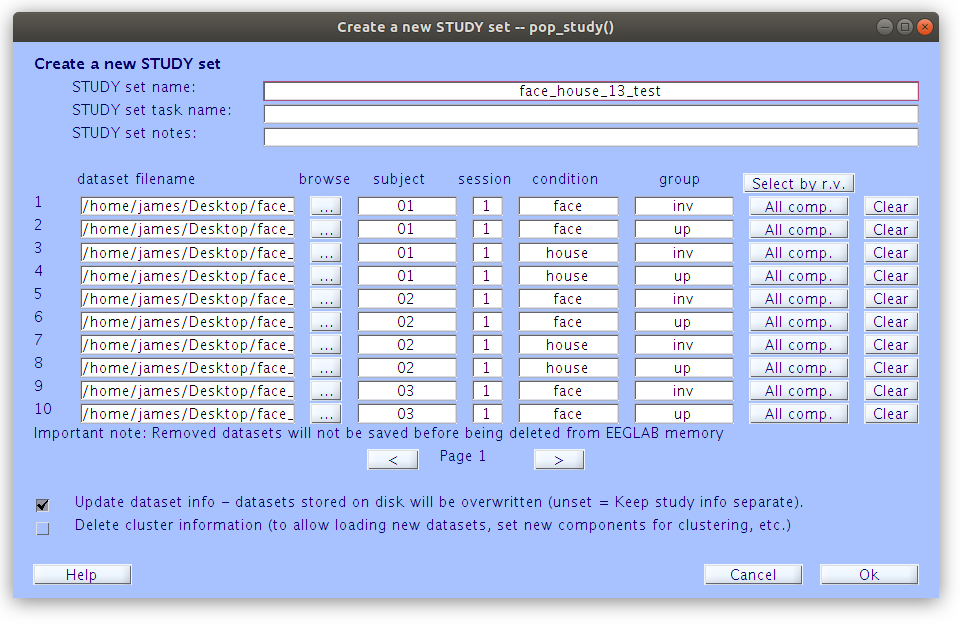
Now, load the multiple files for sub-s02 and sub-s03 as well. Then create a STUDY with the loaded set files.
This results in the pre-populated independent variable fields.
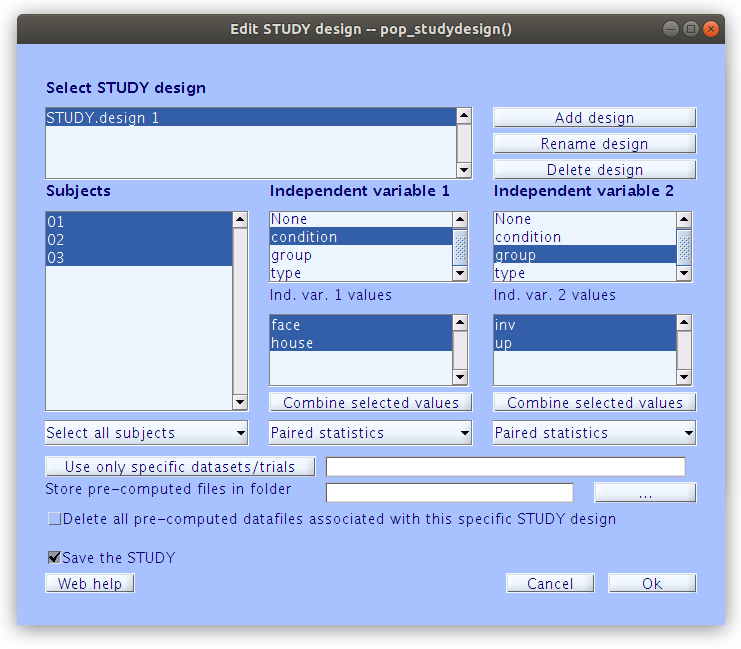
Examine the multi-variable STUDY Design
With this new STUDY design we have multiple independent variables, one for ‘condition’ (face vs. house) and another for ‘group’ (inverted vs. upright).`With the STUDY Design editor we can manipulate the way that summaries are build and comparisons are made across indexed variables.
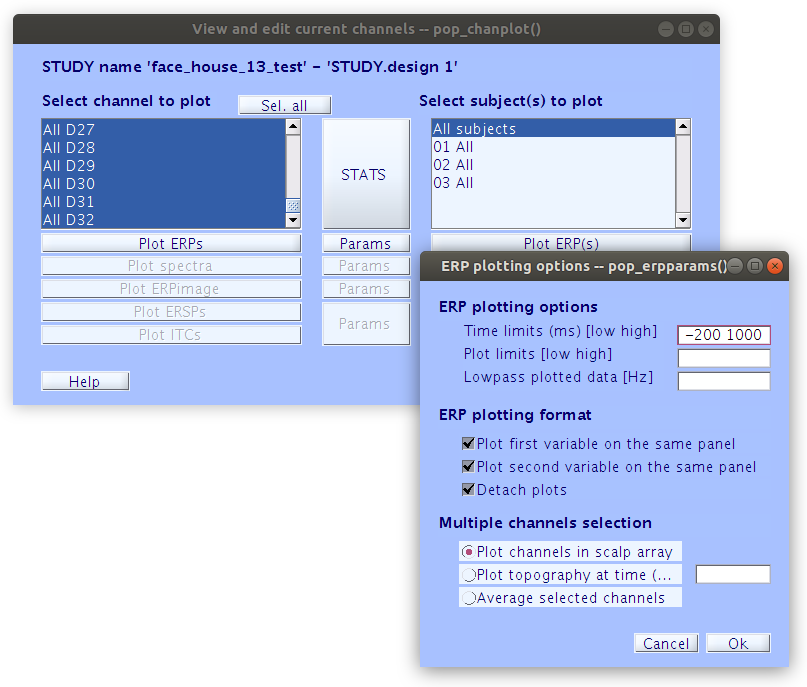
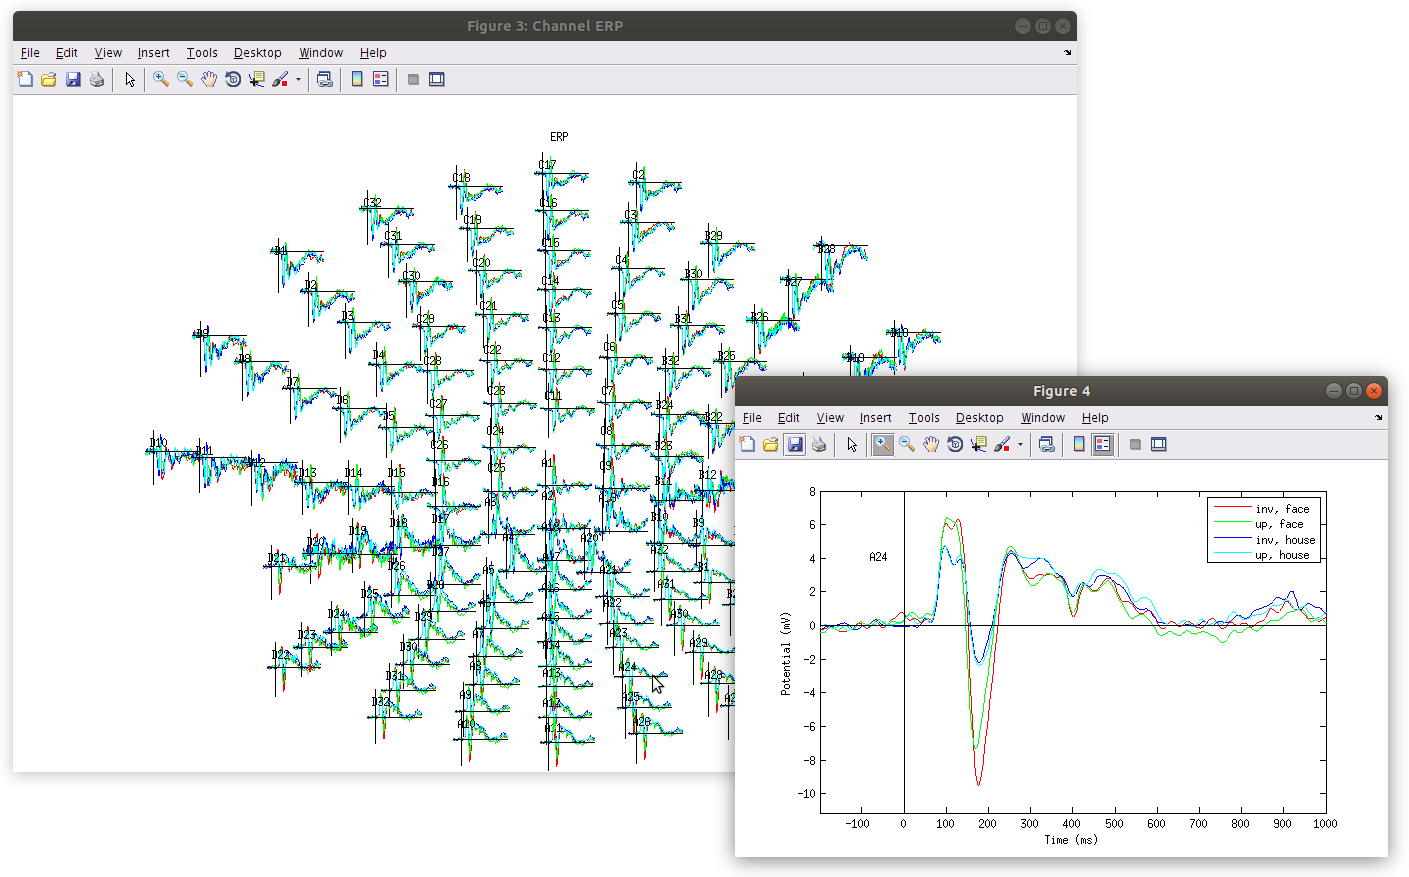
Build summary figures that overlay conditions
Having established the STUDY Design figures can be generated that present and compare the indexed segmented *.set files in various ways. There are also options for running statistics within this interface.
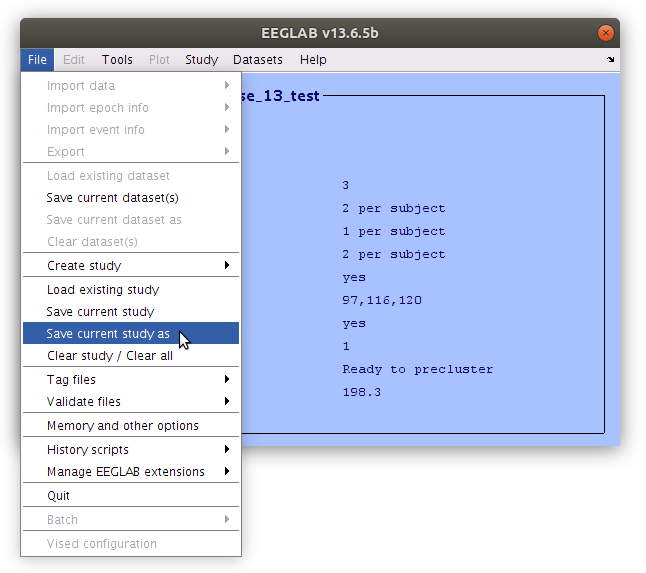
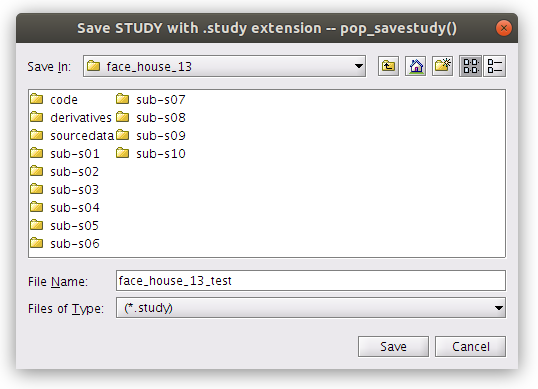
Save the STUDY file
The STUDY structures established can be save to file. The *.study files contain the indexing of all the *.set files to their independent variables as well as all the Design in the workspace at the time of the save.
This is a good time to explore the STUDY and Design plotting capabilities
Some favorites:
- Topographical comparisons
- Exploratory statistical summaries
- Single subject overlays
- etc…
Key Points
Making summaries and comparisons of processed EEG measures