The EEG structure elements
Overview
Teaching: 0 min
Exercises: 0 minQuestions
Where are the EEG properties stored in EEGLAB’s EEG structure?
How to work with the data array, events, channel coordinates, and ICA related fields
Objectives
Learn to interact with all the aspects of an EEG data file in EEGLAB
Establish a global view of the information layout in EEGLAB
How does EEGLAB organize all of the information from an EEG recording file?
EEGLAB’s EEG structure contains the information required to work with the EEG data
Now that we have EEGLAB running inside of Matlab let’s take a look under the hood to see how EEGLAB organizes the information that is contained in an EEG recording file. In order to do this we will need to load an EEG recording from the GUI. To do this, navigate to File > Import > Using EEGLAB functions and plugins > From BIDS Subject folder
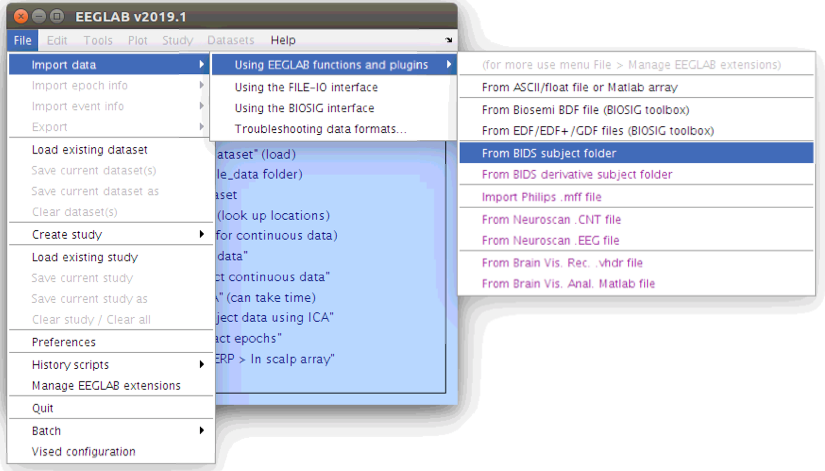
… Then select the *.edf file in the sub-s01/eeg folder.
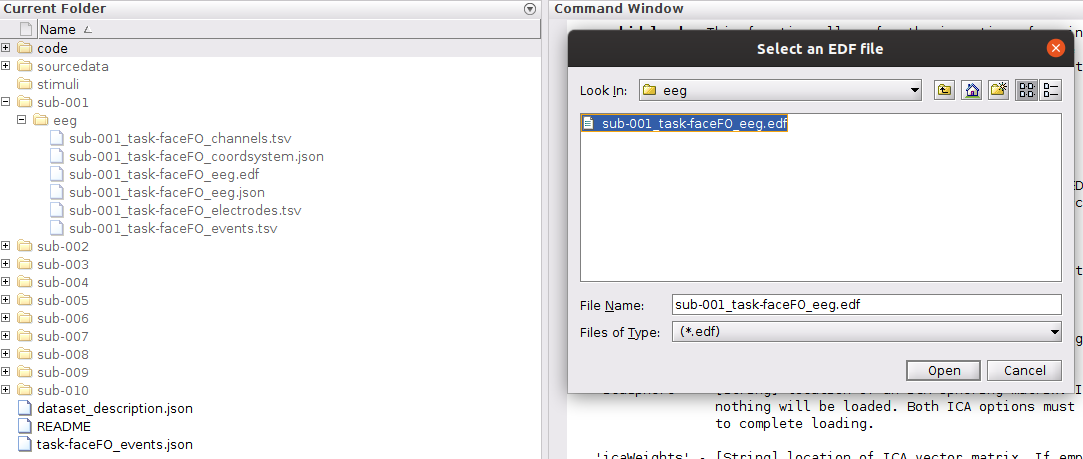
Exploring properties of the EEG data file
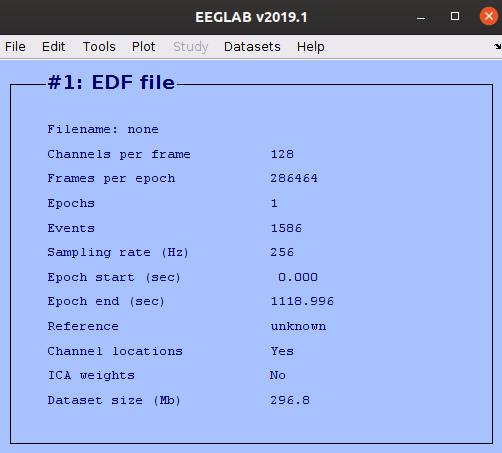
Once a file is loaded into EEGLAB the main GUI figure provides some basic properties of the file such as the number of channels and sampling rate. The goal of this lesson is to be able to interact with all of the EEG properties from within the Command Window.
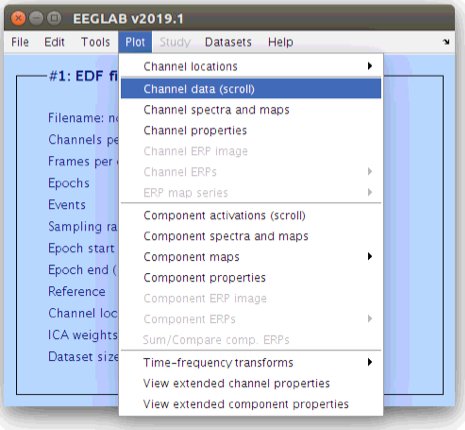
Beyond the basic EEG file property preview on the main EEGLAB window, there are also several tools available for plotting properties of the data via the “Plot” menu. Scrolling the scalp data can be accomplished as follows:
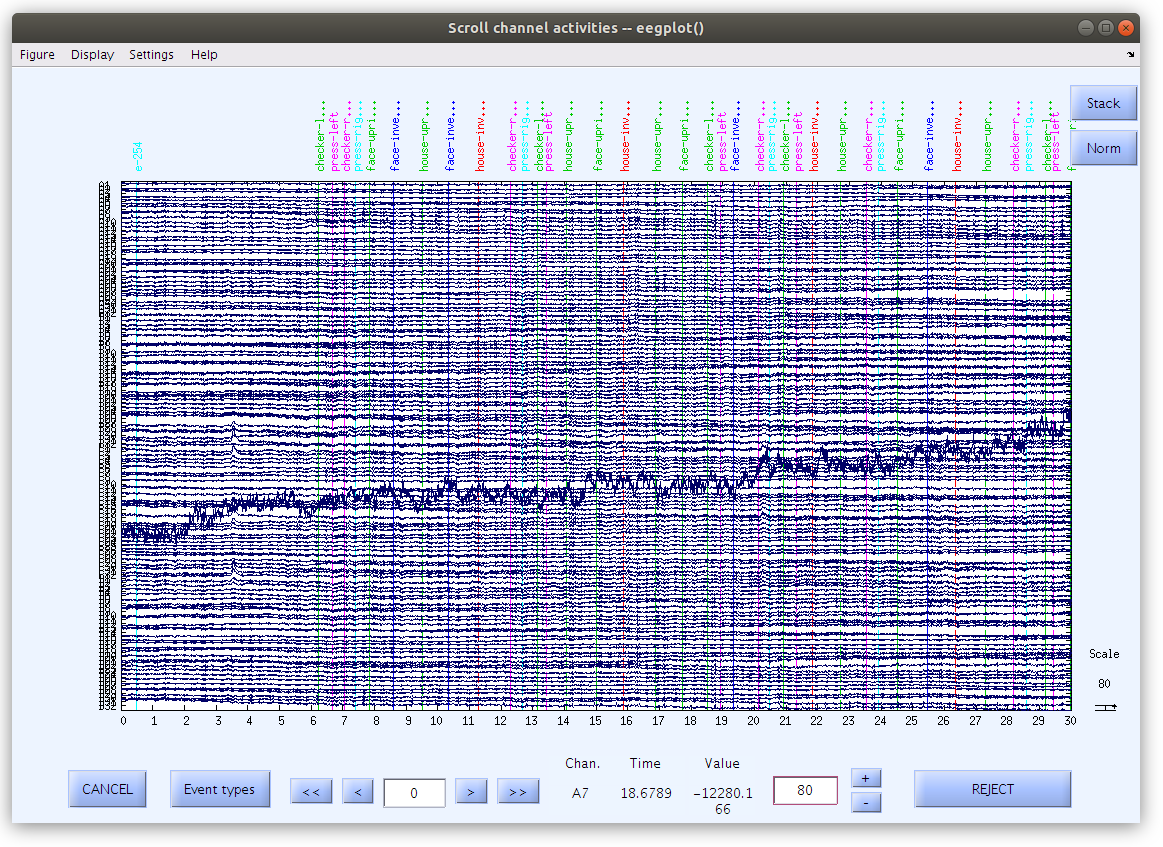
Notice that there are some changes to the figure settings:
These raw recordings have large voltage offsets and appear all over the figure axis (and outside of the figure axis) so we should modify a couple of the figure settings.
- Remove the DC offset (Navigate to Display and select Remove DC offset)
- Decrease the voltage range (Enter 80 into the voltage box at the lower right hand side of the scroll plot)
- Increase the time length (Navigate to Settings>Time range to display and enter 30)
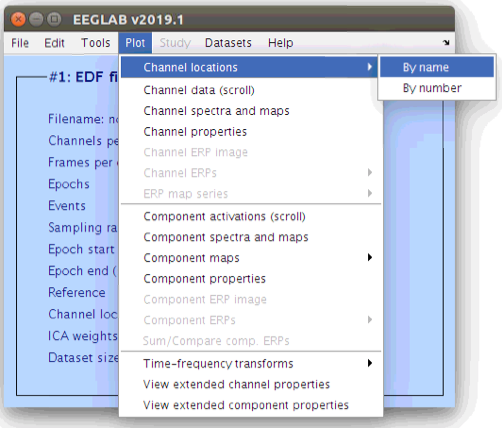
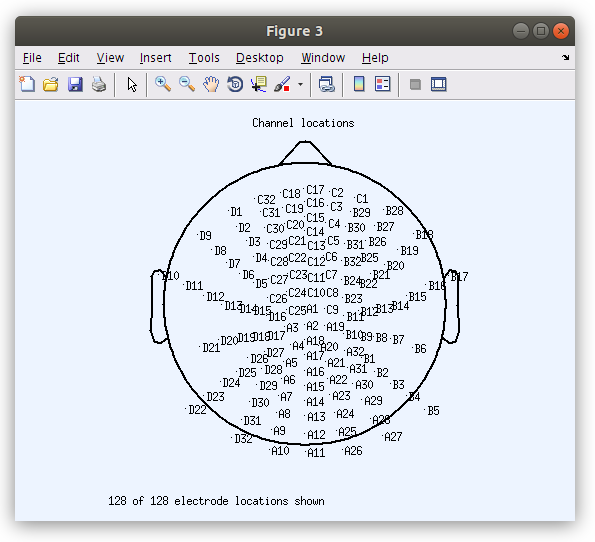
The channel locations can also be viewed in their topographical layout. In the GUI, navigate to Plot > Channel locations > By name
Editing EEG file properties from the GUI
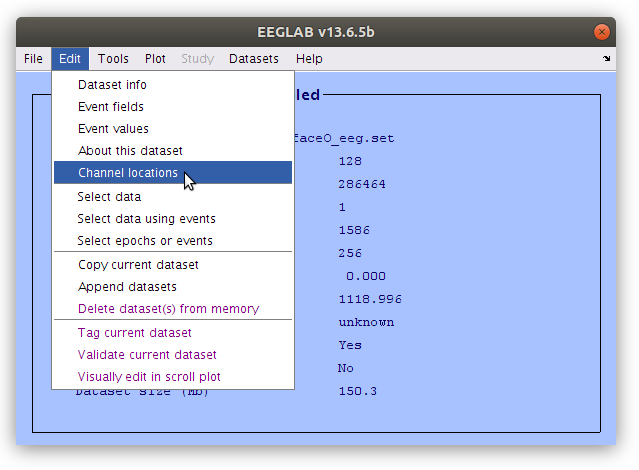
Working from the command line any property of the EEG file (e.g. data voltage, event label or time, channel location, etc) can be modified. The GUI also provides tools for modifying some of the data properties, such as the channel location via the “Edit” menu. To open the “Edit channel info” window, navigate to Edit > Channel locations. Within the “Edit channel info” popup window, select Plot 3-D (xyz).
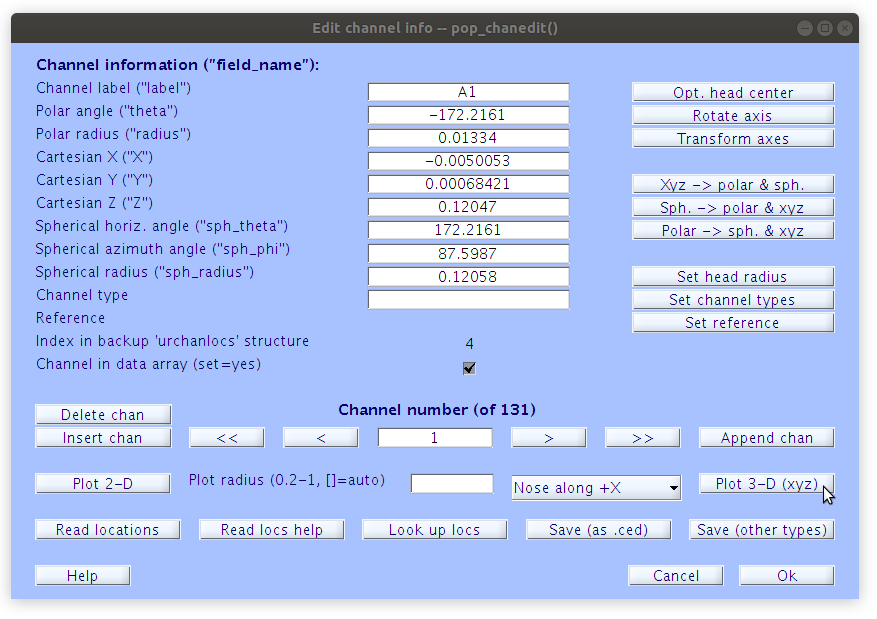
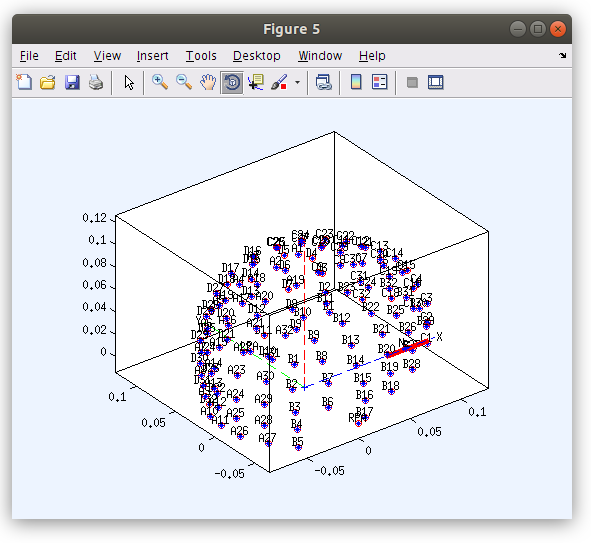
Exploring the EEG properties from the Command Line
Although many of the EEG data properties are available for viewing and editing from the GUI, everything is also available within the EEG structure in the Workspace and can be explored in the Command Window.
Let’s list all of the fields in the EEG structure:
EEG
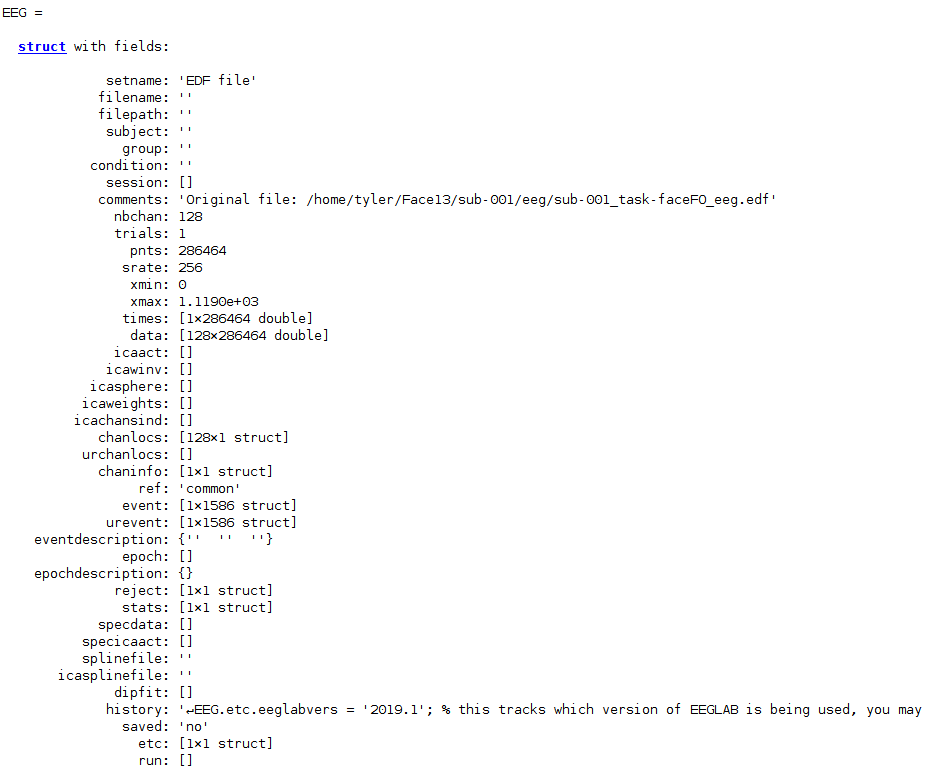
Now specific fields of a structure can be accessed using the “.” notation, and structure fields can also be indexed like numeric arrays. For example, we can retrieve the properties of the first channel as follows:
EEG.chanlocs(1)
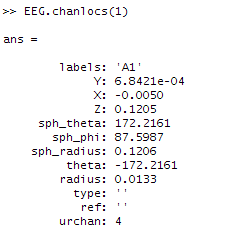
Linking the EEG structure fields to the BIDS file structure
Now that we can explore how EEGLAB stores the various data parameters in the ‘EEG’ structure we can explore how these structure fields relate to the BIDS standard file structure.
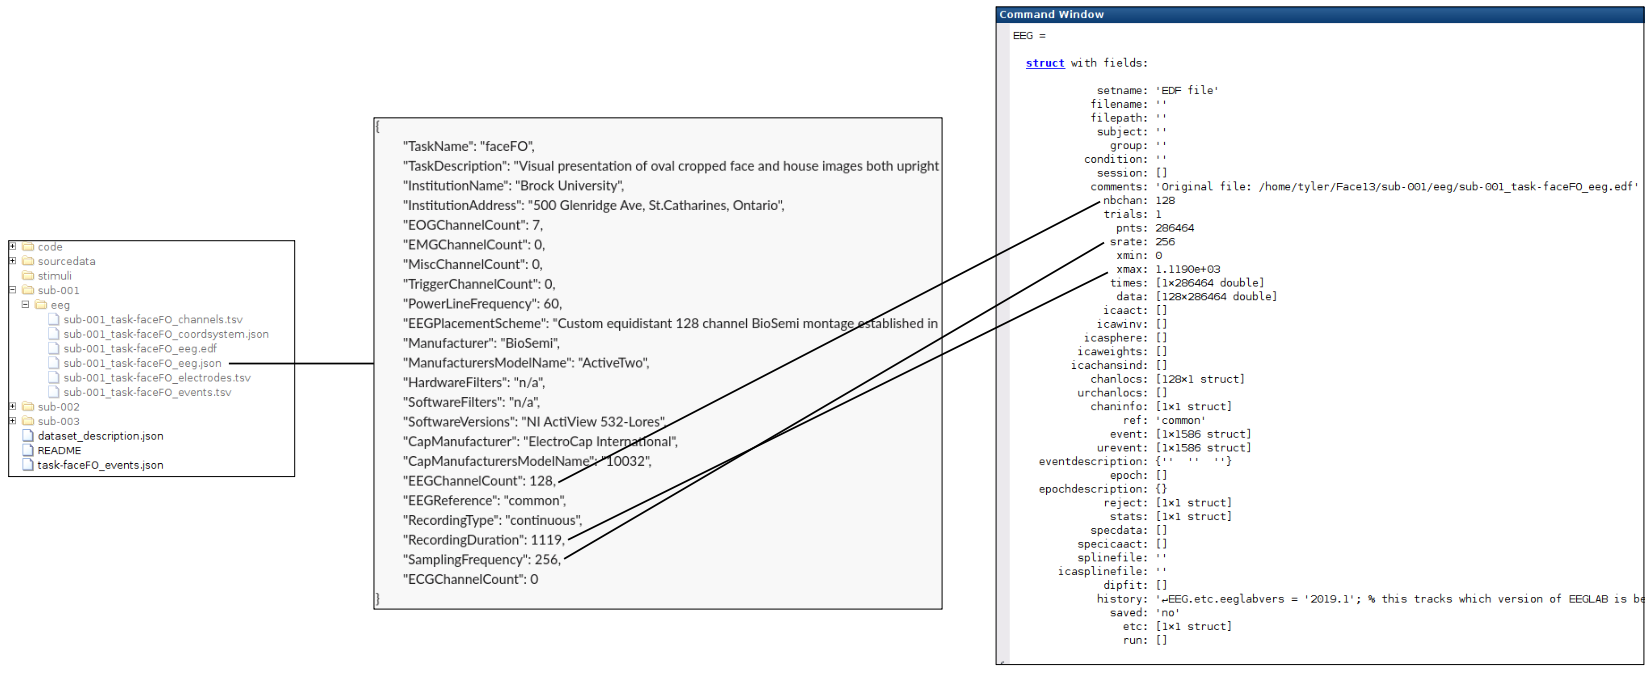
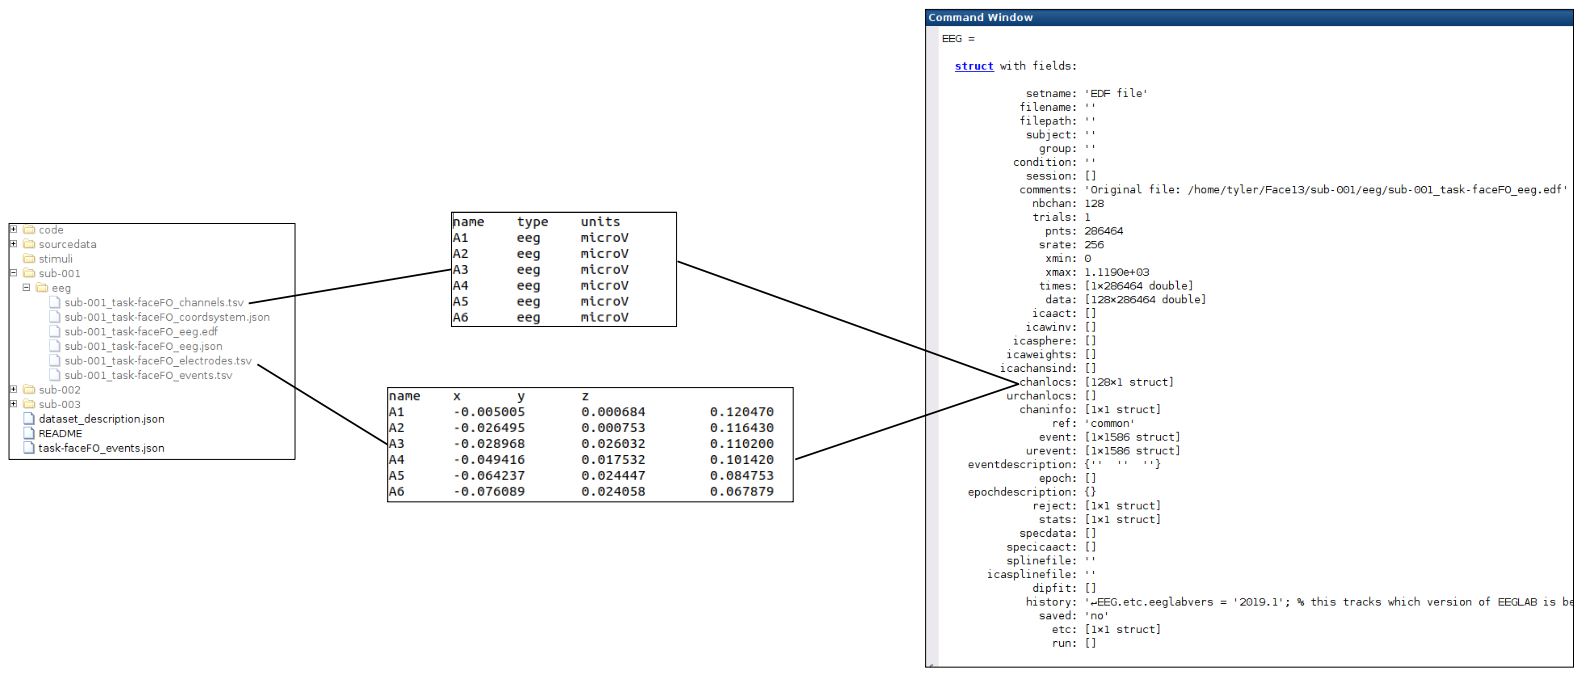
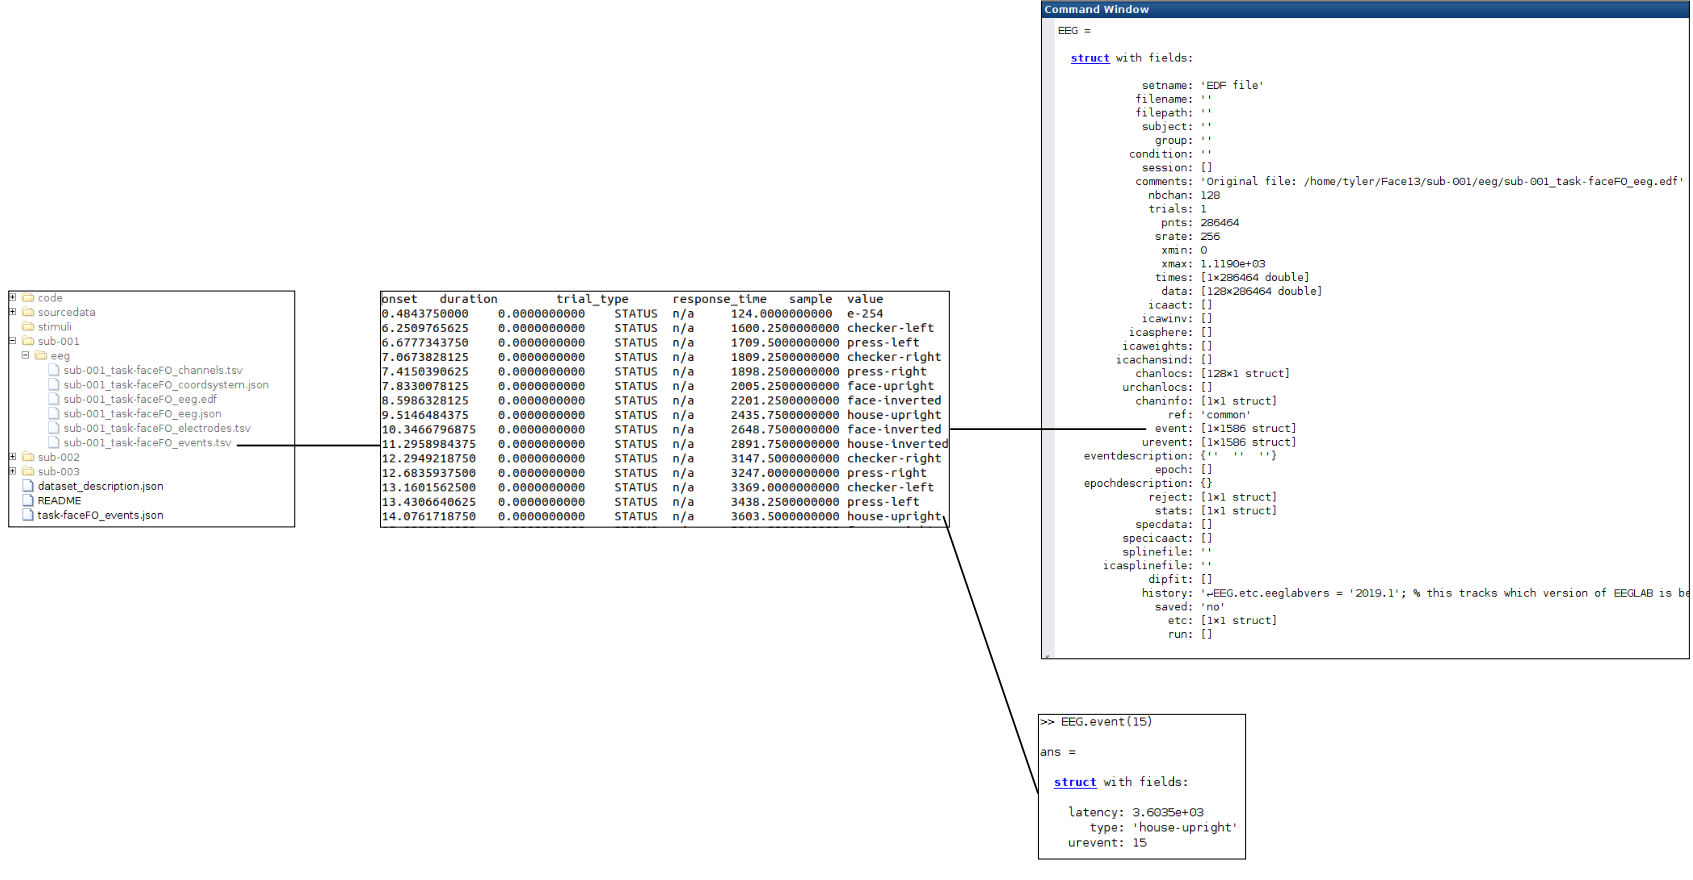
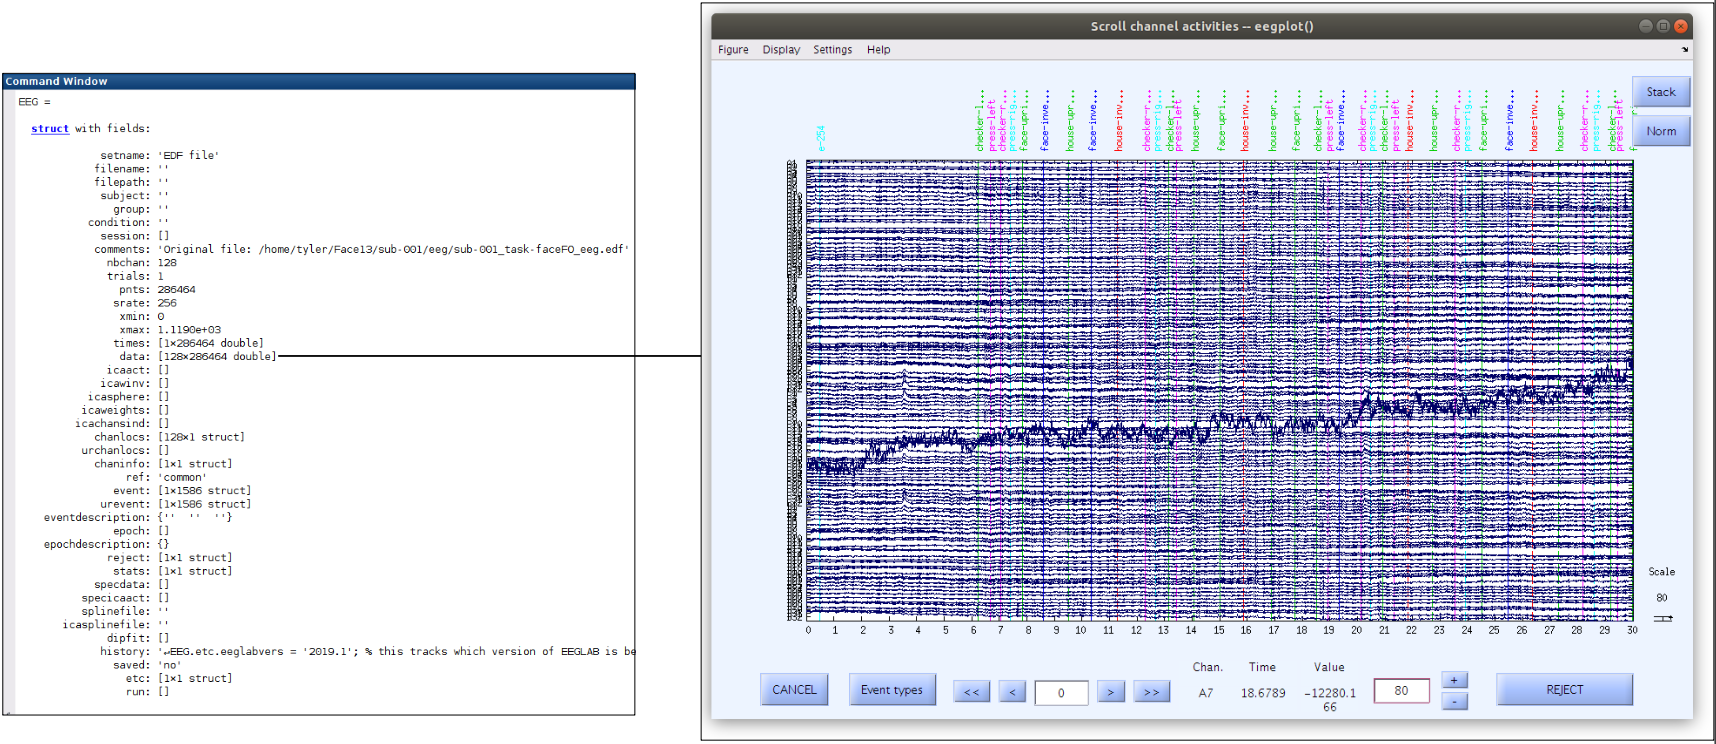
For fun: try editing the latency of an event
Set latency of the 10th event to 100, and then replot the scalp scroll plot
Hint
The event information is in “EEG.event”
Solution
To change the latency of the 10th event to 100 type:
EEG.event(10).latency = 100;Once the event latency has been edited, the scalp scroll plot can be plotted using the EEGLAB GUI via the “Plot” menu by selecting “Channel data (scroll)”. You will have to change some of the figure settings again (remove DC offset, decrease the voltage range to 80, and increase the time length). In the scroll plot you should see the 10th event (house-inverted) at 0.4 seconds. Note that the latency stored in the EEG.event.latency is measured in samples. Since our sampling rate (EEG.srate) is 256, changing the latency of event 10 to 100 placed this event at about 0.4 seconds (100/256=0.4).
Key Points
Where is all of the EEG recording information stored in the EEGLAB file structure?