Basic ERP processing
Overview
Teaching: 0 min
Exercises: 0 minQuestions
How is data loaded into EEGLAB’s EEG structure
How can data be viewed from EEGLAB
How can Event Related Potentials be generated in EEGLAB
Objectives
Understand how to view and process data in EEGLAB
Generate ERPs from an EEG recording using a basic procedure
Import or Load an edf file into EEGLAB
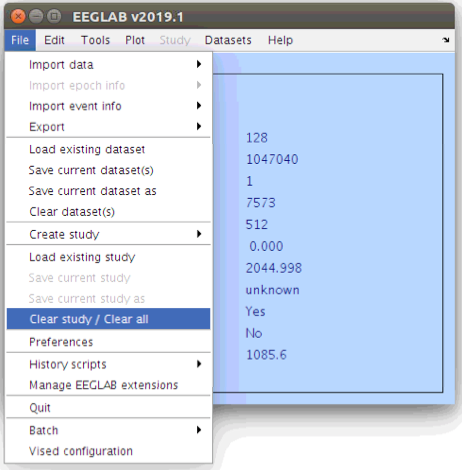
Let’s start with a new edf file. To clear existing EEG structures from workspace navigate to File > Clear study / Clear all:
Now open a new file (perhaps participant 02 by navigating to File > Import data > Using EEGLAB functions and plugins > From BIDS subject folder and selecting the .edf file in sub-002/eeg/) and let’s process this one file though until we have an Event Related Potential (ERP).
Re-reference to the average channel
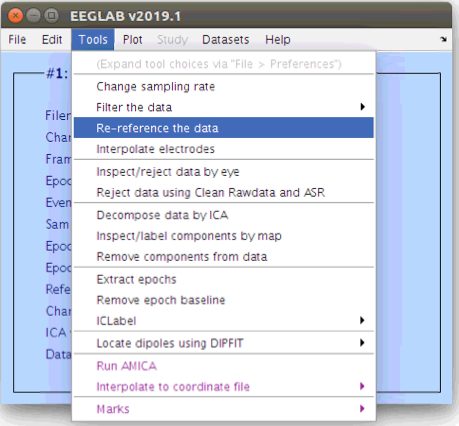
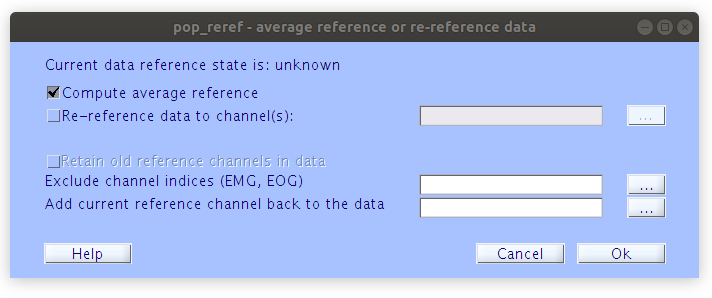
There are many ways to re-reference EEG data and for this basic analysis we will use the default average site reference. Further, we will re-reference the data again later any time that we remove bad channels. Re-referencing the data in EEGLAB can be accomplished by the following procedure via the “Tools” menu.
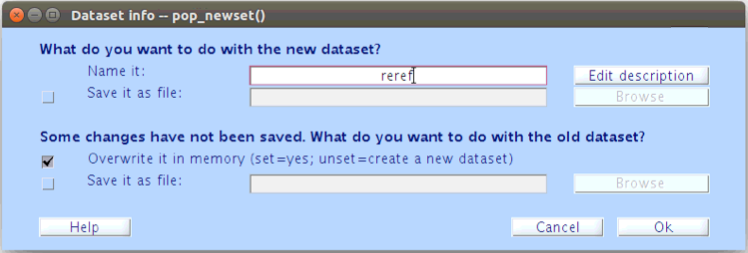
After each processing step, we will be asked to name our new dataset and either overwrite or save the old dataset. During this episode we will be overwriting the old dataset in memory after each step and then saving a final segmented file at the end.
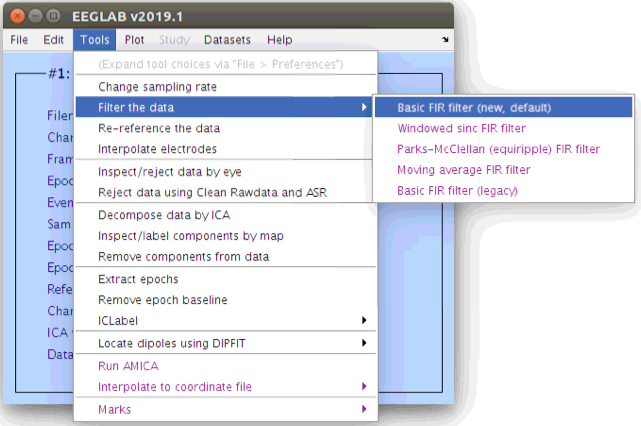
Filter the data
After re-referencing we can also filter the data with the frequently used 1Hz high-pass and 30Hz low-pass filters. Don’t hesitate to regenerate the scalp scroll plots while you are performing these to monitor the differences.
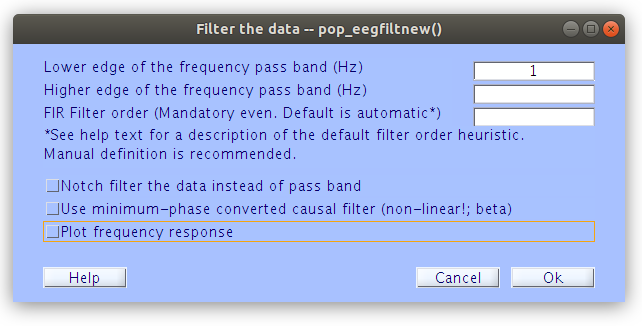
Parameters for the 1Hz high pass
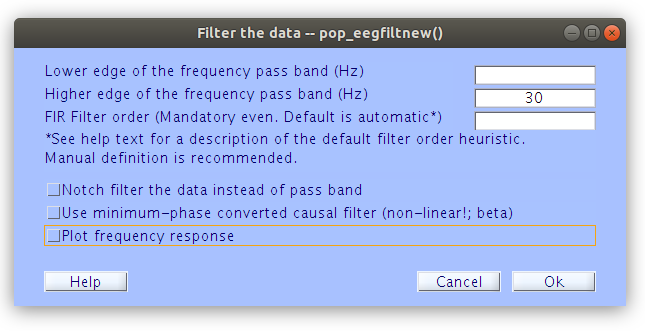
Repeat for the 30Hz low pass
Remove bad channels
Now that some of the basic signal processing is done to restrict the data to signal properties that we are interested in we can look for channels and periods of time that contain noise properties. These typically include large voltage fluxuations that would have relatively large impact on the ERPs while unlikely containing “meaningful” signal. First of all let’s find and remove any bad channels based on spectrum properties.
In the Command Window type:
pop_rejchan(EEG);
Fill in the pop-up window with the following settings:
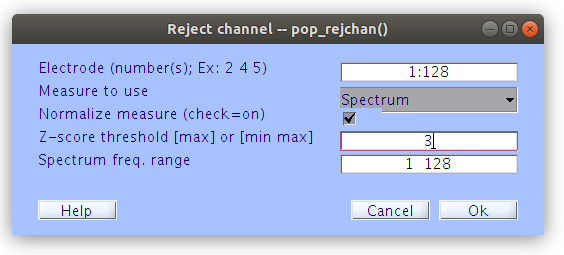
Press Reject after you have reviewed the channels that have been flagged as artifcatual.
Re-reference to the average channel
After removing the channels that were identified with the spectrum criteria we re-reference that data again to the new average site (that does not include the rejected channels). This is important as channels that have large artifacts can end up having a big influence on all of the other channels in the montage if left in the reference. Re-referencing the data can be done in the GUI by selecting Tools > Re-reference the data.
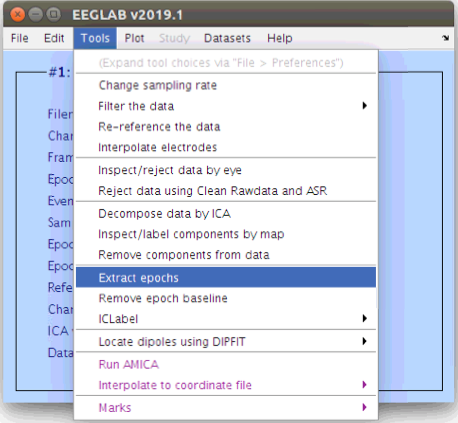
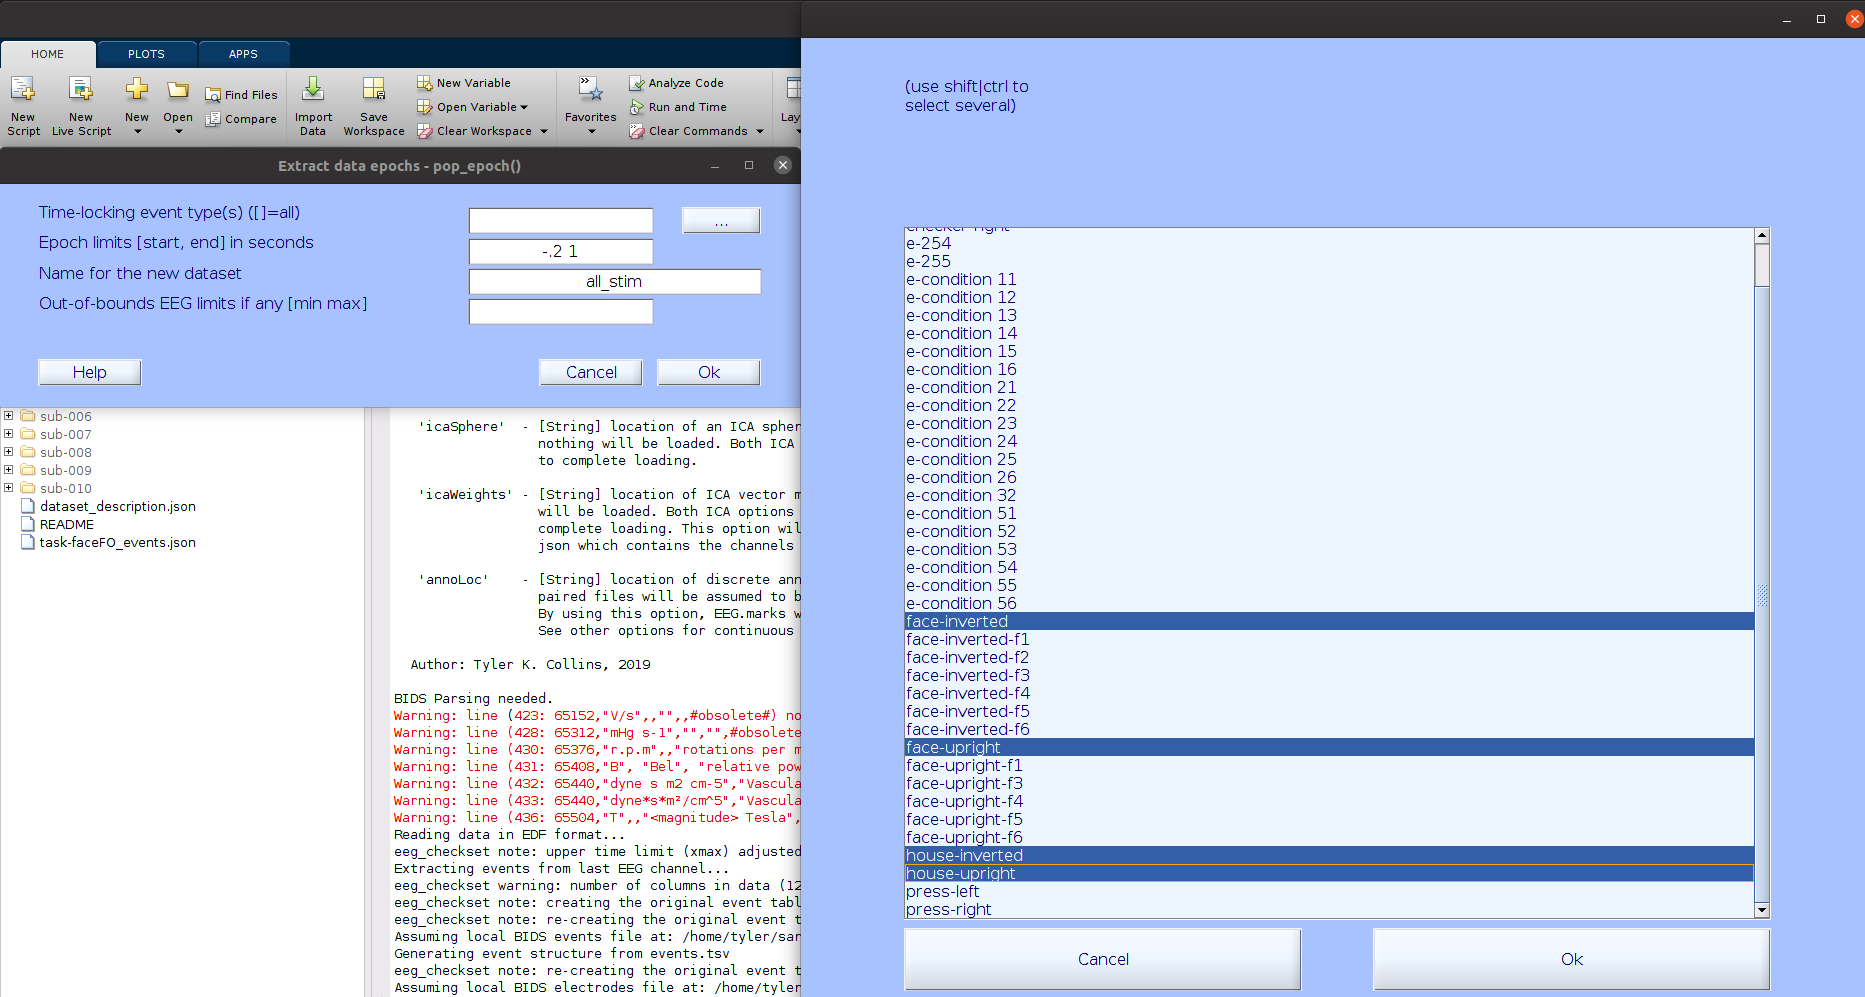
Segment the data relative to face stimulus events
Artifact detection was performed on each channel, now we want to perform an artifact detection for time periods. In order to use the native time artifact detection procedures in EEGLAB we need to segment the data into distinct time windows, or “epochs”. Let’s reduce the data down to time periods that surround events of interest. Since we are interested in examining the ERP differences to upright and inverted face and house stimuli we can select epochs surrounding all face and house stimulus events (from 200 ms pre-stimulus to 1000 ms post-stimulus).
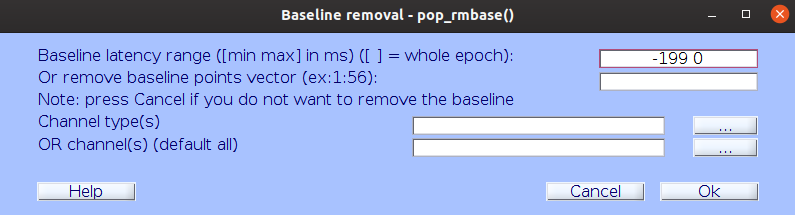
… EEGLAB will automatically ask you about removing the baseline period and guess to use the entire pre-stimulus period.
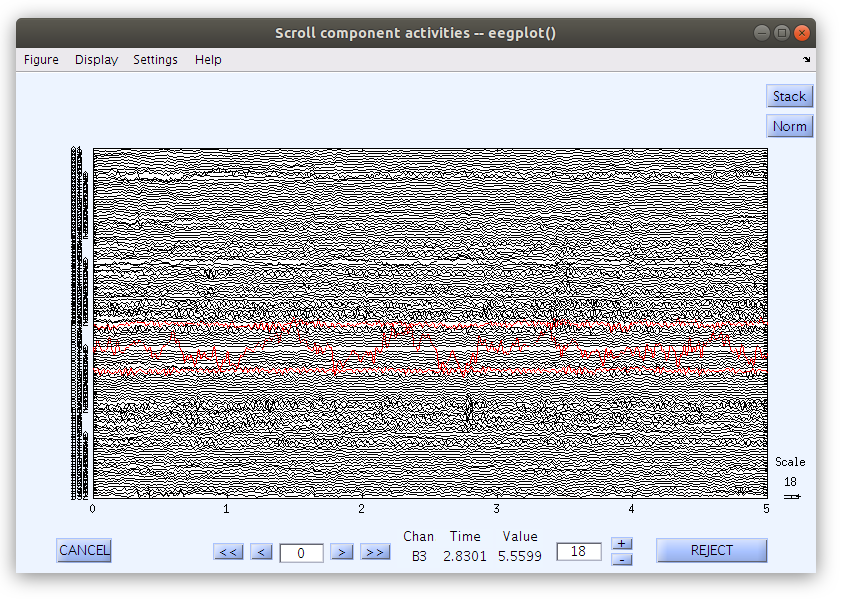
Remove bad time segments (epochs)
There are several methods for identifying bad time periods. For this basic exercise we will use a traditional abnormal value criteria in which we flag any epoch that contains absolute voltages greater than 100 microvolts in any channel and at any time during the segment.
In the Command Window type:
pop_rejmenu(EEG, 1)
Under Find abnormal values, edit the Upper limit to 100 and the Lower limit to -100 as shown below and click Calc / Plot.
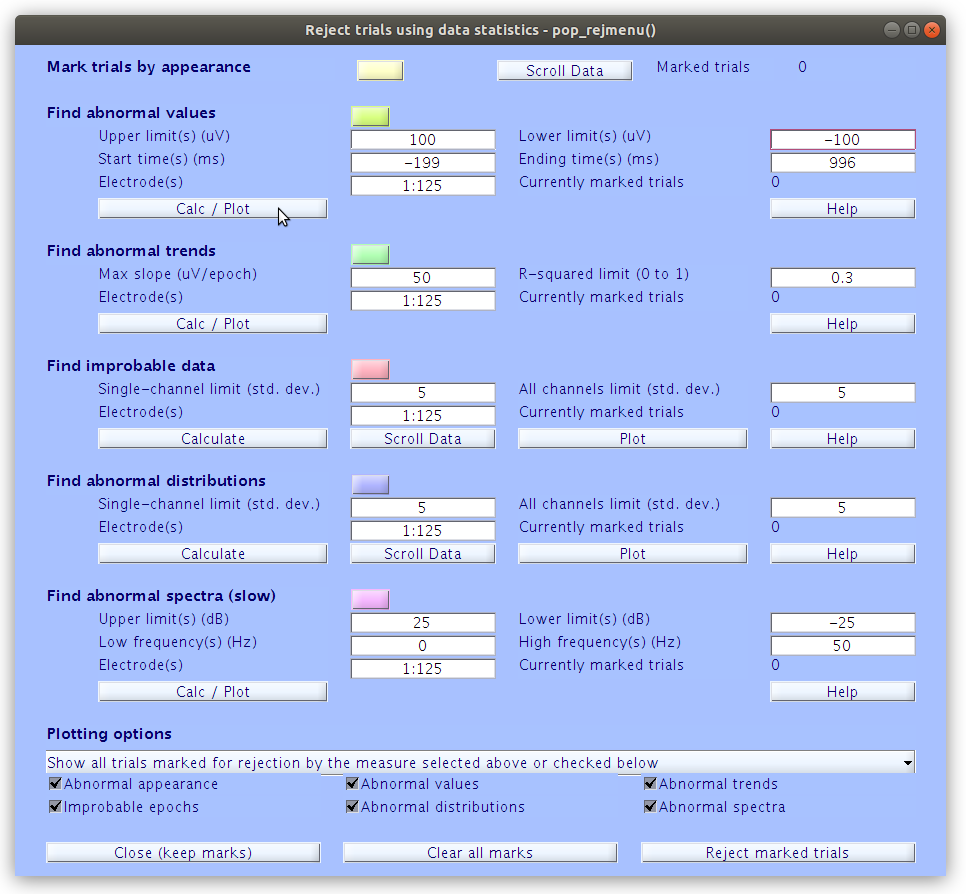
… Don’t forget to “Reject marked trials”!
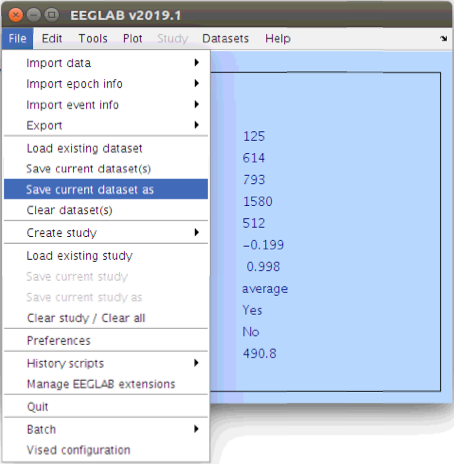
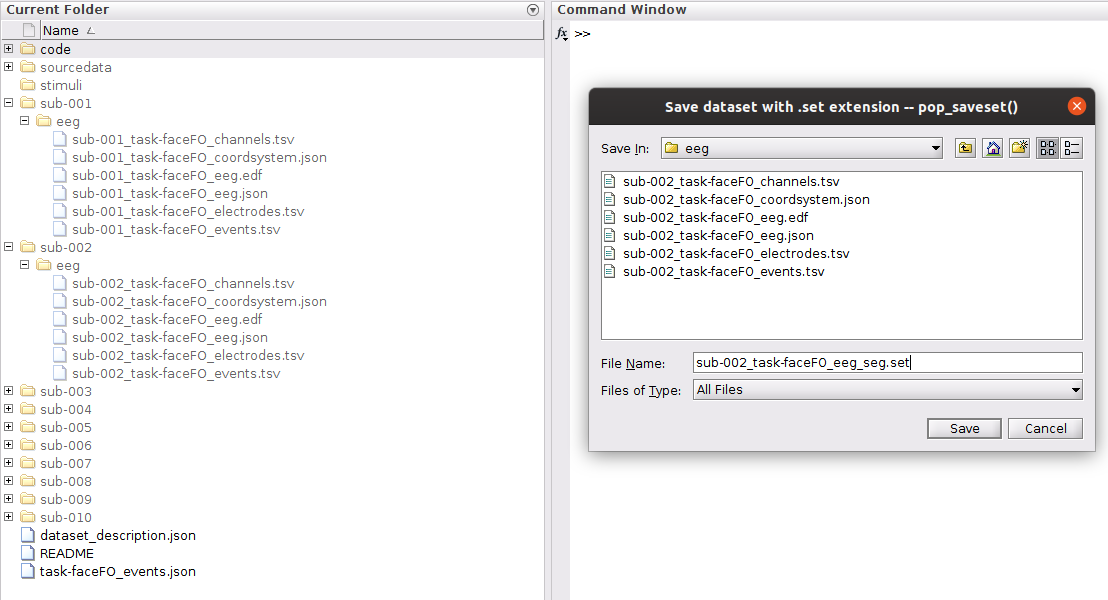
Save the segmented data
Now that we have done some typical signal processing and artifact detection we can save the current segmented dataset to a file and then examine the ERPs that it contains. When saving a data set from EEGLAB we are writing the EEG structure to a Matlab file that can be easily loaded again later.
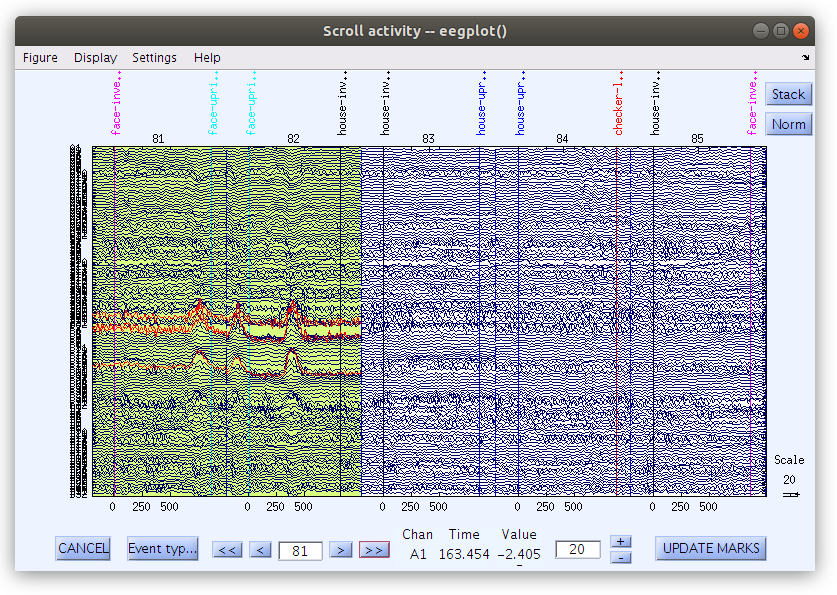
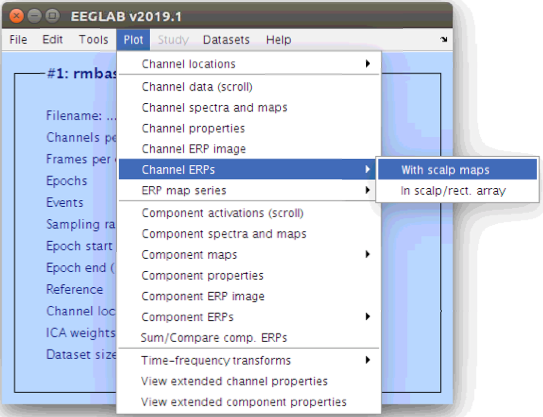
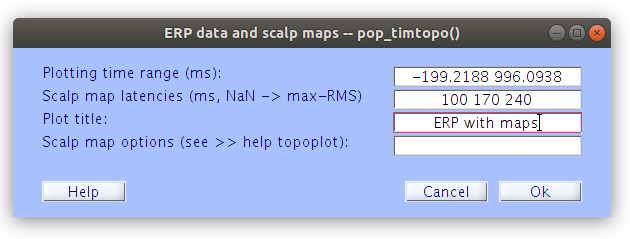
Plot scalp ERPs
EEGLAB does not store the ERP in the EEG structure. Specifically, EEGLAB never averages the EEG.data array along the third (page or epoch) dimension. Rather it leaves the EEG.data array in its three dimensional form and only averages the epochs in memory while generating plots or pre-computing STUDY summaries.
Now that the EEG.data array is in three dimensions (segmented) new figures are available via the “Plot” menu. We can take a look at the ERP of our current segmented data as follows:
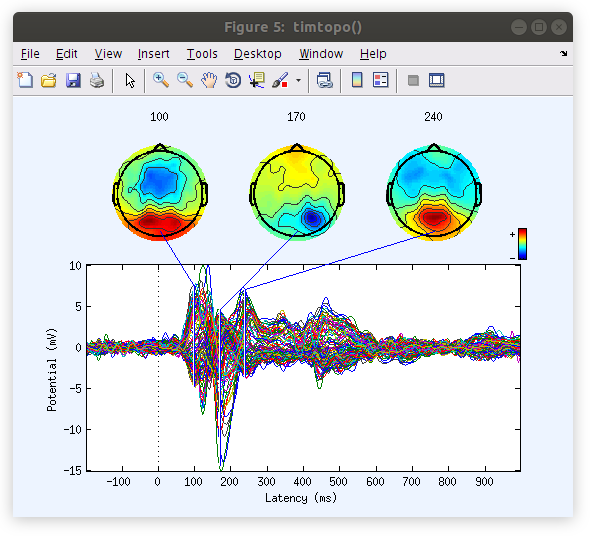
Note: now is a great time to explore some of the other plotting options!
Some favorites:
- Channel ERP Image
- Time-frequency transforms
Key Points
Working with the data in EEGLAB