Introduction
Overview
Teaching: 15 min
Exercises: 5 minQuestions
What is a tweet?
What is an API and how can I get started?
What is Twarc?
Objectives
How is a tweet considered to be data?
How to access the twitter API
How twarc works with the API
Learning to Speak Twitter
Twitter is a social media platform where users post short (140 or 280 characters) messages, pictures, news stories, and other content to be viewed by others. These posts are referred to as “tweets”. Twitter users curate their social personas by subscribing to (or following) other twitter accounts. It allows people from all over the world to interact with each other almost instantaneously.
If you’ve never used Twitter before, the terms used there can be cryptic (and not safe for work). Beyond “@ing people” and “hashtags”, the users themselves have created Twitter-wide standards. Twitter is also filled with subcommunities who use their own lingo.
Twitter has its own getting started guide, but here are a few terms you will hear throughout the workshop and might see as fields in your data.
| Twit-term | Definition |
|---|---|
| Tweet | Can be a noun or a verb. Tweets are messages posted to twitter that are made to be shared and interacted with |
| Hashtag | A keyword or phrase (no spaces) with the # before it. You can use hashtags to see other tweets with the same tag or topic |
| Retweet | A shared tweet |
| @- | Usernames begin with a @ symbol and are used as a unique identifier for a twitter profile. |
| Following | Subscribing to a twitter account. You can see an account’s tweets as soon as they post something new |
| Mention | By including the @ sign followed by a username, you can mention other accounts. This refers to usernames included in a tweet |
| Verified | A verified Twitter account receives a blue check icon to indicate that the creator of these tweets is a legitimate source, such as a public figure |
Tweet
This is an example of what a tweet looks like on the brower, from the @twitter account itself. It describes a 2022 change in the way retweets and retweets with quotes are displayed in the interface. It was kind of a significant moment for the twittiverse, and a convenient moment to remind the readers about Public Health.
Three things—
— Twitter (@Twitter) August 31, 2020
1. "Retweets with comments" is changing to "Quote Tweets"
2. Quote Tweets will appear right next to Retweets
3. The mask goes over your nose pic.twitter.com/x00YTZSAFs
Your Twitter Experience
If you are a twitter user, what terms have you encountered in your use? Alternatively, what do you know from Twitter as a non-twitter user? What might this tweet mean? Is that account a real person or a bot? Who made it?
Check out this article on Twitter Language or Slang.
Why Should You Care About Twitter?
Every user, tweet, video, and emoji on Twitter is data that can be collected and analyzed. In recent years Twitter analysis has become increasingly popular and has played a hand in predicting events from natural disasters to election outcomes.
With millions of tweets sent out each day, and the range of content within those tweets means that Twitter is a source for a large amount of data.
Big Data
Based on these guidelines, some refer to Twitter data as Big Data. Big Data has been distinguished as so much data that it is unmanageable, and therefore unable to be analyzed. We won’t be handling Big Data during this lesson.
In order to analyze Twitter data, we must first retrieve it which we will be doing using a tool called an API.
APIs: Application Programming Interfaces
API is an acronym for Application Programming Interface. APIs facilitate direct interaction between computer programs. An API is a set of instructions or abstractions that a program provides for other programs to exchange information or interact with it. Just as your shower provides an “interface” for operation (for example, knobs for controlling how hot the water is), interoperability between software systems is possible because programmers define APIs for other programs to use.
Common Analogy
APIs are often explained through an analogy to ordering a meal. Imagine yourself sitting at a table in a restaurant. The waiter comes to your table and you may choose from a set list of items on the menu. The waiter then takes your order to the cook who puts together different meals and drinks for your table. The waiter then takes your order to your table.
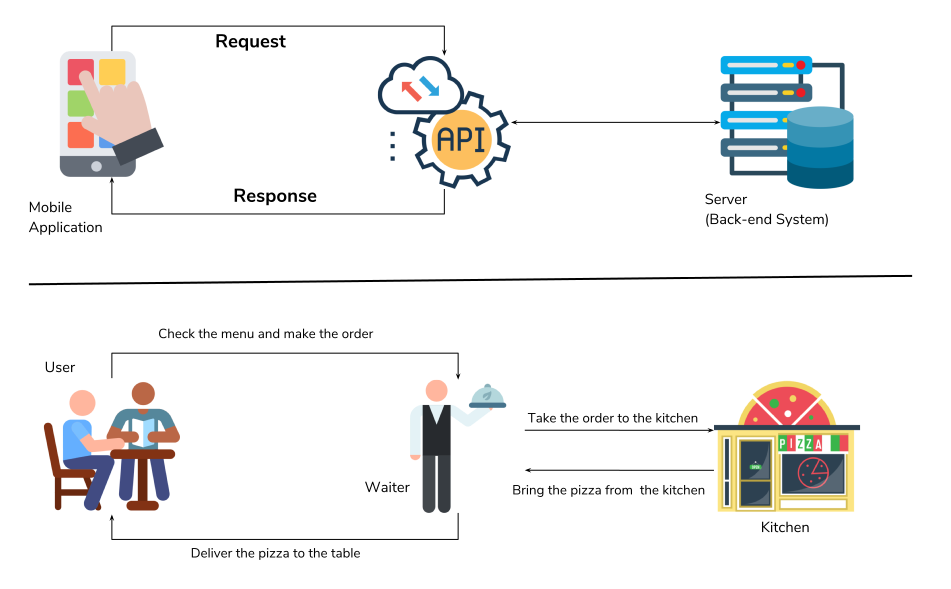
Here are the key players in our analogy:
- Customer - you as the user
- Menu items - the commands and operations you can pass to an API in order to retrieve information
- Waiter - the API that delivers your information request to the system, and then your resulting dataset to you
- Cook - the external program or webserver that has the information you seek
You can visualize this analogy by watching this video.
APIs are not Webscraping
The biggest difference between APIs and Webscraping is the retrieval method. With API’s you are using a system preset by the website you are trying to access the data from (Twitter, YouTube, Spotify, etc.). There are often requirements about what you can and cannot retrieve from the site and what you can do once you have the data, but it is generally very efficient and doesn’t require too much from the user. Webscraping is a tool used to extract specific information from a website(s). Typically, webscraping is best for extracting data from multiple sites at once, when there is no API available, or when the amount of data you want to extract exceeds the limits you’re given. If you’re interested in learning more about webscraping, you can check out our curriculumn of ‘Introduction to Webscraping’.
Twarcing
You may be asking, “What is twarc?”
twarc is the software that is going to interact with the Twitter API on our behalf. It was created by a group of people now known as Documenting the Now.
Doc the Now develops open source tools and community centered practices that supports the ethical archiving of web and social media content. This workshop will teach you about the collection, use, and preservation of twitter data from this point of view.
twarc is a command line tool and Python library that is used to collect and archive Tweets through the Twitter API. twarc is a community built, Free and Open Source Software (FOSS). To elaborate, twarc is accessible, free, and can help simplify data harvesting once you practice using it. twarc is also an active open-source project, so it is open to collaboration and use by anyone. The documentation can be viewed on Github.
twarc allows you to request specific data based on keywords, hashtags, events, and other areas of interest. Once you have your dataset, twarc has what the developers refer to as ‘utilities’. These are python programs that can be run on the command line to explore and visualize your data.
Open Source = Open Community
If you run into any errors, the people who built twarc respond quite quickly (and they’re very friendly). Navigate to the ‘Issues’ page on their repository and open a new issue. You can also view pre-existing issues (open or closed) to see if someone has already answered a question like yours.
Key Points
Twitter is a microblogging platform that allows data collection from its API.
Twarc is a Python application an dlibrary that allows users to programmatically collect and archive Tweets.
Getting familiar with JupyterLab
Overview
Teaching: 35 min
Exercises: 25 minQuestions
What is JupyterLab?
How do I move around in JupyterLab?
How can I set up twarc on JupyterLab?
What’s a good way of running twarc in our Jupyter environment?
Objectives
Become acquainted with the Jupyter Lab tools
Set up directory and data folder
Set up twarc with your keys and tokens
Brief Intro to JupyterLab
JupyterLab is a web interface for creating Python scripts with Jupyter Notebooks. For this workshop, we will be using a hosted instance of JupyterLab pre-configured with all of the Python tools you will need to follow along with the lesson.
JupyterLab is an Integrated Development Dnvironment (IDE) that enables us to write and run programs. JupyterLab runs in one tab on your browser. In this episode, we will learn to upload and download files from your computer to your storage space on JupyterLab, create and navigate the directory structure, and use the built-in BASH terminal.
Thank you UCSB Letters & Science IT
This workshop, is written for a JupyterLab environment with twarc preinstalled. At our first workshop with this environment, we had many fewer installation and path issues than in other workshops.
Examples should all work with locally installed Jutpyter / Python 3+ environments.
Thanks to UCSB Letters & Sciences IT for setting up our JupyterLab server :)
If you have a fully configured version of Python, you can also install and run twarc on your own computer. The documentation for installing twarc is found at this repository. For this workshop, follow along in the provided environment.
Data Moment: Where are your files?
If you are using an online Jupyter environment you will need to put copies of your data files into that environment.
If you are running your own Jupypter on your laptop, make sure to move the data files someplace under your local control. Do NOT use a DropBox or Google Drive.
If your data files are ‘in the cloud,’ when the files attempt to syncronize, you might encounter unanticipated issues in your R environment.
Starting up JupyterLab
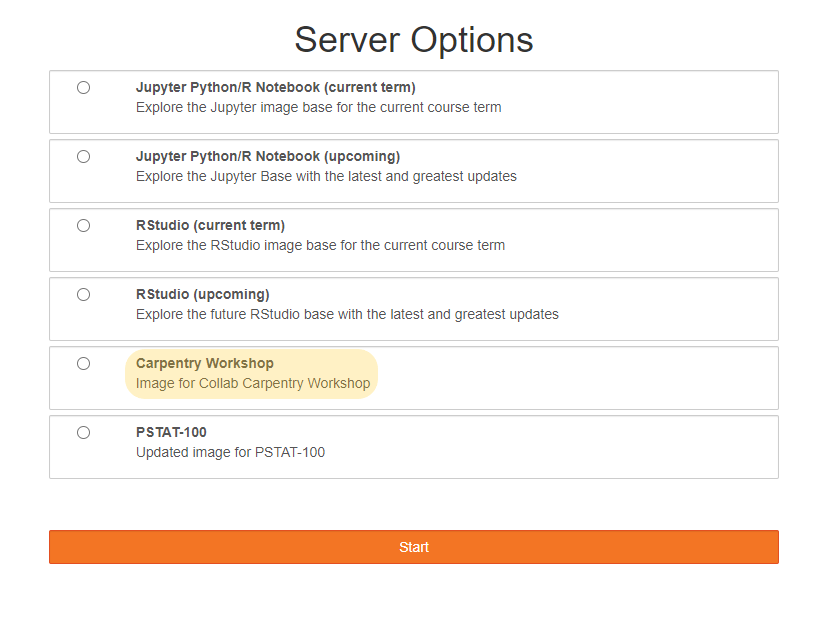
Open our LSIT JupyterLab in a fresh web browser window.
Select ‘Carpentry Workshop’ under the server options. It will take a few minutes to fire up your virtual machines.
Navigating the JuptyerLab interface
When you first open JupyterLab, you will find a file browser tab on the far left side of the screen. This is where we can manage our files and navigate in-and-out of directories. The window that is labeled “Launcher” contains options for what to start up. For this workshop, we will be using Python 3 Notebook and Terminal.
Next, note the toolbar found at the top on the screen. There, you will find options that are needed to run and save programs you write.
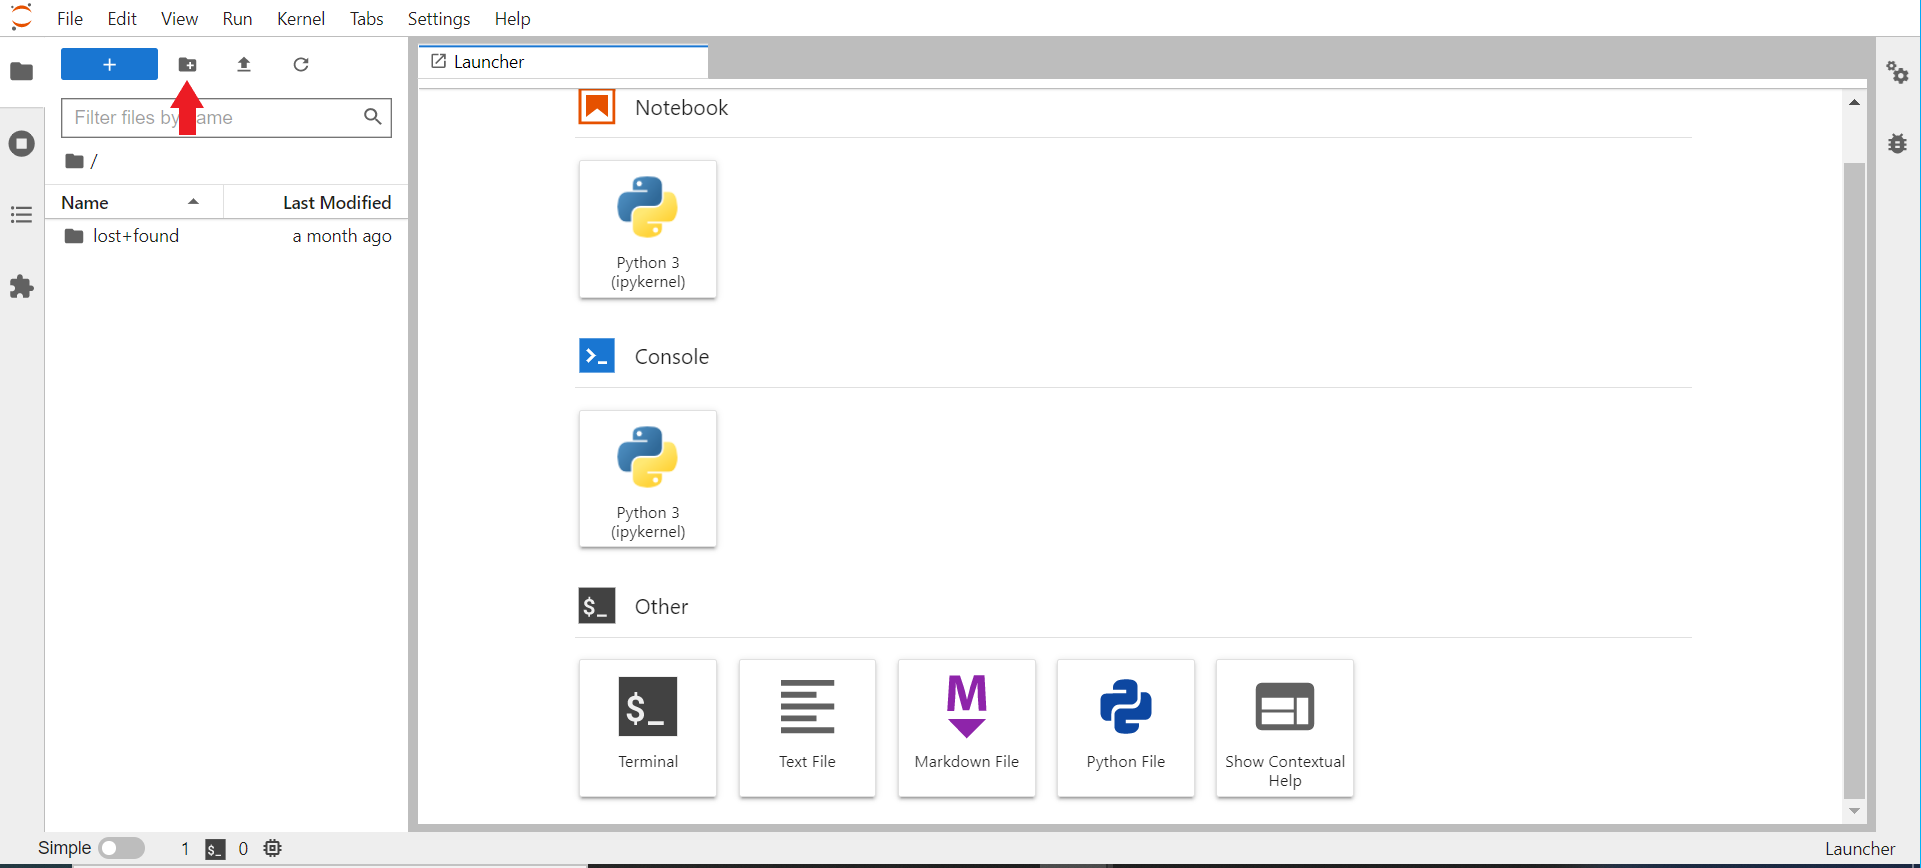
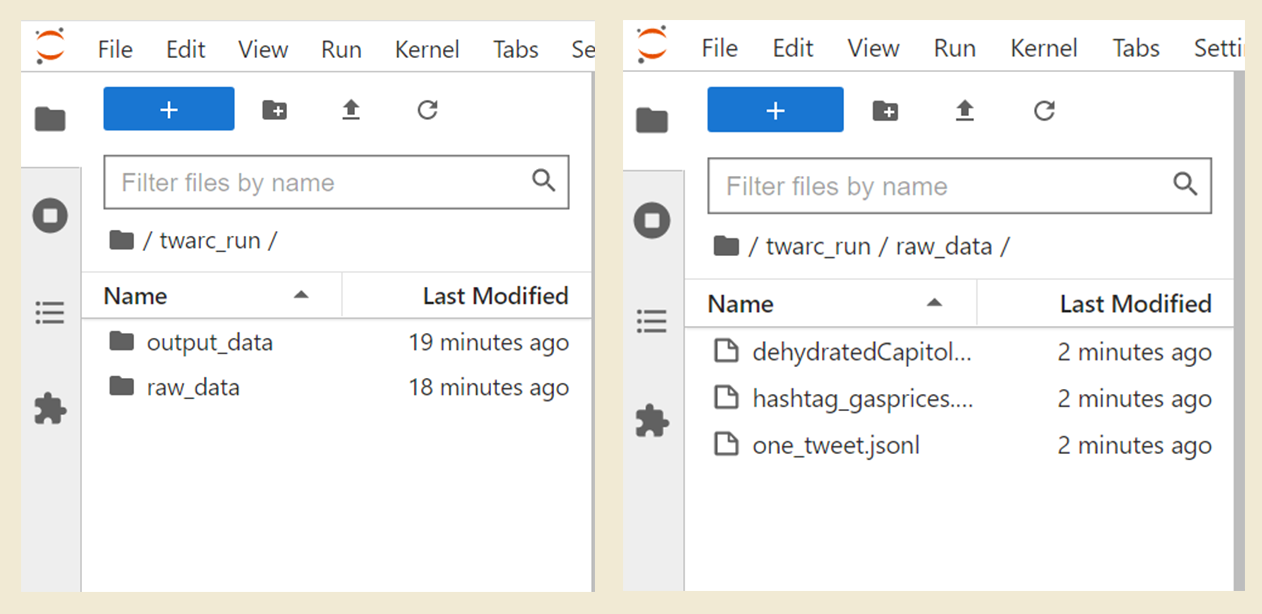
To start off, we need to create some directories that we will be working in. Open the
file browser and create a folder to store all of your workshop files in (e.g. python
notebooks, data folders, etc). To create a folder, select the icon that is highlighted
in the above image. We have chosen to name the folder twarc_run. We will
organize all of our files in this folder, and this folder will be our working
directory.
Inside of twarc_run, let’s make three more folders. Please create one folder that is
named raw, and create a second folder named output. raw is
where we will store our original data. The output folder
is where we will store Twitter data tah we process. output should not be inside
of raw, and vice versa. Instead, both folders should be inside of twarc_run.
Since raw is where we will store our original data files, please open this data folder
and upload all of the datafiles:
hashtag_gas.jsonltweets that use #gasprices collected May 22, 2022.one_tweet.jsonla single tweetriot_weets.txtTweetIDs from the January 6, 2021 insurrection.
In total you should now have two folders within twarc_run: raw and output.
If you have not downloaded the data, please
do so now from the Setup Page
instructions. Once the data files are uploaded, navigate back to our project
directory twarc_run. Once you are done, your file organization should look like the
below image.
Using the Terminal and Nano Editor in Jupyterlab
Now, let’s start up the terminal. In your Launcher tab, select the Terminal icon under “Other”. We will be using the terminal to sign into your twitter developer account. You will see that the launcher screen is replaced by the terminal window. You may open the launcher tab by selecting the large rectangular button with the plus (+) sign. When you open the launcher in this way, the terminal window will not close.
The shell or terminal, is a program where users can type in commands. The terminal window is all about the keyboard–you cannot mouse around in there. The terminal window is running a lightweight version of BASH, so you can use all of the common Linux/Unix file system commands:
| Git command | Command operation |
|---|---|
pwd |
print working directory |
cd |
change directory |
ls |
list contents of a directory |
mkdir |
make new directory, a folder |
In our JupyterHub environment, we have the standard Juputer built-in text and csv
viewer/editors. We have also pre-configured the nano text
editor to work from the terminal. We are using nano in this workshop
because it is one of the least complex text editors. There are many other editors such as
Notepad++ or VIM, which you can configure to use on your own device.
Let’s move around our directories in the Terminal to get comfortable.
Print your working directory using pwd and make sure you are in the
directory twarc_run. If you are not in the proper directory, please
change directories using cd to move into twarc_run. Your current working
directory in BASH is separate from the current working directory of you
Jupyter notebook.
Remember:
You can only type where the cursor is blinking. And you can’t move the cursor with your mouse.
Configuring twarc in the Terminal
Continuing in the terminal window, we will configure twarc so that it is connected to your Twitter developer account and to your app. If you do not have a twitter developer account, please complete the Setup Page instructions. Take a moment to gather the following keys and tokens:
Tokens and Keys
- Bearer Token
- API Key
- API Key Secret
- Access Token
- Access Token Secret
Let’s start configuring twarc by sending typing in the command twarc2 configure. You
should get the output below:
twarc2 configure
👋 Hi I don't see a configuration file yet, so let's make one.

Please follow these steps:

1. visit https://developer.twitter.com/en/portal/
2. create a project and an app
3. go to your Keys and Tokens and generate your Keys

Please enter your Bearer Token (leave blank to skip to API key configuration):
We will be entering in all of our keys and tokens and should not have to leave any of the prompts blank. You may copy/ paste the keys and tokens you were asked to save. At this step, please enter your bearer token.
Copy and Paste keyboard shortcuts
Windows and Linux:
ctrl + cto copy,ctrl + vto pasteMac:
command + cto copy,command + vto paste
Please enter your Bearer Token (leave blank to skip to API key configuration): xxxxxxxxxxxxxxxxxxxxxxxxx
(Optional) Add API keys and secrets for user mode authentication [y or no]?
After you enter your bearer token, please enter y for the following question. This is so we can add the API key and API secret.
(Optional) Add API keys and secrets for user mode authentication [y or no]? y
Please enter your API key: xxxxxxxxxxxxxxxxxxxxxxxxx
Please enter your API secret: xxxxxxxxxxxxxxxxxxxxxxxxx
How would you like twarc to obtain your user keys?
At this step, please select the option to manually input your user tokens.
Please enter your choice [1 or 2] 2
Enter your Access Token: xxxxxxxxxxxxxxxxxxxxxxxxx
Enter your Access Token Secret: xxxxxxxxxxxxxxxxxxxxxxxxx
After you have entered your Access Token Secret, you will see the following message.
Your keys have been written to /home/xxxx/.config/twarc/config

✨ ✨ ✨  Happy twarcing! ✨ ✨ ✨
All of the information you just entered is saved in a configuration file. Next time you start up twarc on this JupyterLab, you will not need to configure twarc.
If you try to run a twarc command without configuring twarc, you may see this message:
Incomplete credentials provided.

Please run the command "twarc2 configure" to get started.
Test our twarc configuration from the Notebook
We should confirm that twarc was configured correctly and that you are ready to continue using twarc. To test the twarc configuration, we will harvest tweets from a twitter account. At the same time, we will learn how to send bash commands from a Jupyter Notebook.
Please Open a new launcher (select the blue rectangular button with the plus sign) and open a Python 3 Notebook (do not open a Python 3 Console). You will see the following window open:
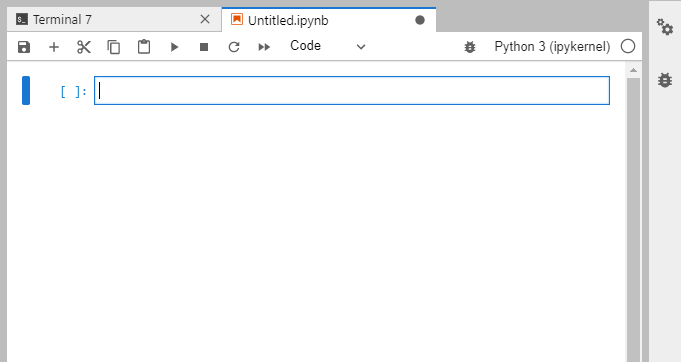
At the top of the Notebook tab, notice that there is a new toolbar. Each of the buttons
has a shortcut key. We will mostly use b to add a cell, shift + enter to execute
whatever code is inside the current cell.
You can type either Python code or Markdown into a cell. We will be doing both. We are using this notebook so that we can save our work along the way. At the end of the day, you can save your notebook file and try to run it later on your own installation of twarc.
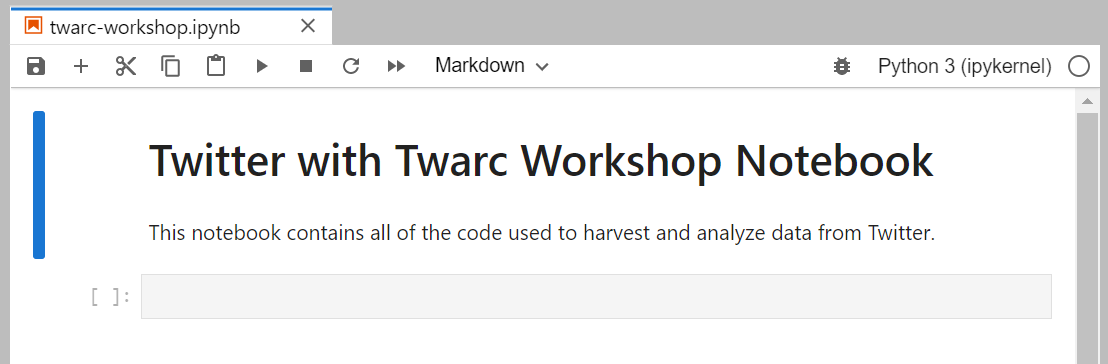
Let’s put some effort into formatting it nicely by putting a Markdown cell at the top:
# Twitter with twarc Workshop Notebook

This notebook contains all of the code used to harvest and analyze data from Twitter.
If you run that line, Jupyter will render that markdown into something that looks like this:
In another cell, we will write some code:
#hashtages are not only used in Twitter
#they indicate a python comment
print('Hello World!')
Hello World!
Inside code cells, we can write comments or commands. Comments written with the hashtag # will not be ran. Other lines in the cell will be read as code.
In another code cell, use the command pwd to check whether we are in the directory twarc_run. Use the command cd if you are not in twarc_run. Now, let’s call twarc2 from inside of our notebook.
BASH Commands in JupyterLab
We can run twarc from the terminal window in JupyterLab, or we can send BASH commands from our Jupyter Notebook.
Because we will be using a mix of Python code and BASH commands, it’s important to keep in mind which is which. When we use JupyterLab to run BASH commands, we need to start each line with an exclamation point (!). For example: if a twarc command is
twarc2 timeline, then the line to run the twarc command in JupyterLab is:!twarc2 timeline
The twitter account that we will collect tweets from is Bergis Jules, an archivist and scholar working in digital humanities. He is the Community Lead for Documenting the Now (DocNow), the project behind twarc’s development. To retrieve Jules’ recent tweets, please run the following command in a Python Notebook:
!twarc2 timeline BergisJules > 'raw/bjules.jsonl'
API limit of 3200 reached: 18%|█▉ | 3141/17680 [00:34<02:37, 92.23it/s]
If the twarc configuration was successful, you will see a loading bar at the bottom of the cell.
After the cell has completed running the line, there
will be a file called “bjules.jsonl” inside of raw on your file browser. This file
contains the data of tweets under the username “@BergisJules”.
Twarc: twitter and archiving
Documenting the Now
“Documenting the Now develops open source tools and community-centered practices that support the ethical collection, use, and preservation of publicly available content shared on web and social media. Documenting the Now responds to the public’s use of social media for chronicling historically significant events as well as demand from scholars, students, and archivists, among others, seeking a user-friendly means of collecting and preserving this type of digital content.”
The Documenting the Now Project started in 2014, in the aftermath of the killing of Michael Brown Jr. in St. Louis, Missouri (U.S.). A group of archivists got together, recognizing that protest and activism surrounding this had initially happened on twitter and other social media. There was also a consideration of how this content would be recorded as a part of history, starting with this idea of how these events would be remembered as they transpired on social media. Bergis Jules and Ed Summers collected tweets that contained the key word ‘ferguson’ (the suburb of St. Louis where Brown was killed), collecting 13 million tweets. In the process of doing so, they developed a utility named twarc, short for twitter and archiving.
A large part to DocNow is commitment to ethical social media collection. Activists and protesters had not consented to be part of an archive, with their content that were on twitter and other places online. They were never consulted on if they wanted their content to be remembered long from now. A large part of the DocNow was how to build an archive of social media content for the long term, with consent from the content creators. For us in the workshop, we will be discussing practices for ethical twitter harvesting before going over instruction on using twarc.
Using the Help
By using the –help command, you can pull up the syntax guidance and available tools with twarc. You may find this useful as you go through the lessons to learn how to use different tools, or at the end of the workshop as a summary of the tools you have learned. Let’s run it from our notebook so that we can view it at our convenience.
Twarc2 is a program, not a line of code. To run the twarc bash command, we start the line with an exclamation point !.
!twarc2 --help
Usage: twarc2 [OPTIONS] COMMAND [ARGS]...

  Collect data from the Twitter V2 API.

Options:
  --consumer-key TEXT         Twitter app consumer key (aka "App Key")
  ...
  --help                      Show this message and exit.

Commands:
  compliance-job  Create, retrieve and list batch compliance jobs for...
  configure       Set up your Twitter app keys.
  conversation    Retrieve a conversation thread using the tweet id.
  conversations   Fetch the full conversation threads that the input...
  counts          Return counts of tweets matching a query.
  dehydrate       Extract tweet or user IDs from a dataset.
  flatten         "Flatten" tweets, or move expansions inline with tweet...
  followers       Get the followers for a given user.
  following       Get the users that a given user is following.
  hydrate         Hydrate tweet ids.
  liked-tweets    Get the tweets liked by a specific user_id.
  liking-users    Get the users that liked a specific tweet.
  lists           Lists API support.
  mentions        Retrieve max of 800 of the most recent tweets...
  places          Search for places by place name, geo coordinates or ip...
  quotes          Get the tweets that quote tweet the given tweet.
  retweeted-by    Get the users that retweeted a specific tweet.
  sample          Fetch tweets from the sample stream.
  search          Search for tweets.
  searches        Execute each search in the input file, one at a time.
  stream          Fetch tweets from the live stream.
  stream-rules    List, add and delete rules for your stream.
  timeline        Retrieve recent tweets for the given user.
  timelines       Fetch the timelines of every user in an input source of...
  tweet           Look up a tweet using its tweet id or URL.
  user            Get the profile data for a single user by either...
  users           Get data for user ids or usernames.
  version         Return the version of twarc that is installed.
These are all of the commands that you can send via twarc2. You can also view all the help for twarc 1.0!
Challenge 1: Timelines
- Can you find the file called “bjules.jsonl”?
- Download a timeline for one of the twitter accounts from this list:
- NCEAS “@ucsb_nceas”
- EcoDataScience “@ecodatasci”
- R-Ladies Santa Barbara “@RLadiesSB”
- spatial@ucsb “@spatialUCSB”
- UCSB Collaboratory “@libratorybot”
- What do you notice about the file that was created from using the timeline command?
Solution
Remember, we ran the following code a little earlier in the episode:
!twarc2 timeline BergisJules > 'raw/bjules.jsonl'Our output tag
raw/bjules.jsonlindicates that our filebjules.jsonlis located in the folderraw.To put that generically:
!twarc2 timeline twitter_handle path/to/filename.jsonlNote: if you included the @ sign, you probably got an error
Some observations on the files we created:
- they’re all jsonl.
- Most of them are fairly small (around 300 tweets), apart from
ucsb_nceas_tweetswhich reached the API timeline limit of 3200 tweets.
Working from Your Notebook
The
main reason to use Jupyter Notebooks is to write code and leave ourselves notes
in Markdown. This includes BASH commands that we designate with a !
(often prounoucned ‘bang)
Because the tool twarc_csv is a plugin, we need to install it each time our JupyterLab server restarts. We also need emojis.py, so go ahead and put that in a cell at the top of your notebook:
! pip install twarc_csv
! pip install emojis
Next we load the Python libraries we will be using today, and then load our Bergis Jules data into a Pandas dataframe. You may need to run the import lines in individual cells.
No bangs, because this is Python code:
import pandas as pd
import twarc_csv
import textblob
import nltk
import os
Flattening Twitter Data
Twitter Timelines, and other files we harvest using twarc, need to be ‘flattened’
before we use them. Flatten will ensure that each line of the file is 1 tweet.
We can use ! wc to see how many tweets we have after we create the flattened
file.
Before flattening:
! wc raw/bjules.jsonl
We might think there are 32 tweets in Jules’ timeline.
!twarc2 flatten 'raw/bjules.jsonl' > 'output/bjules_flat.jsonl'
After flattening:
! wc output/bjules_flat
Converting between file types: jsonl to csv to dataframe
csv’s are convenient for reading and better for analyzing tweets outside of twarc because of it’s data format. csv’s are better in comparison to jsonl, because it organizes our collected tweets’ attributes (e.g. “id”, “text”, and “lang”) into easy to read columns.
We will almost always convert our files to .csv format.
!twarc2 csv 'raw/bjules.jsonl' > 'output/bjules.csv'
And Pandas dataframes are useful structures for later analysis, so you may as well make one of those too:
bjules_df = pd.read_csv('output/bjules.csv')
Check the file browser to make sure your file was created where you expected it to be. We will also get in the habit of making dataframes out of our csv’s, because dataframes are a convenient format for manipulating data in Pandas.
Now that we have flattened our data and made a csv, we can see how
many tweets we harvested from Jules’s timeline using wc in the terminal.
We don’t have to remember what twarc told us.
!wc 'output/bjules.csv'
Check how many Tweets we got from Bergis by looking at:
- word count
- the length of the dataframe
- looking at the csv in jupyter
Challenge: Compare and prepare two timelines
- Now we will do the same transformation on tweets from the twitter user
ecodatasci. (or whoever’s timeline you downloaded)- How many tweets did you get from the timeline that you downloaded?
Solution
- Flatten your collected tweets
!twarc2 flatten 'raw/ecodatasci.jsonl' > 'output/ecodatasci_flat.jsonl'
- Convert to csv format
!twarc2 csv 'output/ecodatasci_flat.jsonl' > 'output/ecodatasci.csv'
- Convert to pandas dataframe
ecodatasci_df = pd.read_csv('output/ecodatasci.csv')
Remember, if you get an error, you can correct it in the cell, and then run the cell again.
Key Points
Navigating Python in a JupyterLab environment
Configuring an application to work with an API
Arranging a directory structure and loading libraries
Anatomy of a tweet: structure of a tweet as JSONL
Overview
Teaching: 20 min
Exercises: 10 minQuestions
What does raw Twitter data look like?
What are some built-in ways of looking at Twitter JSONL data with Jupyter?
Which pieces of a tweet should I pay attention to?
Objectives
Getting acquainted with how JSONL looks
Accessing Twitter data in a human-readable way
Examining a twarc JSONL file
JSONL, Line-oriented JavaScript Object Notation, is frequently used as a data exchange format. It has become super common in the data science field, and you will encounter it frequently.
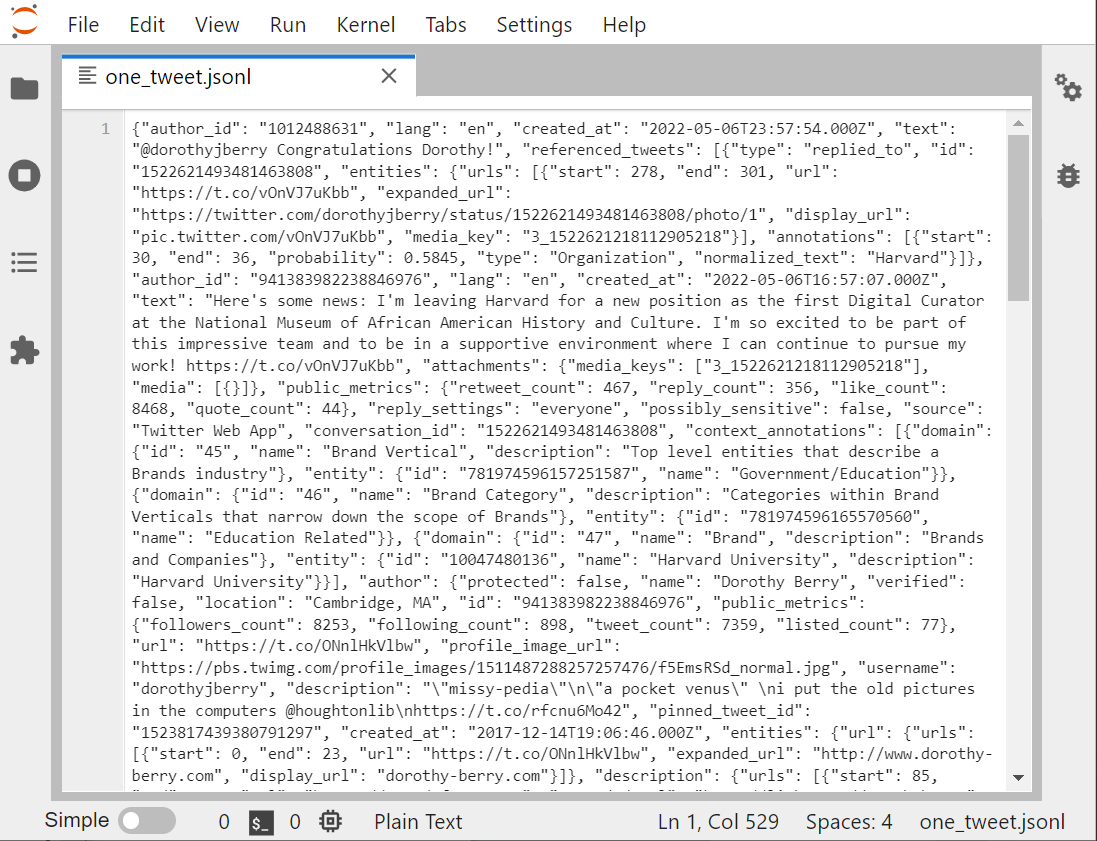
Let’s look at one individual tweet file, in the Jupyter viewer.
There are several other ways to look at any text file in the Jupyter environment:
1 Run the cat Bash command. That’s not so readable
1 Open the file with the nano editor: nano opens files unwrapped, so you can see the lines.
1 Jupyter text viewer/editor
The Jupyter viewer/editor has numbering, so we can see that this whole screen is one line. Looking at the beginning of the file, if you insert some returns and some tables, it will help you to see that JSON is a whole bunch of named-value pairs? ie:
"name": "Joe Gaucho",
"address": "123 Del Playa",
"age": 23,
"email": "jgaucho@ucsb.edu",
You can see that the key is in quotes, then there’s a colon, then the value. If the value is text, that’s going to be in quotes too.
Both nano and the Jupyter editor allows us to format the text with returns and indents, so that the individual named-value pairs are easier to identify.
JSONL vs. JSON
- JSON and JSONLs are both data structure formats based on JavaScript syntax.
- JSONLs consist of separate JSON objects in each line. A JSON object refers to an individual set or
unitof data in the JSON format.- JSONLs are more efficient to read than JSON file and are better at containing ‘objects of data’.
In our case, a single tweet acts as a single JSON object and the JSONL acts as the file that stores all of them. JSONLs better for collecting twitter data, since JSON’s are not as effective at storing multiple units of data in comparison.
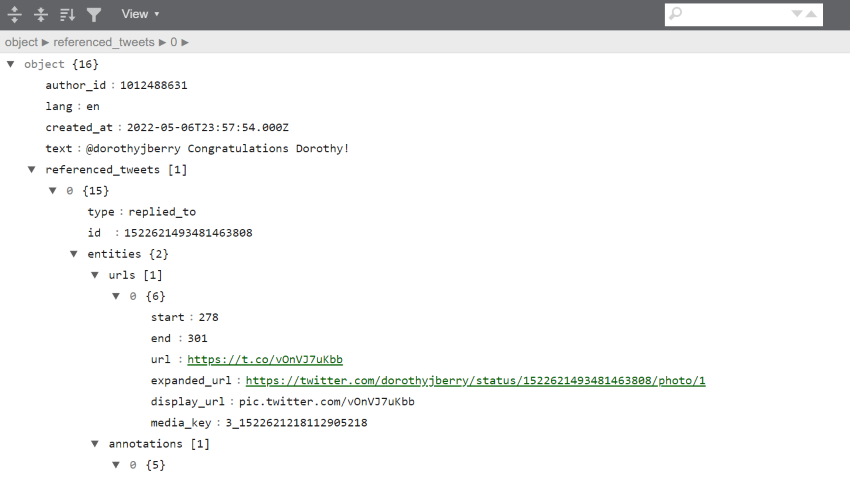
Just to show you the the contents of a single tweet, look to the output below. The output is an edit of the data with only white-space characters. These edits have been made to explore and separate the tweet’s content from the metadata.
We can see that the 4th piece of data in the tweet is “text”, and is after the author’s ID, the language, and time stamp. The fifth element, “referenced tweet”, tells us that this tweet is in reply to another tweet.
{"data": [{"author_id": "1012488631",
"lang": "en",
"created_at": "2022-05-06T23:57:54.00Z",
"text": "@dorothyjberry Congratulations Dorothy!",
"referenced_tweets": [{"type": "replied_to",
                       "id": "1522621493481463808"}],
"entities":
    {"mentions":
        [{"start": 0,
          "end": 14,
          "username": "dorothyjberry",
          "id" : "941383982238846976"}],
     "annotations": [{"start": 31, "end": 37,
          "probability": 0.8784,
          "type": "Person", "normalized_text": "Dorothy"}]},
     "in_reply_to_user_id": "941383982238846976"
     "public_metrics": {"retweet_count": 0,
           "reply_count": 0,
           "like_count": 1,
           "quote_count": 0},
reply_settings": "everyone",
"possible_sensitive": false,
"id": "1522727385380143105",
"source": "Twitter Web App",
"conversation_id": "1522621493481463808"},
There are many, many elements attached to each Tweet. You will probably never use most of them.
Some key pieces of a Tweet are:
- created_at: the exact day and time (in GMT) the tweet was posted
- id: a unique tweet ID number
- entities: strings pulled out of a tweet that line up with Twitter’s ontology
- any hashtags that are used
- any users who are @’ed
- personal names
-
referenced_tweets.retweeted.id’ if this is a retweet, this field shows the id of the original tweet.
- user
- id
- name
- screen name (twitter handle)
- followers_count (at the time the tweet was created)
All of these elements become much more visible if we download our tweet and open it up with an online JSONL viewer
We can also see just the name of each field by using the columns method on any dataframe we have made from Twitter data. For example, bjules_df, the dataframe created from Bergis Jules’ timeline:
list(bjules_df.columns)
['id',
 'conversation_id',
 'referenced_tweets.replied_to.id',
 'referenced_tweets.retweeted.id',
 'referenced_tweets.quoted.id',
 'author_id',
 'in_reply_to_user_id',
 'retweeted_user_id',
...
 '__twarc.retrieved_at',
 '__twarc.url',
 '__twarc.version',
 'Unnamed: 73']
This gives you a sense of just how much data comes along with a tweet. The final three entries are added by the Twitter API to let you know how the tweet was retrieved.
First and last tweets
Let’s look at our bjules_flat.jsonl file again.
Remember our JSONL files are line-oriented, ie: one tweet per line. Let’s use the
head and tail command to create files with the first and last lines of
our data file.
The double-greater-than >> appends rather than creates.
!head -n 2 'output/bjules_flat.jsonl' > 'output/2_tweets.jsonl'
!tail -n 2 'output/bjules_flat.jsonl' >> 'output/2_tweets.jsonl'
If we use ! cat to output the files, we see a real
mess. Let’s open the Jupyter graphical file viewer instead.
Why not use nano?
Nano, which we can call from the shell window, is a great way to stay in our little shell window with our hands on our keyboards. However, we are going to spend our workshop in Jupyter to make our work more reproducible.
However, sometimes it’s going to be advantageous to look at a file in nano, because the JSONL files open with lines unwrapped. Our 2-tweets file, for example
Using either method, it’s still difficult to tell what’s going on. Can we even tell where one tweet ends, and the second begins? Jupyter does have line numbers, so at least we can see it’s 2 lines.
With the lines unwrapped, you can advance across the line to see the posted date of the action on the timeline, as well as what type of action it was.
With the first and last tweets, that gives us the the date and time range of what we retrieved from Mr. Jules’ timeline:
#FIXME you need a new 2-tweet version
A Very Basic Analysis
One goal for us is to look at our data without looking at the JSONL
directly. When we harvest tweets, it is a very good idea to do a little exploratory,
reality-checking, analysis to make sure you got what you expected. As we did in the previous
episode, let’s look at
the bash command wc (word count) to see how many lines of JSONL,
therefore how many tweets, are in
our gas prices file. Don’t forget to flatten it first!
! twarc2 flatten raw/hashtag_gas.jsonl output/hashtag_gas_flat.jsonl
! wc output/hashtag_gas_flat.jsonl
15698 7653538 100048736 hashtag_gas_flat.jsonl
We can then look at the timestamps of the first and last tweets to determine
the date range of our tweets by using the head and tail commands to
get the first line and last line of the file:
!head -n 1 'output/hashtag_gas_flat.jsonl'
!tail -n 1 'output/hashtag_gas_flat.jsonl'
Lets save this output into a file named “gas_date_range.jsonl”:
!head -n 1 'output/hashtag_gasprices_flat.jsonl' > 'output/gasprice_range.jsonl'
!tail -n 1 'raw/hashtag_gasprices_flat.jsonl' >> 'output/gasprice_range.jsonl'
#FIXME : let’s make objects or files for these that have the date ranges pulled out.
Let’s go back and do this basic analysis for our two other files of raw data: bjules.jsonl and ecodatasci.jsonl (or whatever timeline you downloaded in the episode 2 challenge).
Challenge: Getting Date Ranges
Please create the files
bjules_range.jsonlandecodatasci_range.jsonlthat contains the first and last tweets of bjules.jsonl and ecodatasci.jsonl. Use one notebook cell per file.Remember to specify where to store your output files.
Output your answers in your notebook by creating objects and outputting them to an output cell using #FIXME …
- What are the oldest and newest items on Bergis’ timeline.
- How many items are on Bergis’ timeline?
- Same questions for the timeline you downloaded in episode 2.
Solution
#FIXME this solution is not correct. the input file is wrong.
!head -n 1 'raw/bjules.jsonl' > 'output/bjules_range.jsonl'
!tail -n 1 'raw/bjules.jsonl' >> 'output/bjules_range.jsonl'
!wc 'raw/bjules.jsonl'
We can see that we retrieved Bergis’ texts back to 2018.
!head -n 1 'raw/ecodatasci.jsonl' > 'output/ecodatasci_range.jsonl'
!tail -n 1 'raw/ecodatasci.jsonl' >> 'output/ecodatasci_range.jsonl'
!wc 'raw/ecodatasci.jsonl'
Other things we can do: sentiment analysis (FORESHADOWING). See when he joined Twitter (hint: way before 2018)
Why we flatten our twarc JSONL file
In our case, a raw or unflattened JSONL will consist of lines of API requests containing multiple tweets. Therefore, we want to flatten our JSONL file in order to isolate these tweets and ensure that each line in our JSONL file consists of a single tweet instead of a single API request.
How are the flattened and unflattened versions different?
The property “Flat” refers to the structure of JSON or JSONL files. A JSON is not flat when it has a nested structure. A nested structure occurs when data consists of an attribute or attributes that contain other attributes. Flattening isolates our desired attributes so that the data can be read linearly and separately.
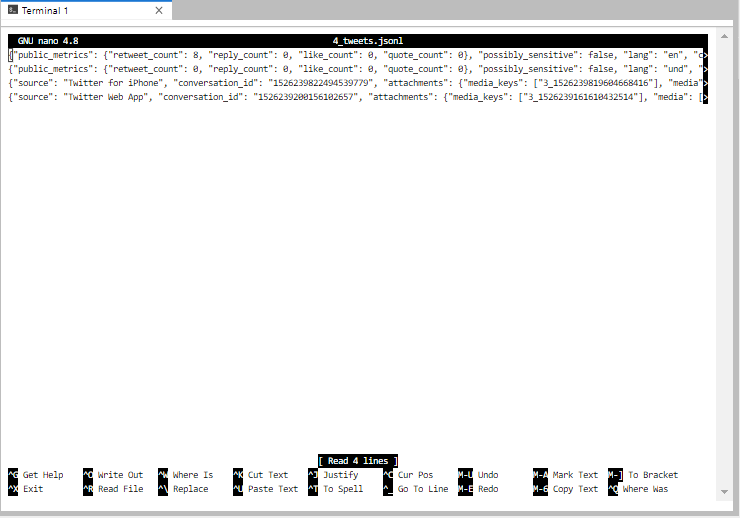
Here’s a rough illustration of the differences between flattend and unflattend twitter data:Unflattened twitter data:
{"data": [{"author_id": "1", "public_metrics": {"retweet_count": 0, "reply_count": 0, "like_count": 0, "quote_count": 0}
      ... {"author_id": "2", "public_metrics": {"retweet_count": 18, "reply_count": 1, "like_count": 10, "quote_count": 2}
      ... {"author_id": "3", "public_metrics": ... ]}
Flattened twitter data:
1 {"author_id": "1", "public_metrics": {"retweet_count": 0, "reply_count": 0, "like_count": 0, "quote_count": 0} ... }
2 {"author_id": "2", "public_metrics": {"retweet_count": 18,"reply_count": 1, "like_count": 1, "quote_count": 2} ... }
3 {"author_id": "3", "public_metrics": ... }
...
Because twarc timeline outputs API requests instead of individual tweets we need flatten or csv.

Challenge: First and last Tweets
Using the terminal or Jupyter, use the commands
headandtailto save more than just the first 2 and last 2 tweets inhashtag_gasprices.jsonl. let’s say the first and last 10. View the file to determine:
- How long is the time difference between the first and the last tweets?
- Judging by these 20 tweets, do they arrive in chronological order?
- Create a dataframe of these 20 tweets to look at the times in a more friendly way.
!head -n 10 'output/hashtag_gas_flat.jsonl' >  'output/20tweets.jsonl'
!tail -n 10 'output/hashtag_gas_flat.jsonl' >> 'output/20tweets.jsonl'
Solution
- First Tweet in the file arrived Mon Apr 18 21:59:14, Final Tweet at Mon Apr 18 18:15:33. So these are Tweets span about 4 hours.
- Answer: They arrive in reverse-chronological, with the most recent Tweets are on top, oldest at the bottom.
{"created_at": "Mon Apr 18 21:59:14 +0000 2022", "id": 1516174539742494723, ...
{"created_at": "Mon Apr 18 21:59:12 +0000 2022", "id": 1516174533732016132, ...
{"created_at": "Mon Apr 18 18:15:33 +0000 2022", "id": 1516118249443844102, ...
{"created_at": "Mon Apr 18 18:15:33 +0000 2022", "id": 1516118248110100483, ...
Well? Can we scroll through and examine it?
Key Points
Tweets arrive as JSONL, a super common format.
We can use online viewers for a human-readable look at JSONL
Tweets come with a TON of associated data
The Twitter Public API
Overview
Teaching: 40 min
Exercises: 15 minQuestions
How exactly are we using the Twitter API?
What endpoints are available to me?
What are the limitations of our accounts?
How can I standardize my workflow?
Objectives
Defining API, and what makes the Twitter API special
Demonstrating other features of twarc in the context of endpoints
The Twitter v.2 API
The Twitter API is what allows us to collect tweets. Twarc takes care of the interactions between our Jupyter notebook and the API. Twitter also keeps track of who is getting this data. That’s why there is that lengthy application process tied to their API access.
One of the ways to utilize the API access is to collect tweets and request only the information we need.
Recall that API is an acronym for Application Programming Interface. APIs allow the development of bots that generate tweets. Some examples include seismographs, weather forecasts, or delivering content on behalf of a commercial brand. Those same API features allow us to do our research.
Compared to v1, the most recent version of the Twitter API (v2) includes additional levels of access, more features, and faster onboarding for developers and academic researchers. It also forced twarc to update its code, so that’s why we are now using twarc2.
The Twitter API comes along with all sorts of rules and regulations: how to submit requests, how many requests you can make in an hour, how many Tweets you can download in a month.
That last policy is something we should highlight. The level of API access you have is limited to 500,000 Tweets per month. For that reason, while we collect Tweets during this workshop, let’s get in the habit of limiting ourselves to 500 Tweets. This is a ballpark so don’t be surprised if there are more or less.
!twarc2 timeline --limit 500 UCSBLibrary > 'raw/ucsblib_timeline.jsonl'
Set --limit of 500 reached: 15%|█▋ | 500/3271 [00:04<00:24, 113.41it/s]
So the above gives us, at most, 500 tweets from the UCSBLibrary Twitter account’s timeline. And twarc tells us that it only gave us 15% of what is available.
You can always check to see how much of your quota you have used by visiting your Twitter developer dashboard. “Academic access”, which is an elevated tier from “Essential Access”, comes with 3 projects and 10 million tweets per month.
twarc and twarc2
With Twitter’s release of the API v2, twarc2 was built to accommodate the new API. When we installed twarc2, the first release of twarc (which can be thought of as “twarc1”), is also installed. This means, you have access to some of “twarc1” tools when you install twarc2.
Endpoints
The Twitter API (similarly to other API’s) make requests for data and deliver data to you by calling an endpoint. An endpoint is a unique address that corresponds to specific types of information, and marks the limit (or endpoint) that an API may retrieve data from Twitter. The Twitter API include a range of endpoints, and they are categorized as:
- Accounts and users
- Tweets and replies
- Direct Messages
- Publisher tools and Software Development Kits
For this lesson, we will be covering some of your endpoint options that are available for to you as a user of the public Twitter v.2 API. All these endpoints apply to the Tweets and Replies that satisfy a set of parameters you have set (e.g. Tweets from a certain account, Tweets containing a certain hashtag, etc). These endpoints indicate how we may retrieve Twitter data. twarc2 give us easy access to these endpoints as commands.
| Endpoint | Description |
|---|---|
| Recent Tweet counts | Retrieve the count of Tweets posted in the last 7 days. |
| Recent Search | Access to public Tweets posted in the last 7 days. |
| Filtered Stream | Collect Tweets as they are posted in real-time. |
When you are doing exploratory searching, these are the order you want to do things in so that you don’t waste your quota.
Filtering collects tweets as they happen in realtime. We will do a filtered search later on. It’s important to estimate how many tweets you might get via a filtered stream before you start, so that you know how long to run it.
Twarc’s Data
The data that is saved using twarc is just what Twitter reads from a tweet as data and provides as data. So, keeping the data authentic for analysis is a design of twarc. twarc is also traceable, so people can see a log of how and when the data was collected.
In the v2 redesign, twarc was also designed to be easily part of a pipeline of commands. Users can connect their data collecting to other pieces of their software that expect to get tweets as inputs. When you install twarc, you will get two clients, twarc & twarc2. Twarc was designed with the v1 Twitter API in mind, and twarc2 was designed as a response to Twitter implementing their v2 API.
Tweet counts endpoint
After we specify parameters for what tweets we are interested in, we are able to get a count of tweets. This allows us to gain insight on the amount of available data without needing to pull tweets and spend our limited quota.
!twarc2 counts --text "UCSB"
The output shows there were 1,997 mentions of UCSB on Twitter in the 7 days before the command was run.
2022-05-15T18:00:00.000Z - 2022-05-15T19:00:00.000Z: 16
2022-05-15T19:00:00.000Z - 2022-05-15T20:00:00.000Z: 17
2022-05-15T20:00:00.000Z - 2022-05-15T21:00:00.000Z: 19
...
2022-05-15T18:00:00.000Z - 2022-05-16T19:00:00.000Z: 23
2022-05-15T19:00:00.000Z - 2022-05-16T20:00:00.000Z: 22
2022-05-15T20:00:00.000Z - 2022-05-16T21:00:00.000Z: 16

Total Tweets: 1,997
Twitter is NOT case sensitive, so these counts include various capitalizations of the key word, such as “ucsb”, “Ucsb”, “UcSb”, etc.
Challenge: Counting Hashtags
Run the following commands:
!twarc2 counts --text "basketball"!twarc2 counts --text "(basketball #basketball)"What do you notice regarding the total tweets you receive? Do the same for baseball to confirm, using the terms “baseball” and “#baseball”.
Will a search for a word also return that word used as a hashtag? Does the Twitter API use a boolean
ANDor a booleanORby default?Solution
The output of the command
twarc2 counts --text "basketball":2022-05-18T21:23:38.000Z - 2022-05-18T22:00:00.000Z: 1,432 2022-05-18T22:00:00.000Z - 2022-05-18T23:00:00.000Z: 2,507 ... 2022-05-25T19:00:00.000Z - 2022-05-25T20:00:00.000Z: 625 2022-05-25T21:00:00.000Z - 2022-05-25T21:23:38.000Z: 905 Total Tweets: 437,140When we do a search of some text, the count will include tweets which contain the hashtag of the text. In this example, the resulting count for “poker” included tweets which contain “#poker”.
The output of the command
twarc2 counts --text "(basketball #basketball)":2022-05-18T21:25:08.000Z - 2022-05-18T22:00:00.000Z: 69 2022-05-18T22:00:00.000Z - 2022-05-18T23:00:00.000Z: 67 ... 2022-05-25T20:00:00.000Z - 2022-05-25T21:00:00.000Z: 110 2022-05-25T21:00:00.000Z - 2022-05-25T21:25:08.000Z: 60 Total Tweets: 17,308Searching for the word “basketball” also returns uses of “#basketball”. Both are included in the 437,140 from the first count command (a Boolean
OR).This command did a count on tweets that contained the text “basketball” and “#basketball”. The resulting number of 17,308 is smaller than the count from the first count command, that tells us the Twitter uses a boolean AND by default.
Challenge: Counting Hashtags Again
Challenge Try using the counts command on other topics by comparing the counts from the words “poker” and “football”. Aggregate the counts together by day. Do you think we can use these results to get insight on what sports are most popular on Twitter?
Solution
The
--granularityflag for the counts command sets the time interval for aggregate counts.!twarc2 counts --granularity "day" --text "poker" !twarc2 counts --granularity "day" --text "football"And their respective outputs:
Total Tweets: 112,077
Total Tweets: 1,921,740
Gathering Big Data
Getting a sense of the scale of the conversation on Twitter is important. When you are starting out, you won’t have much idea about how many tweets a search will return. With a monthly limit of 500,000 tweets, it’s good to use the Recent Tweet Counts endpoint to do some exploratory searching.
You are able to get thousands of tweets when specifying your parameters to cat-related Twitter content. That’s a healthy amount of data to analyze, and cats-related content is the most popular posting on Twitter. We also looked at and compared the number of tweets related to sports content in Twitter. Sports is second in popularity, perhaps second only to political-related content.
But just how big is Twitter? Try running these counts:
Type along the following commands:
Let’s try getting tweet counts for each of these common English words:
!twarc2 counts --granularity "day" --text "dog"
!twarc2 counts --granularity "day" --text "cat"
!twarc2 counts --granularity "day" --text "amazon"
!twarc2 counts --granularity "day" --text "right"
!twarc2 counts --granularity "day" --text "good"
Solution
Their respective outputs are:
Total Tweets: 1,605,699
Total Tweets: 2,481,676
Total Tweets: 6,538,724
Total Tweets: 13,321,791
Total Tweets: 28,238,126
Specific topics, such as “dog” and “cat”, return lower counts compared to searches of commonly used words, “right” and “good”. Notice that the word “amazon” has a count that is between specific topics and commonly used words. “amazon” may refer to the geographical Amazonia, or the company.
This shows the range of numbers we are able to get from Twitter, and that the counts depend on the scope of the word. It looks like any English word that is used on Twitter more than 10 million times a week on Twitter is a fairly non-specific search.
That should give us a pretty good idea that for research use, 500,000 tweets is plenty to handle. And again: if you need more, there is a elevated level of access for more high-powered academics.
Pipeline: jsonl > head & tail > wc > csv > dataframe
Just like we should keep track of how many tweets we download at any given time, we should implement a standard workflow when gathering tweets. Generally for the rest of this workshop, we will follow this workflow:
- Collect Tweets as .jsonl files
- Flatten the raw data. This is necessary when you certain commands to collect data (
timeline, etc.) - Convert the flattened .jsonl file to csv
- Use
wcto make you received as much as you expected - Use
headandtailto make sure you got the timespan you were expecting - Create a Pandas dataframe
We’ve already discussed that While JSON is common, it’s not super human-readable, and it can be difficult to convert to a dataframe (which most of us will want to do anyway). So twarc2 has an extension to turn our harvested jsonl to csv. csv’s are always easily convertible into Pandas dataframes.
So let’s flatten the UCSBLibrary timeline and convert the flattened data to a csv:
!twarc2 flatten raw/ucsblib_timeline.jsonl output/ucsblib_timeline_flat.jsonl
!twarc2 csv output/ucsblib_timeline_flat.jsonl output/ucsblib_timeline.csv
100%|████████████████| Processed 282k/282k of input file [00:00<00:00, 27.6MB/s]
100%|████████████████| Processed 539k/539k of input file [00:00<00:00, 5.50MB/s]

ℹ️
Parsed 500 tweets objects from 500 lines in the input file.
Wrote 500 rows and output 74 columns in the CSV.
Now that we have the csv of the data, we can use a python pandas command to get the data into a dataframe.
ucsblib_timeline_df = pd.read_csv("output/ucsblib_timeline.csv")

#outputs first 5 lines in dataframe
ucsblib_timeline_df.head()
#outputs last 5 lines in dataframe
ucsblib_timeline_df.tail()
Use wc to get a count of tweets. Did we get a reasonable amount?
Let’s remind ourselves of some of the different things that come along with a tweet by printing out a list of the dataframe headers:
#outputs first 5 columns
ucsblib_timeline_df.columns[:5]
Index(['id', 'conversation_id', 'referenced_tweets.replied_to.id',
       'referenced_tweets.retweeted.id', 'referenced_tweets.quoted.id'],
      dtype='object')
We can see some of the column headers here. Looking through these column headers, we can see what data information we may look into. For example:
The column ‘public_metrics.retweet_count’ provides a total count of retweets for each tweet.
#grab only specified column
ucsblib_timeline_df['public_metrics.retweet_count']
By using the Python function .sort_values(), we can sort the dataframe
in order of Retweet counts. That’s a measure of how much impact that tweet
had online.
sort_by_rt = ucsblib_timeline_df.sort_values('public_metrics.retweet_count', ascending=False)

#the first tweet from the sorted dataframe
most_rt = sort_by_rt.head(1)

#output only the text of the tweet
most_rt['text']
You may also get the tweet id to view the tweet on Twitter: https://twitter.com/UCSBLibrary/status/tweet_id
Another metric is how many times a tweet has been ‘retweeted with quote’, by looking at the column “public_metrics.quote_count”:
sort_by_qc = ucsblib_timeline_df.sort_values("public_metrics.quote_count", ascending=False)

#the first tweet from the sorted dataframe
most_quoted = sort_by_qc.head(1)

#output only the text of the tweet
most_quoted['text']
It takes a bit more effort to retweet-with-quote rather than just pushing the Retweet button, so these can be considered more impactful.
Finally, you can see who the most impactful author is in your dataset by looking at “author.public_metrics.followers_count”. For timelines, this will look at both @UCSBlibrary and any accounts @UCSBlibrary retweeted from in the timeline we collected.
sort_by_fol = ucsblib_timeline_df.sort_values('author.public_metrics.followers_count', ascending=False)

#the first tweet from the sorted dataframe
most_fol = sort_by_fol.head(1)

#output only the id of the tweet
most_fol['id']
Challenge: Hashtag Cats of Instagram
Let’s get a reasonably sized dataset to use for the remainder of the workshop. Harvest 500 tweets that use the hashtag “catsofinstagram” and put the dataset through our pipeline (harvest > flatten > csv > dataframe) to answer the following questions:
- Did you get exactly 500 tweets?
- How far back in time did you get?
- What is the most re-tweeted tweet from our search?
- Which person has the most number of followers in your dataset?
Solution
!twarc2 search --limit 500 "#catsofinstagram" raw/catsofinstagram.jsonl
- Let’s start by converting our dataset to a csv, then run some python
!twarc2 csv raw/catsofinstagram.jsonl output/catsofinstagram.csvRead in csv using pandas. Pandas is denoted by pd.
cats_df = pd.read_csv("output/catsofinstagram.csv")We are able to see how many tweets we get by getting the dimensions of the dataframe or with
wc. The number of rows indicate the number of unique tweets. The dumber of columns indicate the amount of data that came with each tweet.cats_df.shape
- Look at the earliest value under the column ‘created_at’. Technically, you don’t have to sort this, since tweets arrive chronologically.
earliest_create = cats_df.sort_values('created_at', ascending = True).head(1)
earliest_create['created_at']
3.
most_rt = cats_df.sort_values('public_metrics.retweet_count', ascending = False).head(1)

most_rt['text']
4.
most_fol = cats_df.sort_values('author.public_metrics.followers_count', ascending = False).head(1)
most_fol['id']
User with author_id 248757990 has the most followers, which is 2086382.
We can then get the information on the user.
!twarc2 user id 248757990
Key Points
There are many online sources of Twitter data
Utilities and plugins come with twarc to help us out
A consistant ‘harvest > convert > examine’ pipeline will help us work with our data
Ethics and Twitter
Overview
Teaching: 30 min
Exercises: 20 minQuestions
Can I avoid seeing hate speech and unsettling imagery and still analyze twitter?
What are some privacy or other ethical issues that you need to keep in mind when harvesting tweets with twarc?
How much personal information can we actually gather about a user given our twarc scrape?
What are some use cases that might be inappropriate?
Objectives
Let’s Get Ethical
There are multiple ethical issues to consider when using Twitter data. In this lesson, we will be focusing on #FIXME issues: authorship, privacy, and consent. Ultimately, all three concern personhood.
Authorship, the GDPR, and the Right to be Forgotten
Twitter users maintain ownership of their tweets. As the author, users have both copyrights and moral rights. (Only the former is defined in the United States.)
Copyrights prevent your tweets from being compiled together into a publication for profit. That said, some authors do not have any copyrights. For example, POTUS is an American government employee, therefore that ‘property’ is in the Public Domain.
Laws vary greatly by country, so don’t get American librarians started on the Queen’s copyrights over Canadian government data, which is complicated.
Moral rights are more complicated. Laws vary greatly by country–even moreso than copyright. In the European Union, authorship includes the right to un-publish, in other words, the right to be forgotten. Twitter, very cleverly, preserves this right by letting us delete our tweets.
Personally Identifiable Data
It’s very easy to match up data to a human being. Conversely, it is very difficult to remove something from the Internet once it is there. The European Union has created the General Data Protection Regulation to protect people’s identities as well as to respect the privacy rights of “natural persons” (as distinct from public figures and corporations).
The GDPR defines Personal Data as:
What is Personal Data?
Personal data are any information which are related to an identified or identifiable natural person.
The data subjects are identifiable if they can be directly or indirectly identified, especially by reference to an identifier such as a name, an identification number, location data, an online identifier or one of several special characteristics, which expresses the physical, physiological, genetic, mental, commercial, cultural or social identity of these natural persons…
Citation: “EUR-Lex – 32016R0679 – EN – EUR-Lex”. eur-lex.europa.eu.
Discussion: Personal Data
- Do you think that Twitter data should be treated as personal data?
- What did you consider when making this judgment?
- Are robots people?
- Do the blue checkmark people deserve privacy?
Considerations
We get a lot of personal information when we gather tweets. We can often determine a user’s approximate location, what they like, their beliefs, etc.
Even though some people treat Twitter like a diary, even though it is a public space, researchers still need to respect their personhood.
As scholars, we also have an obligation to treat this information carefuly. Both at the granular, individual level, and at the dataset level.
The first few minutes of this standup comedy routine shows the hazards of sharing too much personal information on social media
Protecting yourself
Distance Reading
Researching tweets on Twitter may expose you to hate speech, and possibly disturbing imagery. Fortunately, when we work with thousands of tweets at a time, we do so at a distance, so we can avoid consuming disturbing content directly.
The first step in distance reading is to get at the language–the actual tweets.
Wordcounts with Textblob
Looking at the most commonly used words and phrases in a dataset is a text analysis practice. This helps us to get a sense of what we are dealing with in our dataset.
In Text Data Mining, a complete list of words and their frequency of appearance can be called a “concordance.” We would consider texts of the tweets themseves to be the corpus. Everything else is metadata.
We will use the TextBlob package for our full-text analyses, including getting a word count. The most used words in your dataset can be used to judge the tone of the overall content without needing to wade through thousands of tweets.
Let’s remind ourselves what dataframes we have available to work with:
# %who DataFrame
ecodatasci_df	 hashtag_gasprices_df	 hashtagcats_df
kittens_df	 library_timeline_df	 riots_dehydrated_df
ucsb_library_mentions_df
And let’s remind ourselves which column we need
library_timeline_df.columns
hashtagcats_df['text'].head()
So that’s the column to pull data into a python list:
list_tweets = hashtagcats_df['text'].tolist()
Next, we use the python join function to insert spaces between words and
make this list into one long string of text.
string_tweets = ' '.join(list_tweets)
All this was to get our tweets into a string because TextBlob has its own data
format, so we needed a string to pass to textblob. The function TextBlob converts the
string of tweets to a textblob.
library_blob = TextBlob(string_tweets)
Now that we have our TextBlob, we can count and sort it. We do this using the
python function word_counts and sorted.
library_freq = library_blob.word_counts
library_sorted_freq = sorted(library_freq.items(),
	key = lambda kv: kv[1], reverse = True)
print(library_sorted_freq)
This shows a lot of text with no meaning though. To help with this, we can get rid of
English stop words, like all the a’s, and’s, and the’s. nltk, which got installed
along with textblob, has its own corpus of stopwords we can use:
# load the stopwords to use:
from nltk.corpus import stopwords

# sw_nltk is our dictionary of stopwords
sw_nltk = stopwords.words('english')
# create a new object without the stopwords
library_blob_stopped = textblob.TextBlob(library_words_stopped)
library_blob_stopped_freq = library_blob_stopped.word_counts
library_blob_stopped_sorted_freq = sorted(library_blob_stopped_freq.items(),
                             key = lambda kv: kv[1],
                             reverse = True)
library_blob_stopped_sorted_freq[1:50]
Lastly, we want to cut off the most used, which are http, ucsb, etc.
library_blob_stopped_sorted_freq[7:57]
[('new', 288),
 ('today', 250),
 ('us', 232),
 ('’', 228),
 ('book', 218),
 ('research', 212),
 ('here', 210),
 ('students', 195),
 ('reads', 189),
 ('open', 187),
 ('we', 178),
 ('check', 177),
 ('join', 164),
 ('week', 161),
 ('floor', 145),
 ('day', 143),
 ('free', 139),
 ('collections', 138),
 ('access', 136),
 ('art', 127),
 ...
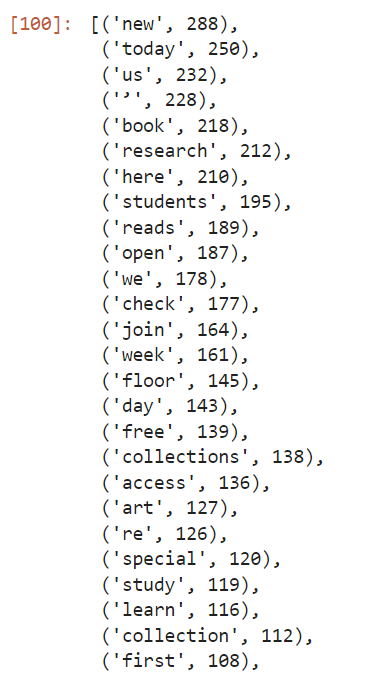
Our results make sense. We can see that the words are associated with library-like things. This text is worth some further examination.
If we were expecting hate speech, this is where we would start to see it. If some of the top words are inflammatory, we can bet that the content of the whole datset will make some squeamish.
A more sophisticated text analysis would include passing this through another filter to remove the one and two letter words and the URL’s.
There are also functions to pull phrases out of text corpuses, which is one form of what is called tokenization.
Disinformation
Twitter already removes a lot of violent and obscene content, but it does pride itself on being a free speech platform. Mainly, Twitter removes content that violates its Terms of Use. In some countries some content might be downright illegal and Twitter would be obliged to delete it or otherwise restrict access to it. Sometimes this means removing entire accounts, such as that of the former US President and many of his associates.
Misinformation
Nature disinformation cloud
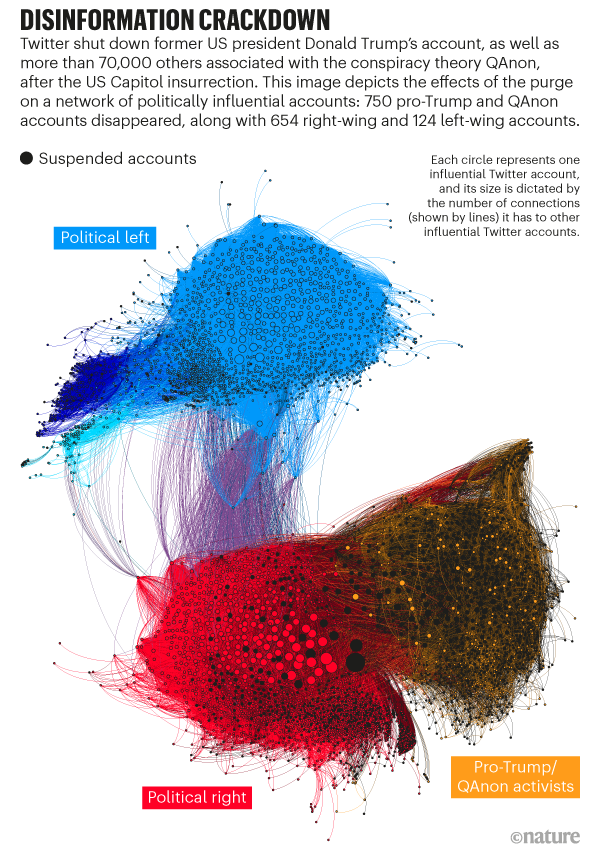
Speaking of which, let’s see how much data from January 6th, 2021 is still available.
Challenge: January 6 Insurrectionists
After the US Capitol riot, a user on kaggle captured 80,000 Tweets from people associated with that day’s events, concentrating on accounts from those protesting / rioting.
This kaggle user, in the public interest, stored the full content of these Tweets as a .csv. The best practice would be to save only a dehydrated set of tweets. However, in this instance, we can use this person’s conscientious objection to social norms and Twitter’s Terms-of-Service to ask whether or not any of this is in the public good or an acceptable topic of research.
Using the file dehydrated_Capitol_Rioters.txt, determine how many Tweets were in the archive, and how many remain on Mr. Musk’s new acquisition.
Solution
When we first ran this, only a tiny fraction of the tweets remained. But more recently, we noticed that about 80% gets rehydrated. We suspect that Twitter has restored some of this content.
New Challenge???
That riot file is too big to work with on the fly. We need something a bit different. First thought is to give a list of accounts and see who is still online?
Second thought: there’s 58135 users in the rehydrated file. But they are mostly retweets. By getting out the users quoted, we can see that there’s many fewer original authors. How few? #FIXME
Chop the dataset to be the first 10,000 lines:
! head -n 10000 output/riots_flat.jsonl > output/riots10k.jsonl
! twarc2 csv output/riots10k.jsonl > output/riots10k.csv
Sort our 10,000 by account created date. New accounts can have a SH-A tag applied to them.
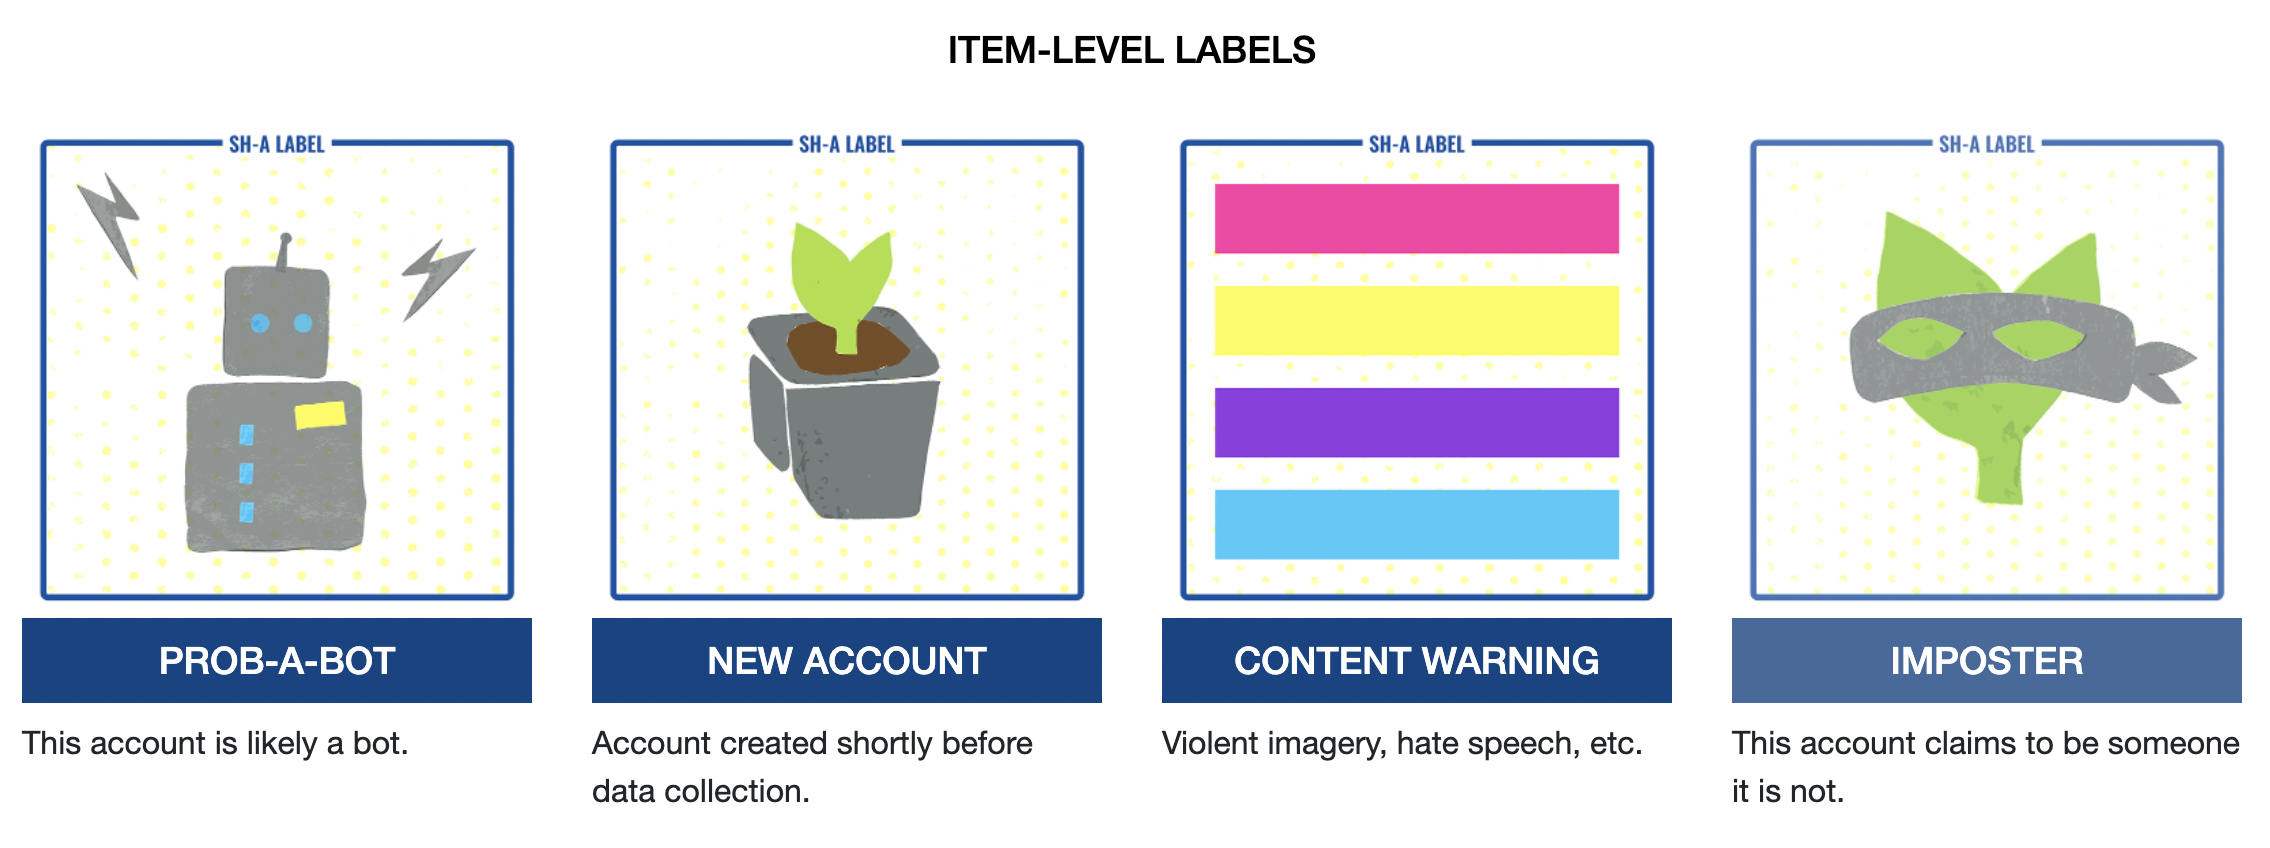
Social Humans and robots
Documenting the Now has released a classification scheme to apply to Twitter accounts. We can apply these ‘Social Humans’ labels to individual Tweets and/or accounts to identify bots, trolls, and malicious actors.
Adding a column to our dataframe and classifying tweets according to what sort of entity we think posted them is a very useful flavor of analysis
code to add a column to the list of authors we pulled above?
Key Points
Search and Stream
Overview
Teaching: 15 min
Exercises: 10 minQuestions
How can we specify what Tweets to collect?
How can we collect Tweets as they are posted?
Objectives
Search vs Stream
Twarc Search Command
Returns tweets posted during the past 7 days that match a given query. We can put in more than just one word, but for now let’s stick with a previous one-word search.
Earlier we searched for 500 posts for #catsofinstagram. Now let’s look for 2000.
Let’s make a new cell in our Notebook and run a search command. Remember that we need to
specify an output file. It is optional to use the > sign to signify the output file.
!twarc2 search --limit 2000 "(#catsofinstagram)" hashtag_cats.jsonl
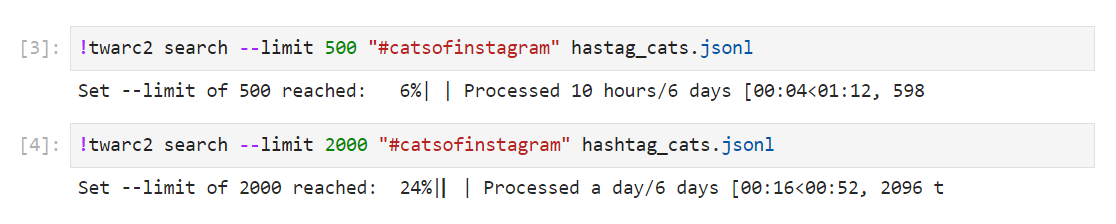
This command will search for any recent tweets that contain #catsofinstagram. Twarc tells me that I hit my limit of 2000 after checking back in after a few minutes. If we had not limited our search and allowed twarc to gather 6-days’ worth of tweets, we would have used our entire download quota for the month.
We can use the visual indicator to confirm the limit of our second search. We may also open the file and see if we have something less than 2,000 tweets or 6 days worth. For this hashtag, you will probably hit your limit.
If you want to go back as far in time as the Twitter API allows (6 days
typically), and NOT eat up too much of your monthly quota, you can simultaneously
tighten up your search parameters and keep your --limit value low.
!twarc2 search --limit 500 "(#catsofinstagram #cute)" > hashtag_cats_500.jsonl
This adjusted search for tweets with BOTH of these hashtags, returns 5 out of six days. So asking for 800 Tweets should get me six days’ worth of results.
!twarc2 search --limit 800 "(#catsofinstagram #cute)" > hashtag_cats_800.jsonl
In this way we can ‘sip’ at our quota and make sure we can work within the 500,000 tweet limit.
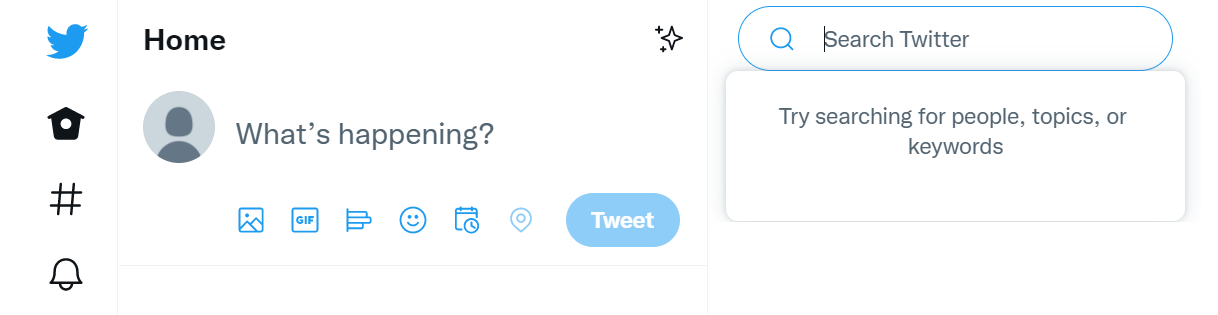
Twitter Search
Twitter let’s us get much more specific (or broad, if we want) with our searches. twarc search command uses the same search syntax as the search bar on your Twitter home page
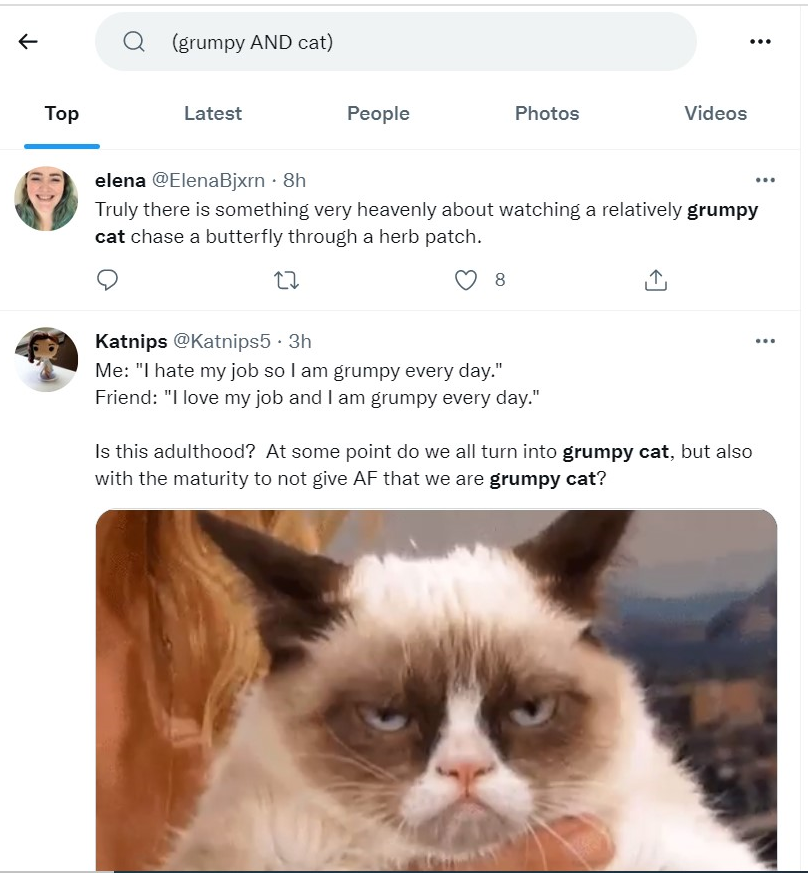
We will demonstrate some options you may use when searching tweets in both the Twitter search bar and through the Twarc search command. First, you may search tweets for content that contains certain words. In the example image below, we search for tweets about Grumpy Cat.
AND logic
In the Twitter search bar, using all-caps AND will return tweets containing
grumpy and cat.
Successive operators with a space between them will also result in boolean AND logic.
Words separated by a space will return tweets matching both conditions. In the
example below, this search will return tweets containing grumpy and cat
!twarc2 search "(grumpy cat)"
OR Logic
To search for tweets that contain either word, and not require both words, the search bar and Twarc will
use a capitalized OR instead. This will return results if either search condition is met.
In this case, the terms, grumpy or cat.
That same syntax holds for twarc2:
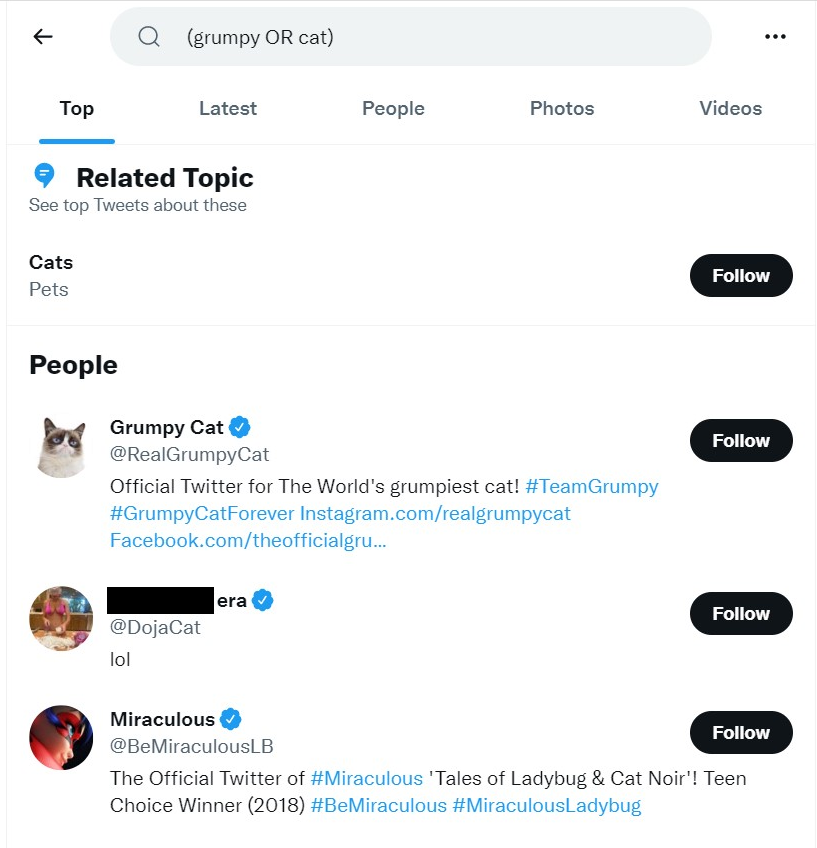
!twarc2 search "(grumpy OR cat)"
Not Logic
add a dash(-) to a keyword or operator to negate it (NOT). This works in both the twitter search bar and in twarc. This will match tweets containing the terms grumpy ORor cat, AND omit anything about Doja Cat.
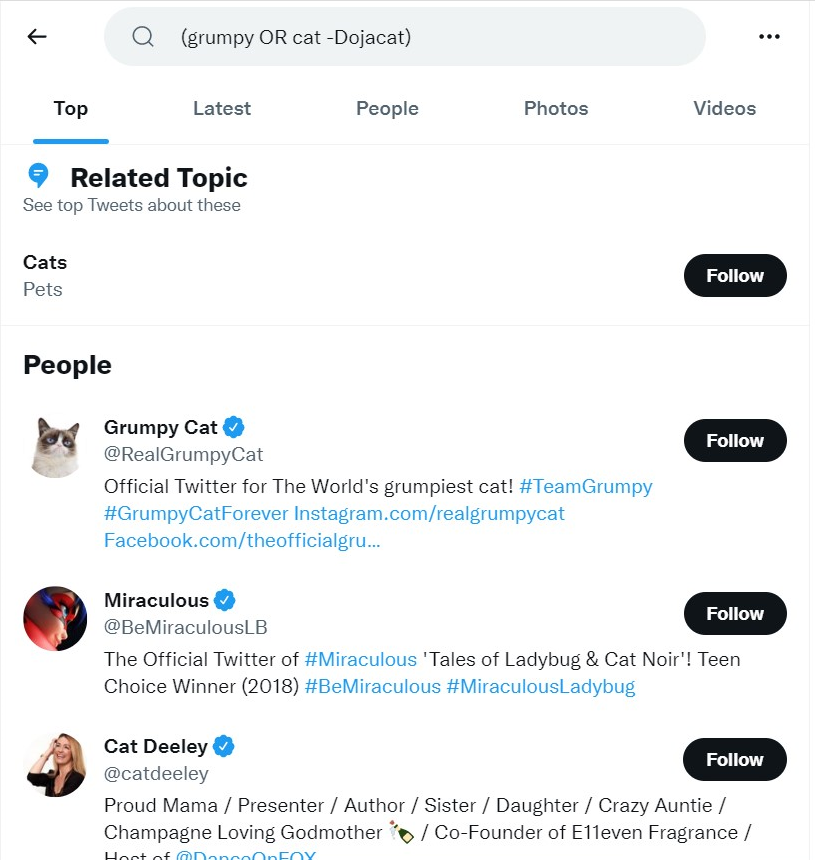
!twarc2 search "(grumpy OR cat -Dojacat)"
Note that this searches for all tweets that contain the string cat
but NOT those containing DojaCat, PLUS all the tweets that contain
the word grumpy.
So you should get all the grumpy cats except for DojaCat.
Searching for Mentions of Users (@’ing)
The Twitter search and Twarc search command also supports looking for tweets that mention a specified twitter account (mentioning another Twitter account in a tweet is known as “at-ing/ @-ing” or “tagging”). In the below example, Jon @-ed the Twitter account @ucsblibrary.
Note that capitalization for the account name does not affect the search. Also, including the “@” symbol in front of the account name does not work, the search explicitly spells out the “to:” instead.
to: will match any tweet that is a reply to a partricular user. This can be the
username or the numeric user ID. You can only pass a single username/ID per to:
command.
!twarc2 search "(to:realgrumpycat)"
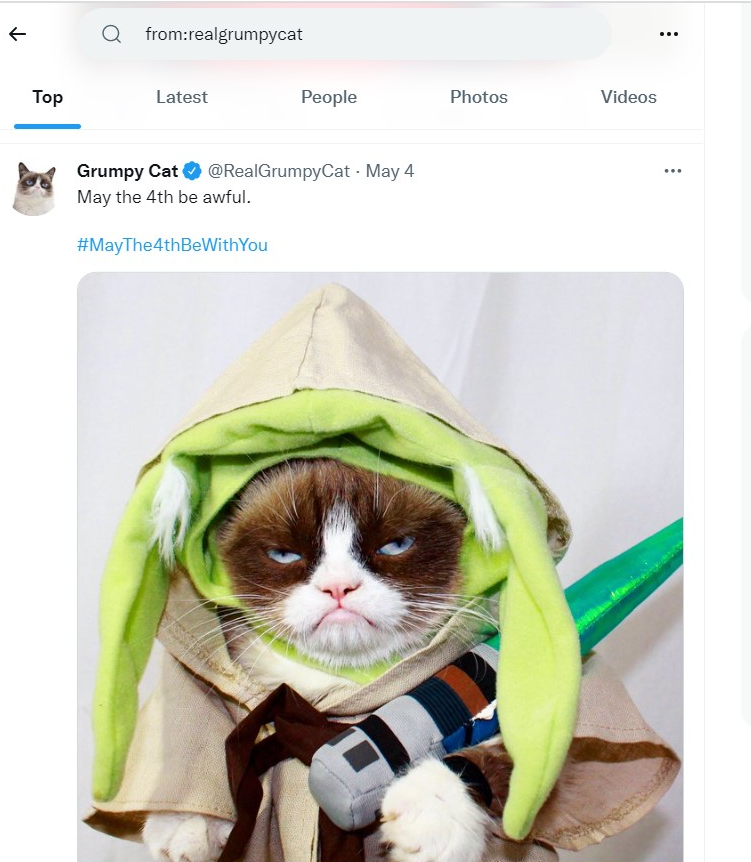
from: will match any tweet from a specific user. Like to:, this can be a username or numeric user ID.
!twarc2 search "(from:realgrumpycat)"
Using Hashtags
As we have seen before, we may also search tweets that contain hastags. In the example below, notice that the resulting tweet also contains other hashtags that we did not explicitly search for.

!twarc2 search "(#meme)"
Order of Operations
We have seen individual searches of each of these parameters. You may also combine these parameters to narrow down your results. When combining boolean functions the following order of operations will dictate how your query is evaluated.
- Operators connected by
ANDlogic are combined first - Operators connected by
ORlogic are combined after
For Example, internet cats Cole and Marmalade:
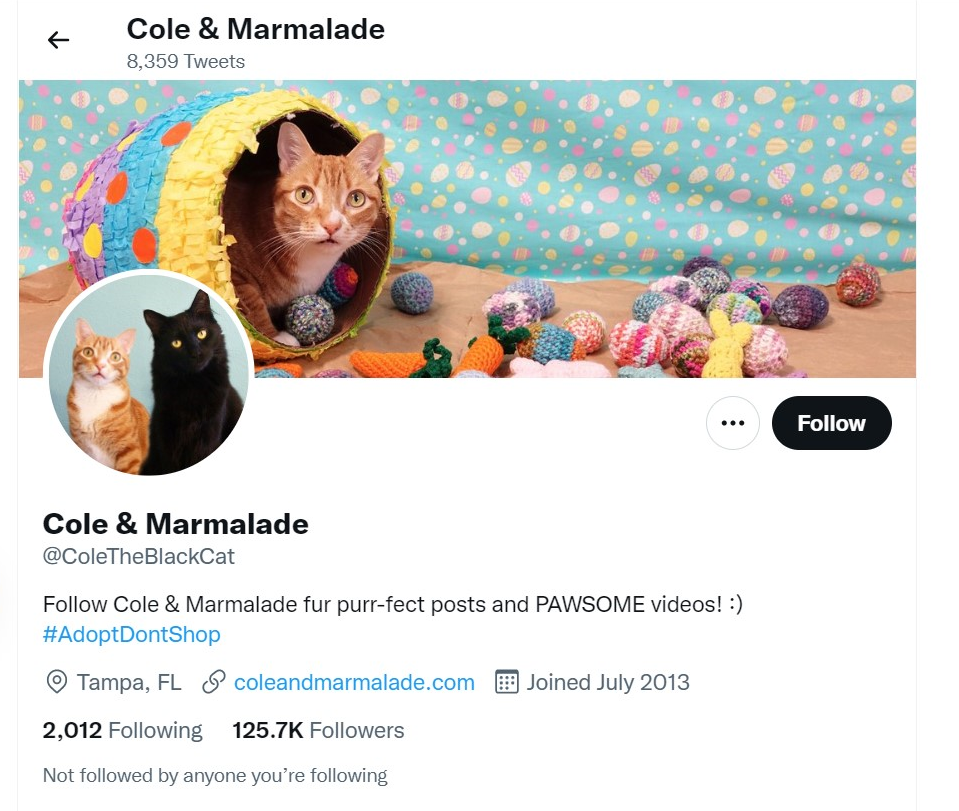
cats OR cole marmaladewould be evaluated ascats OR (cole marmalade)cats cole OR marmaladewould be evaluated as(cats cole) OR marmalade
To eliminate uncertainty, you can use parentheses to group terms together where appropriate. With Cole and Marmalade
(cats or cole) marmaladewhich would probably throw out cats, some guy named Cole, and orange preservativescats (cole marmalade)which would be closer to our internet cats
Grouping by using () to group terms and operators together in this way.
Challenge: Advanced Twarc Search
What resulting tweet(s) do you get from the following Twarc searches?
!twarc2 search "(grumpy cat #meme)"

!twarc2 search "(grumpy cat) OR (#meme has:images)"

!twarc2 search "(cats OR puppies) has:media"

!twarc2 search "(to:_We_Rate_Cats) lang:en"
Can you think of interesting search parameters for tweets? If so, use Twitter search or Twarc search to try them out.
Twarc Stream Command
You may also collect tweets as they are posted, and establish rules to what tweets will be collected (as you did for setting search parameters). To start with a stream, you set some tweet parameters or rules:
You may want to see ‘what’s trending’ on Twitter to make sure you get a good number of results here.
!twarc2 stream-rules add "#catsofinstagram"
🚀 Added rule for "#catsofinstagram"
!twarc2 stream-rules add "fluffy"
🚀 Added rule for "fluffy"
To see what your current stream rules are, you may list them:
!twarc2 stream-rules list
☑  #catsofinstagram
☑  fluffy
You may stream tweets that contain words and hashtags like we had done in Twarc search. We cannot use a username to stream tweets that mention another Twitter account:
!twarc2 stream-rules add "at:_We_Rate_Cats"
💣 UnprocessableEntity see: https://api.twitter.com/2/problems/invalid-rules
When you start collecting tweets with the rules you have set in place, you must create the file that the data will be stored in:
!twarc2 stream > "raw/streamed_tweets.jsonl"
Once this command is run, you will collect tweets that match the rules set in place.
This collection will be ongoing unless you explicitly shut down the stream by
interrupting the kernel (in Jupyter) or by typing a ctrl + c (from the console). While
this stops the stream collection, it does not remove the stream-rules.
Before running a new stream, don’t foreget to
remove the rules you had set in place. Use stream-rules delete:
!twarc2 stream-rules delete "#catsofinstagram"
!twarc2 stream-rules delete "fluffy"
Discuss: Search vs Stream
We had an introductory look at the use of the search command and the stream command. Please brainstorm what the difference(s) are between searching tweets and streaming tweets. When might you choose stream over search? How can you use them together?
Here is more information about using Twitter search syntax.
Our twitter guide gives advice about how to follow a real-time event, like pending #scotus decisions.
Key Points
Search: collect pre-existing tweets that satisfy parameters
Stream: collect Tweets that satisfy parameters, as they are posted
Plugins and Searches
Overview
Teaching: 20 min
Exercises: 10 minQuestions
What other harvests are available?
Are there more twarc2 plugins?
How can I separate original content from retweets/replies?
Objectives
Other Harvests
Retweets
Twarc2 has commands to retrieve entire conversation threads, as well as the retweets of one or more tweets. Recall that a retweet is when a Twitter account shares the Tweet of a different Twitter account.
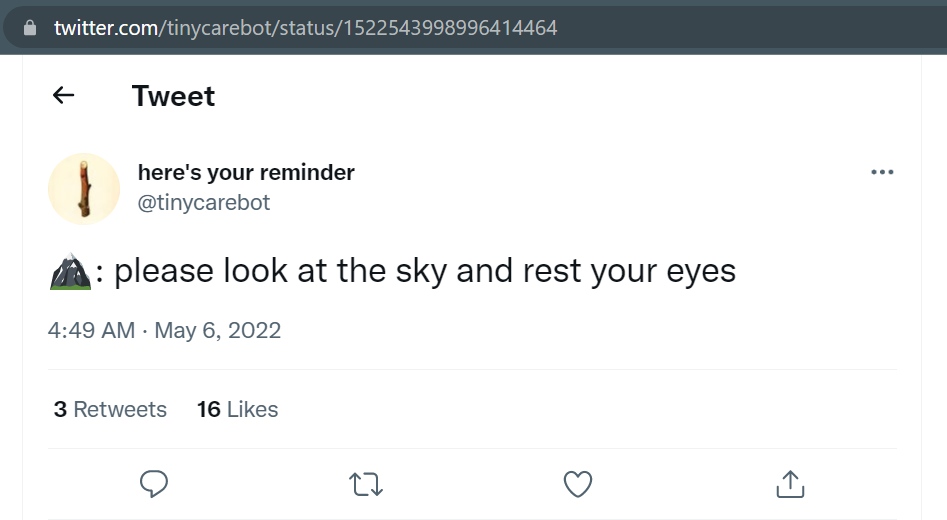
This tweet has three retweets. We can harvest them using the tweetID, which you can see in the url of the tweet. In this case, the tweet’s ID is 1522543998996414464.
!twarc2 retweeted-by 1522543998996414464 > 'raw/tinycarebot_rtby.jsonl'
This gives us the profiles of the three twitter accounts. #FIXME: what does a profile look like? From there we can go on to harvest their timelines to see what they are up to.
Followers
Not only can we see everyone who has retweeted another tweet, we can also find all the followers of a given account.
@tinycarebot is very popular, so let’s get just a few of their followers. The limiter here is counted in thousands, so we are getting 1000 of @tinycarebot’s followers:
!twarc2 followers --limit 1 tinycarebot > 'raw/tcb_followers.jsonl'
Challenge: Do robots follow robots?
Take a look at the first bunch of user profiles we just downloaded. Do you think that any of them might be robots? You should flatten the file. And we can’t make a csv of this one because csv only works on tweets, not users.
Solution
!twarc2 csv 'raw/tcb_followers.jsonl' > 'output/tcb_followers.csv'Convert the 5 profile files into a csv and read them You might also need to copy-and-paste the user-id into the Twitter web interface and take a look at the media that comes along. #FIXME more detail for this solution
How much original content?
You might be surprised by how much of your dataset consists purely of retweets– people pushing that one button and not doing anything else.
We can use a little bit of python to calculate the proportion:
retweet_count = hashtagcats_df["referenced_tweets.retweeted.id"].value_counts()
sum(retweet_count)

(sum(retweet_count) / len(hashtagcats_df))
This is such a useful measure that we often calculate this value as part of our initial workflow.
Challenge
How much of Bergis Jules timeline is original content? How about the UCSB Library’s timeline?
twarc2 Plug-ins
When we have thousands of tweets, there’s some obvious tasks that we can do to get a grip on them. Anticipating those tasks, Doc the Now has created twarc2 plugins to help get this work done.
twarc2 plug-ins, like csv that we did earlier, need to be installed separately. In this episode, we will look at twarc-hashtags and twarc-network
First you need to pip install in BASH
!pip install twarc-hashtags
!pip install twarc-network
Most seen hashtags
The hashtag plugin takes a twitter dataset and pulls out all of the
hashtags that were used. As a reality check, when we run hashtags on our hashtagcats.jsonl
dataset, we should see the hashtag
we searched for first. Our other results make sense as well. We see a lot of dogs and Japanese
cropping up. (In case you didn’t know it, Internet cats are huge in Japan.)
Top hashtags
!twarc2 hashtags 'raw/hashtagcats.jsonl' > 'output/hashtagcats_hashtag_counts.csv'
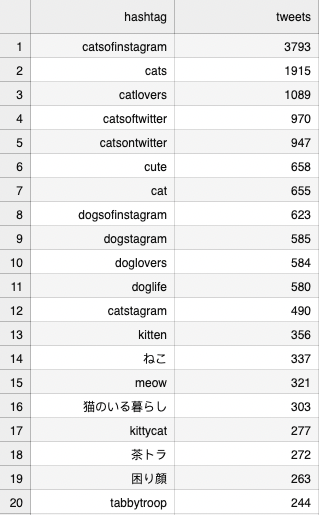
Challenge: Look for surprises
Run the hashtags plug-in on the @tinycarebot dataset.
Are there tags that surprised you? Look at that individual tweet and figure out if that context helps you understand why that unanticipated hashtag is there.
Solution
I looked at people who mentioned UCSB Library.
!twarc2 hashtags output/ #FIXME 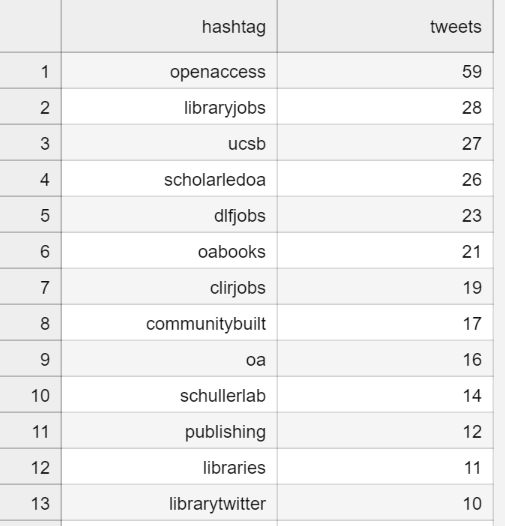#FIXME what sort of challenge can we have? library mentions got nuked because nobody tweets @at the library
Network Graphs
We call network the same way we called hashtags
!twarc2 network 'raw/hashtagcats.jsonl' > 'output/hashtagcats_network.html'
The built-in web viewer ain’t so hot, so download that html file to view the network on your own computer. Chrome works fine, and it’s best to make the diagram fullscreen. It mseems to work better on a PC than a mac. We can see:
- the largest central cluster around the account @catsofinstagram
- a corporate entity (a litter box company?) shows up,
-
some users of the hashtag are separate from the account’s network.
- neighborhoods of users exist, such as those around kiko1123215 in the image below. Kiko is nearby, but separate from, the @catsofinstagram twitter account.
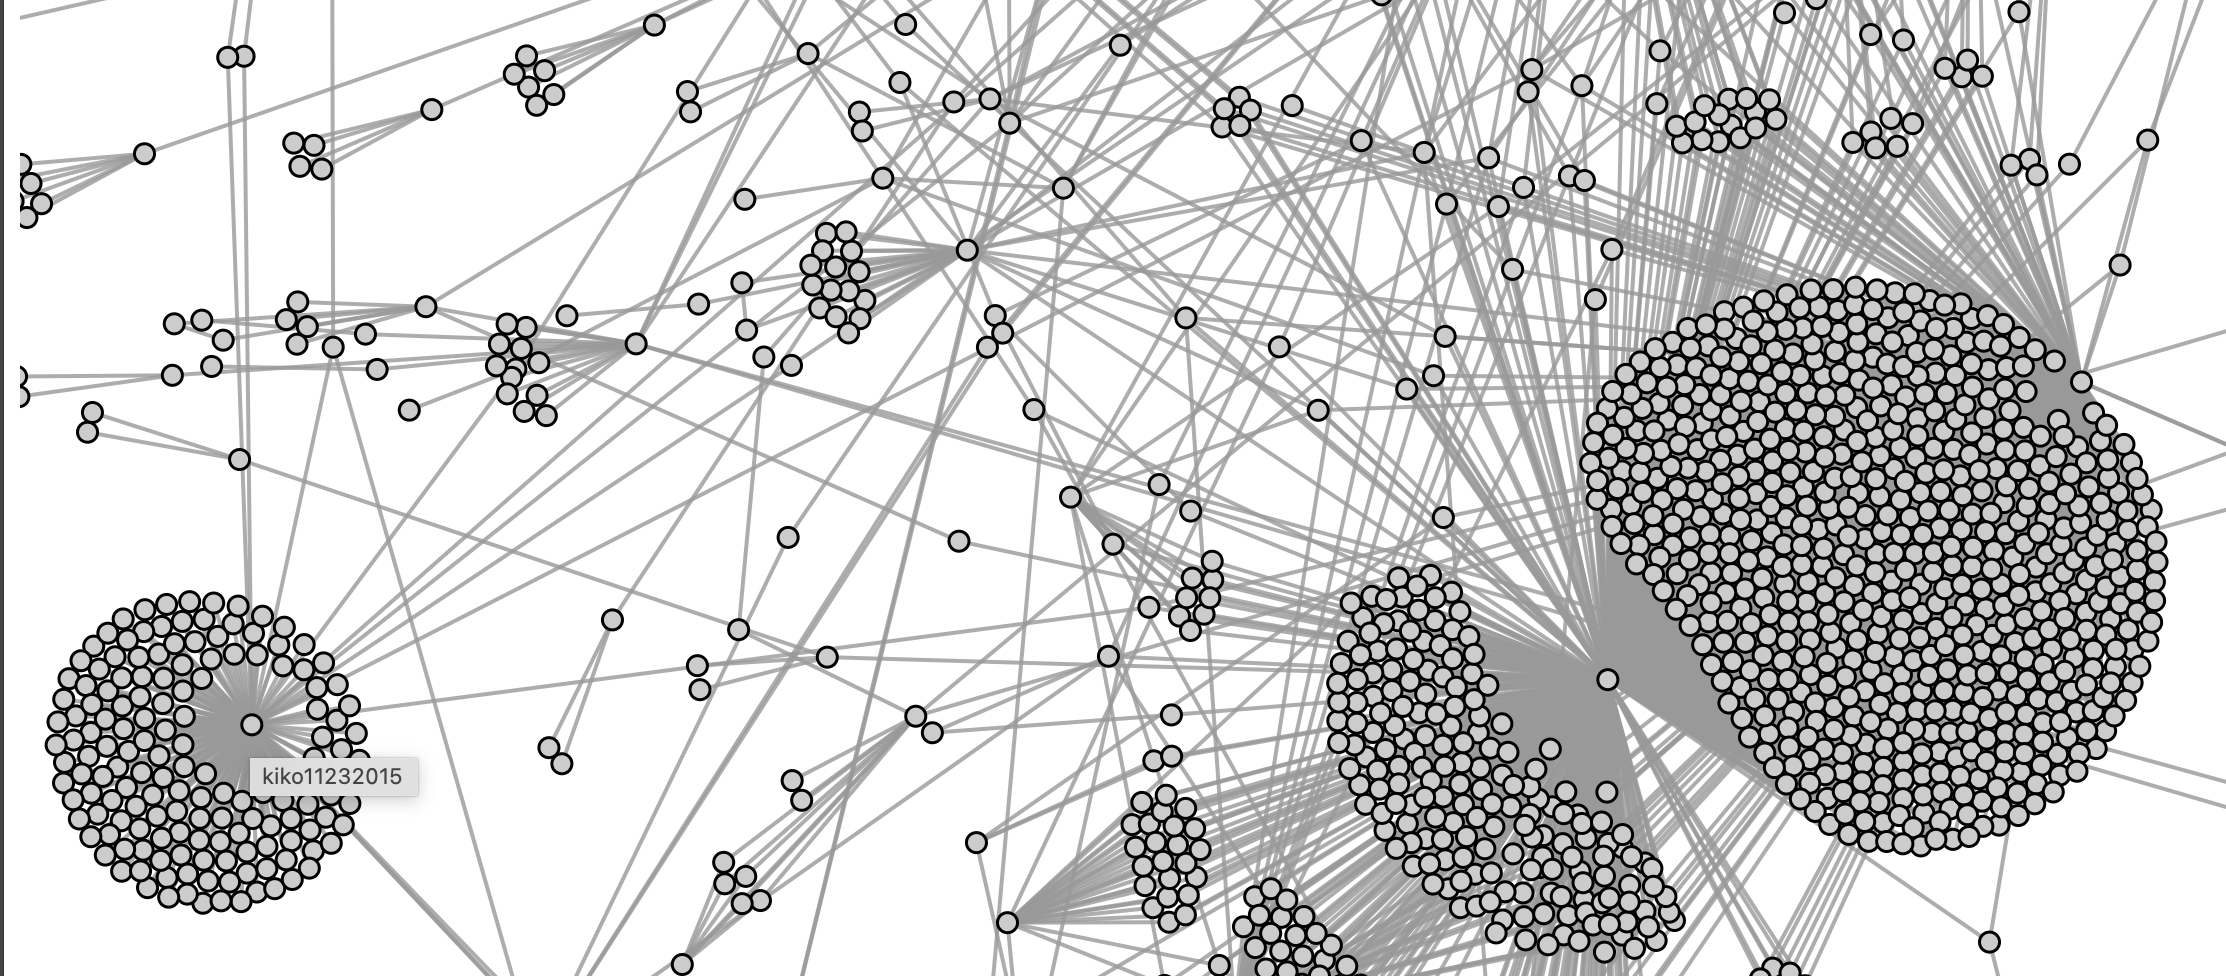
Challenge: Can you make a network from a timeline?
Create a network diagram of Bergis Jules’s timeline. How is this different than the #catsofinstagram dataset? How does this affect the look of the graph?
Solution
Because this is a timeline, the network is completely one-dimensional. We think any timeline would look like this. Try another timeline to prove us wrong.
!twarc2 network 'raw/bjules_timeline.jsonl' > 'output/bjules_network.html'
Key Points
twarc2 has plug-ins that need separate installation
The network plug-in shows us how tweeters are related to each other
TextBlob Sentiment Analysis
Overview
Teaching: 30 min
Exercises: 20 minQuestions
How can I analyze my tweets beyond what twarc offers?
Is it possible to tell if tweets are expressing positive or negative feelings?
Objectives
Sentiment analysis measures the ‘positivity’ or ‘negativity’ of language
Where We’ve Been: twarc Built-ins
We have looked at the hashtags in a dataset, the proportions of tweets to retweets, and the networks of users created by a tweet-stream. But what about content of the tweets? For that we need some textual analysis, and so far all we’ve done is count words.
Sentiment Analysis with TextBlob
TextBlob is a Python library that does all sorts of text processing, including sentiment analysis.
One type of sentiment analysis is to calculate
the overall
positivity or negativity of a text corpus. There are a variety
of algorythms and scales. TextBlob’s default .sentiment
function rates an input text as negative or positive on a
scale of -1 to 1.
The sentiment function returns two numbers in the form of a named tuple:
Sentiment(polarity, subjectivity).
The polarity score is a float within the range [-1.0, 1.0]. Subjectivity is a float within the range [0.0, 1.0] where 0.0 is very objective (ie: does not express strong sentiment) and 1.0 is very subjective.
Before we can do any sentiment analysis, we need to download the linguistic datasets that TextBlob uses in its analyses:
!python -m textblob.download_corpora
We need to feed TextBlob something like plain text. Therefore, we need to create a text object from the tweets in our dataframe.
That column is named text, we pull that
out of our dataframe and convert it to a list. Then we can
convert the list into one long string.
TextBlob wants to get fed a string, so we will give it a string and convert that string into a blob. Then we send the blob through TextBlob’s sentiment method.
We can do this all in one cell, or one cell at a time to make sure we don’t have any mistakes.
# break tweets text column into a list,
# then .join into one long string
hashtagcats_list = ' '.join(hashtagcats_df['text'].tolist())
# turn the string into a blob
hashtagcats_blob = textblob.TextBlob(hashtagcats_list)
# get the sentiment
hashtagcats_blob.sentiment
Sentiment(polarity=0.2378257657037288,
subjectivity=0.6328352645350159) ~~~
The overall sentiment of the language of Cat Twitter is rather positive. And the tweets tend to be subjective.
There’s a ton of other analyses and chunking functions in textblob. (Read the docs)[https://textblob.readthedocs.io/en/dev/quickstart.html].
Challenge: Anticipating Sentiment
Write Python code that outputs sentiment values for three of your dataframes. When you output the three values, arrange them in what you guess will be the least positive to most positive sentiment.
Please label your output. The syntax to pass output into the results cell is
print("String in here ").Remember, you need to pass TextBlob a string. A list will work:
your_data_list = ' '.join(your_data_df['text'].tolist())
your_data_blob = textblob.TextBlob(your_data_list)
Solution
I’m going to guess that all my datasets are going to be pretty subjective. Except for maybe ecodatascience.
My anticipated sentiment order:
- capitol riots
- gas prices
- the UCSB Library timeline
- ecodatascience timeline
- #catsofinstagram search
- fluffy #catsofinstagram search
This is one possible code block for our #catsofinstagram dataset:
hashtagcats_list = ' '.join(hashtagcats_df['text'].tolist())
hashtagcats_blob = textblob.TextBlob(hashtagcats_list)
print("Hashtag Cats of Instagram: ")
hashtagcats_blob.sentiment
Can we do anything with the emojis?
Examine Emojis as a proxy measurement of qualitative emotional content. ie: you can visually see sentiment in emojis.
We still need code to isolate emojis #FIXME
They are emotional icons. #FIXME
Key Points
TextBlob has a bunch of functions that we should learn
Data Management
Overview
Teaching: 10 min
Exercises: 5 minQuestions
What are some best practices for handling our data ‘for the long term’?
Objectives
Twitter has a Terms of Service for data
Long-term storage of id-only datasets is a good method
Now What?
You have gathered timelines on individuals going back years.
You have harvested data from the Twitter livestream and searched back over the previous six days.
You have determined the relative sentiment of several different Twitter datasets, examined the top hashtags, the most frequently used words, and the proportion of tweets to retweets.
You made network diagrams!
Now it’s time to wrap up your data for long-term storage. But how?
Twitter’s TOS and the EU’s GDPR
Twitter the corporation allows users to delete (but currently not edit) their own content. And when the European Union created its General Data Protection Regulations, it enshrined in law the ‘right to be forgotten.’
And so, to respect Twitter’s Terms of Service as well as what is widely considered to be a human right, the best practice is to dispose of your full-data tweets and leave only the tweetID’s and the end results of your analyses.
We explored the opposite of this idea earlier in (Ethics and Twitter)[05-ethics] when we hydrated tweets that had been collected after a serous event. We found that many of the malicious actors and bots are no longer available in the Twitter archive.
However, when we do our research, unless perhaps we are specifically looking only at non-person actors or public figures, when our research is complete we should always dehydrate our dataset for long-term archiving, or before we share data with people outside of our immediate research team.
! twarc2 dehydrate raw/hashtagcats.jsonl output/dehydrated_cats.txt
Challenge: hydrated or de-hydrated?
Was making you log-in to get full-text gas-price tweets a good enough protection for our #gasprices dataset?
Which of our datasets would you feel comfortable creating an official, UCSB-sponsored archive?
- Bergis Jules’ timeline?
- Library mentions?
- Library timeline?
- full text Capitol riots tweets?
- #catsofinstagram?
Solution
you decide!
DocNow’s new tool for consent.
DocNow released a new tool that allows for the appraising, collecting, and gathering of consent for social media archives.
User Content, Re-use, and Consent Twitter users have various options of privacy over their content and profile. Some of these options include that their profiles do not show up in web searches and that their content is hidden only to followers. While these options are available to users, it does not have any retroactive effect on what has already been collected. That is, if a user’s tweets are collected and the user deletes their Twitter account, their content is still in someone else’s database for use. When creating an archive of data, we must understand that the creators behind these tweets have not consented to their content being kept for years from now.
Furthermore, Twitter users who do not put a restriction on what content may be viewed may also not be aware of who has access to data collection; and what they may do with it. A study from Cardiff University found an association between concern for anonymity and sexual orientation, ethnicity and gender. Twitter data may contain identifying demographic information, identifying associations or membership, and expression of a very personal nature. These are items that users may want to protect. A basis for ethical consideration is not only to conduct good and upholding science, but also to minimize risk or harm during any of the study’s data collection and publication.
Citations
Key Points
Dehydrating your tweets solves a lot of issues
Don't Map Twitter
Overview
Teaching: 15 min
Exercises: 5 minQuestions
What can I do with the geographic information in tweets?
How does Twitter represent places?
Objectives
Polygons versus points in Twitter’s data
Figure out when mapping is appropriate.
Why we shouldn’t map Twitter
Let’s put a map or a graph here that shows how very few tweets we expect to have a geotag
very few have geotags
Only a tiny little fraction of tweets have meaningful and useful geographic information. And even those that have Twitter’s geolocations embedded in them are pretty useless.
Count the geotagged tweets in one of our sets
Even fewer have a specific intentional location
Count the POINT geotagged tweets in one of our sets
The exercise here will be to show GitHub’s ability to map a twitter dataset.
Key Points
Determining the location of a tweet when it happened is fuzzy.
At best, it’s a proxy for ‘aboutness’
Proceed with Caution and Respect Humans’ Privacy