Short introduction to Bayesian statistics
Figure 1
Figure 2
Figure 3
Figure 4
Figure 5
Figure 6
Figure 7
Stan
Figure 1
Figure 2
Figure 3
Markov chain Monte Carlo
Figure 1
Figure 2
Figure 3
Hierarchical models
Figure 1
Figure 2
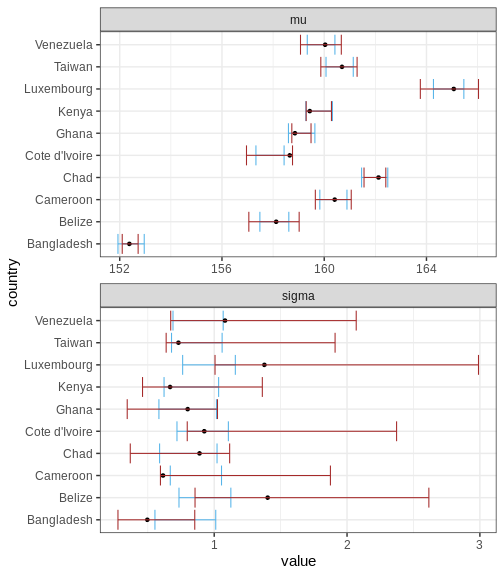
Figure 3
Figure 4
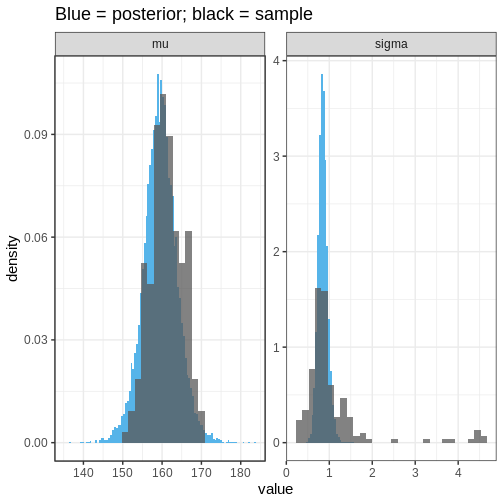 We can see that the population distribution is able to capture the
measured average heights and standard deviations relatively well,
although the within-country variation is estimated to be too
concentrated. However, remember that these estimates are based on a
limited sample: 10 out of 200 countries with 10 individuals in each
group.
We can see that the population distribution is able to capture the
measured average heights and standard deviations relatively well,
although the within-country variation is estimated to be too
concentrated. However, remember that these estimates are based on a
limited sample: 10 out of 200 countries with 10 individuals in each
group.
Figure 5
Model comparison
Figure 1
Figure 2
Figure 3
Figure 4
Figure 5
Gaussian processes
Figure 1
Figure 2
Figure 3
Figure 4
Figure 5
Figure 6
Figure 7
Stan extensions
Figure 1
Figure 2
Figure 3
Figure 4
Figure 5
Figure 6
Figure 7
Figure 8
Figure 9