Introduction to R and RStudio
Last updated on 2026-05-26 | Edit this page
Estimated time: 49 minutes
Overview
Questions
- How to find your way around RStudio?
- How to interact with R?
- How to organise your project files?
- How to install packages?
Objectives
- Describe the purpose and use of each pane in the RStudio IDE
- Locate buttons and options in the RStudio IDE
- Create and use R-projects
- How to organise and access project files
- Use RStudio to write and run R programs.
- Create and start an R-project
- Use
install.packages()to install packages (libraries). - Use the
herepackage to access project files
Motivation
Working with data can often be challenging. Data are rarely in the shape and format that is most convenient for your end product. Everyone working with data knows that there is a lot of work that goes into altering the data to make sure you can explore and highlight the interesting aspects of it. In this lesson, we will use the dataset from the palmerpenguins R-package, which contains observational data on arctic penguins. Data were collected and made available by Dr. Kristen Gorman and the Palmer Station, Antarctica LTER, a member of the Long Term Ecological Research Network. This lesson focuses on using the tidyverse packages, a opinionated collection of packages that are tailored to the needs of data scientists. Can you organise your project in an orderly fashion and access all the files? Can you navigate a dataset in R? Can you add columns and change column names? Can you efficiently summarise the data? Can you create visualizations to show key aspects of the data? At the end of this lesson, you should be able to do al these things!
Before Starting The Workshop
Please ensure you have the latest version of R and RStudio installed on your machine. This is important, as some packages used in the workshop may not install correctly (or at all) if R is not up to date.
- Download and install the latest version of R here
- Download and install RStudio here
- If you are on a windows computer, also download and install RTools
Introduction to RStudio
Welcome to the R portion of the Software Carpentry workshop.
Throughout this lesson, we’re going to teach you some of the best-practice ways of working with data and projects using the tidyverse framework for R.
We’ll be using RStudio: a free, open source R Integrated Development Environment (IDE). It provides a built in editor, works on all platforms (including on servers) and provides many advantages such as integration with version control and project management.
Basic layout
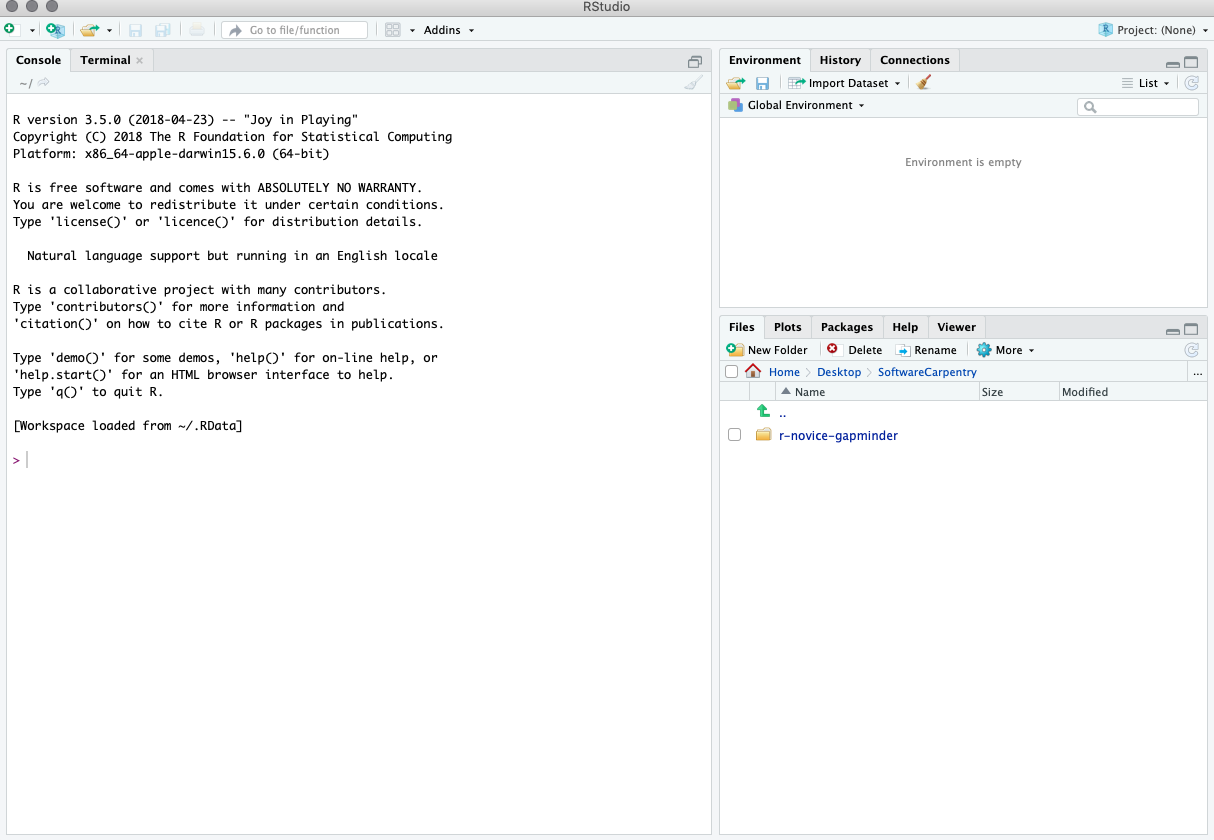
When you first open RStudio, you will be greeted by three panels:
- The interactive R console/Terminal (entire left)
- Environment/History/Connections (tabbed in upper right)
- Files/Plots/Packages/Help/Viewer (tabbed in lower right)
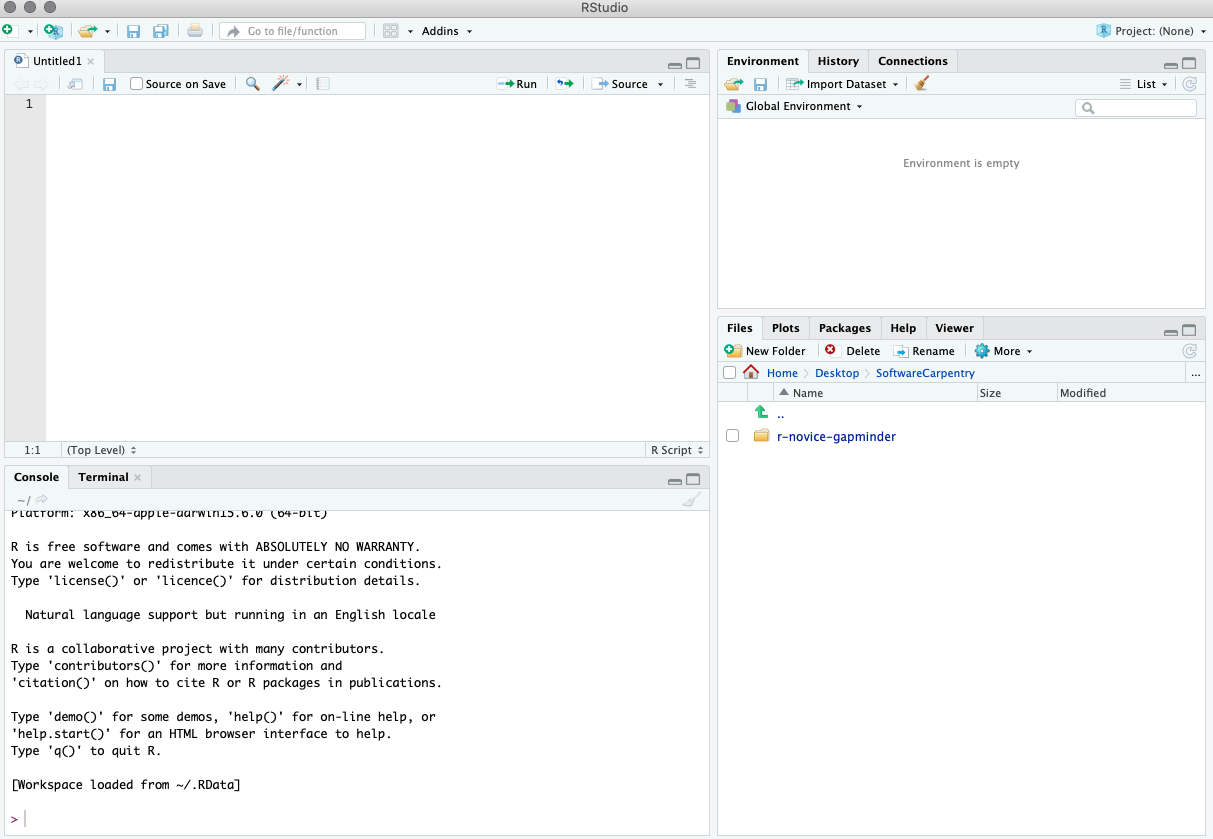
Once you open files, such as R scripts, an editor panel will also open in the top left.
Work flow within RStudio
There are two main ways one can work within RStudio:
- Test and play within the interactive R console then copy code into a
.R file to run later.
- This works well when doing small tests and initially starting off.
- It quickly becomes laborious
- Start writing in a .R file and use RStudio’s short cut keys for the
Run command to push the current line, selected lines or modified lines
to the interactive R console.
- This is a great way to start; all your code is saved for later
- You will be able to run the file you create from within RStudio or
using R’s
source()function.
Tip: Running segments of your code
RStudio offers you great flexibility in running code from within the
editor window. There are buttons, menu choices, and keyboard shortcuts.
To run the current line, you can:
1. click on the Run button above the editor panel, or
2. select “Run Lines” from the “Code” menu, or
3. hit ctrl+return in Windows or Linux or
cmd+ return on OS X.
(This shortcut can also be seen by hovering the mouse over the button).
To run a block of code, select it and then Run.
Introduction to R
Much of your time in R will be spent in the R interactive console.
This is where you will run all of your code, and can be a useful
environment to try out ideas before adding them to an R script file.
This console in RStudio is the same as the one you would get if you
typed in R in your command-line environment.
The first thing you will see in the R interactive session is a bunch of information, followed by a “>” and a blinking cursor. In many ways this is similar to the shell environment you learned about during the shell lessons: it operates on the same idea of a “Read, evaluate, print loop”: you type in commands, R tries to execute them, and then returns a result.
Using R-projects
Any data analysis process is naturally incremental, and many projects start life as random notes, some code, then a manuscript, and eventually everything is a bit mixed together.
Managing your projects in a reproducible fashion doesn’t just make your science reproducible, it makes your life easier.
— Vince Buffalo (@vsbuffalo) April 15, 2013
Most people tend to organize their projects like this:
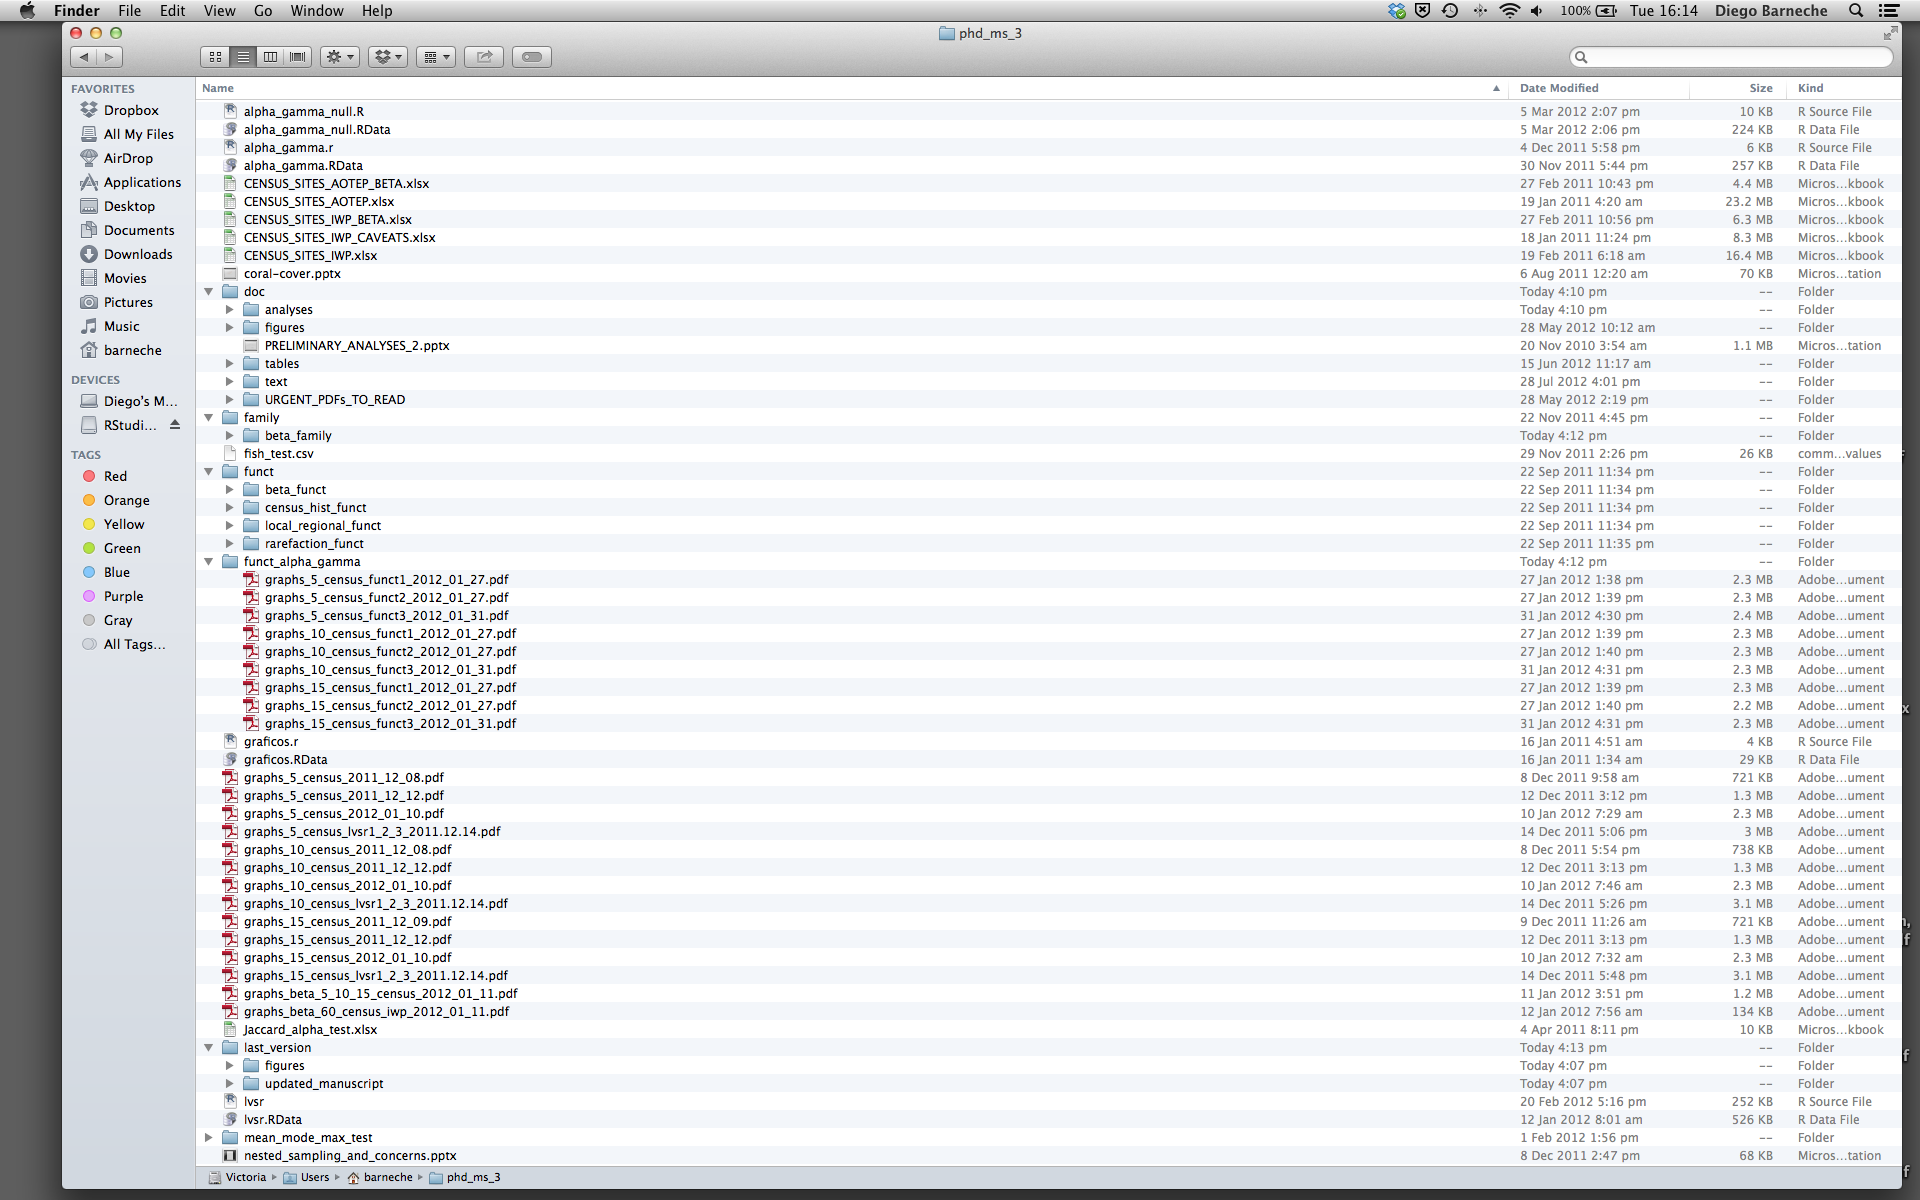
There are many reasons why we should ALWAYS avoid this:
- It is really hard to tell which version of your data is the original and which is the modified;
- It gets really messy because it mixes files with various extensions together;
- It probably takes you a lot of time to actually find things, and relate the correct figures to the exact code that has been used to generate it;
A good project layout will ultimately make your life easier:
- It will help ensure the integrity of your data;
- It makes it simpler to share your code with someone else (a lab-mate, collaborator, or supervisor);
- It allows you to easily upload your code with your manuscript submission;
- It makes it easier to pick the project back up after a break.
A possible solution
Fortunately, there are tools and packages which can help you manage your work effectively.
One of the most powerful and useful aspects of RStudio is its project management functionality. We’ll be using this today to create a self-contained, reproducible project.
Challenge 1: Creating a self-contained project
We’re going to create a new project in RStudio:
- Click the “File” menu button, then “New Project”.
- Click “New Directory”.
- Click “New Project”.
- Type in the name of the directory to store your project,
e.g. “my_project”.
- If available, select the checkbox for “Create a git
repository.”
- Click the “Create Project” button.
The simplest way to open an RStudio project once it has been created
is to click through your file system to get to the directory where it
was saved and double click on the .Rproj file. This will
open RStudio and start your R session in the same directory as the
.Rproj file. All your data, plots and scripts will now be
relative to the project directory. RStudio projects have the added
benefit of allowing you to open multiple projects at the same time each
open to its own project directory. This allows you to keep multiple
projects open without them interfering with each other.
Challenge 2: Opening an RStudio project through the file system
- Exit RStudio.
- Navigate to the directory where you created a project in Challenge
1.
- Double click on the
.Rprojfile in that directory.
Best practices for project organization
Although there is no “best” way to lay out a project, there are some general principles to adhere to that will make project management easier:
Treat data as read only
This is probably the most important goal of setting up a project. Data is typically time consuming and/or expensive to collect. Working with them interactively (e.g., in Excel) where they can be modified means you are never sure of where the data came from, or how it has been modified since collection. It is therefore a good idea to treat your data as “read-only”.
Data Cleaning
In many cases your data will be “dirty”: it will need significant preprocessing to get into a format R (or any other programming language) will find useful. This task is sometimes called “data munging”. Storing these scripts in a separate folder, and creating a second “read-only” data folder to hold the “cleaned” data sets can prevent confusion between the two sets.
Treat generated output as disposable
Anything generated by your scripts should be treated as disposable: it should all be able to be regenerated from your scripts.
There are lots of different ways to manage this output. Having an output folder with different sub-directories for each separate analysis makes it easier later. Since many analyses are exploratory and don’t end up being used in the final project, and some of the analyses get shared between projects.
Tip: Good Enough Practices for Scientific Computing
Good Enough Practices for Scientific computing gives the following recommendations for project organization:
- Put each project in its own directory, which is named after the
project.
- Put text documents associated with the project in the
docdirectory. - Put raw data and metadata in the
datadirectory, and files generated during cleanup and analysis in aresultsdirectory. - Put source for the project’s scripts and programs in the
srcdirectory, and programs brought in from elsewhere or compiled locally in thebindirectory. - Name all files to reflect their content or function.
Separate function definition and application
One of the more effective ways to work with R is to start by writing the code you want to run directly in a .R script, and then running the selected lines (either using the keyboard shortcuts in RStudio or clicking the “Run” button) in the interactive R console.
When your project is in its early stages, the initial .R
script file usually contains many lines of directly executed code. Make
sure to comment your code, so you know the intention of each bit, and
once you have a clearer idea of what you want, tidy up your script so it
only contains what is important.
Challenge 3
Set up your project folders. For this workshop we will need folders for data, results and scripts.
- In the bottom right pane of RStudio, click on “Files”.
- Click on “New folder” and create a folder named
data - Repeat to create
resultsandscripts
Challenge 4
Download the palmer penguins data and place it in your
data folder, calling it penguins.csv
- Go to the raw palmer penguins data
- Right click in the browser window
- Choose “save as…”
- Navigate to your project’s data folder
- Save the file to this location
Tip: command line in RStudio
The Terminal tab in the console pane provides a convenient place directly within RStudio to interact directly with the command line.
Version Control
It is important to use version control with projects.
Go here
for a good lesson which describes using Git with RStudio.