R introduction: Tidy data
Overview
Teaching: 15 min
Exercises: 20 minQuestions
What is tidy data?
Objectives
Understand why tidy data is useful
When analysing data using code, the ideal scenario is to go from the raw data to the finished outcome, whether that’s a plot, a table, an interactive app or machine-learning model, completely via code. Depending on the complexity of the data and the analysis, this may be made up of a series of different coding scripts, creating a data analysis ‘pipeline’.
Very often, the data that you start with is not optimsed for analysis via code. In fact, it’s not unusual for the bulk of a data analysis project to be dedicated to data cleaning, with the actual analysis part only occurring at the end.
Often, you will deal with ‘wide’ data. That is, data with lots of columns and fewer numbers of rows. Specifically, each variable has its own column.
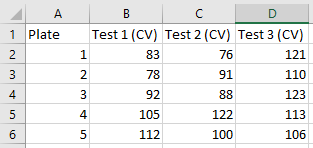
An alternative format is ‘long’ data, also know as ‘tidy’ data, which is where one column contains all of the values with the remaining columns giving those columns context. Below is an example of data in a wide format,

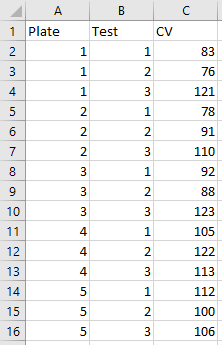
Here is the same data restructured in a long (or tidy) format,

Notice that in this format, each row corresponds to a single data point or observation. This data format not only provides a universal structure for all projects, but is also the preferred format in R, as it allows R to fully exploit certain aspects of how it works ‘under the hood’. It also enables you to encode multiple aspects of an observation. That may not look like a great advantage with 2 aspects (in this case ‘Plate’ and ‘Test’), but imagine if there were others, such as ‘lab’, ‘analyst’ or ‘day of the week’. The goal at the start of any data analysis should be to get your data into this format when possible.
The context for this course is 4PL plate data, which may at first not appear to fit this mold. After-all, the data is simply a 2D representation of the ELISA plate. It doesn’t look ‘untidy’ as that word is commonly used, but what you’ve actually got is a grid of measurements, often containing multiple measurements for a given sample. Once you add these definitions to each plate file, the ‘tidy’ version becomes apparent (see exercises below).
There are also points during analysis where you’ll have intermediate datasets, where again, tidy datasets will be beneficial.
Exercise: Tidy Data example 1
Take a look at the file ‘untidy-to-tidy-eg1.xlsx’. Have a look at the 3 tabs and see the different ways that the same data is laid out. In this example, the plate data (the tab called ‘untidy’) contains 3 repeat measurements for a number of different samples.
Exercise: Tidy Data example 2
Take a look at the file ‘untidy-to-tidy-eg2.xlsx’. This time we have results versus concentration values. Again, see how the untidy data is transformed to the tidy format.
Key Points
Tidy data makes future analysis very straightforward, especially in coding environments