Measuring performance
Overview
Teaching: 40 min
Exercises: 20 minQuestions
How do we know our program ran faster?
How do we learn about efficiency?
Objectives
View performance on system monitor
Find out how many cores your machine has
Use
%timeand%timeitline-magicUse a memory profiler
Plot performance against number of work units
Understand the influence of hyper-threading on timings
A first example with Dask
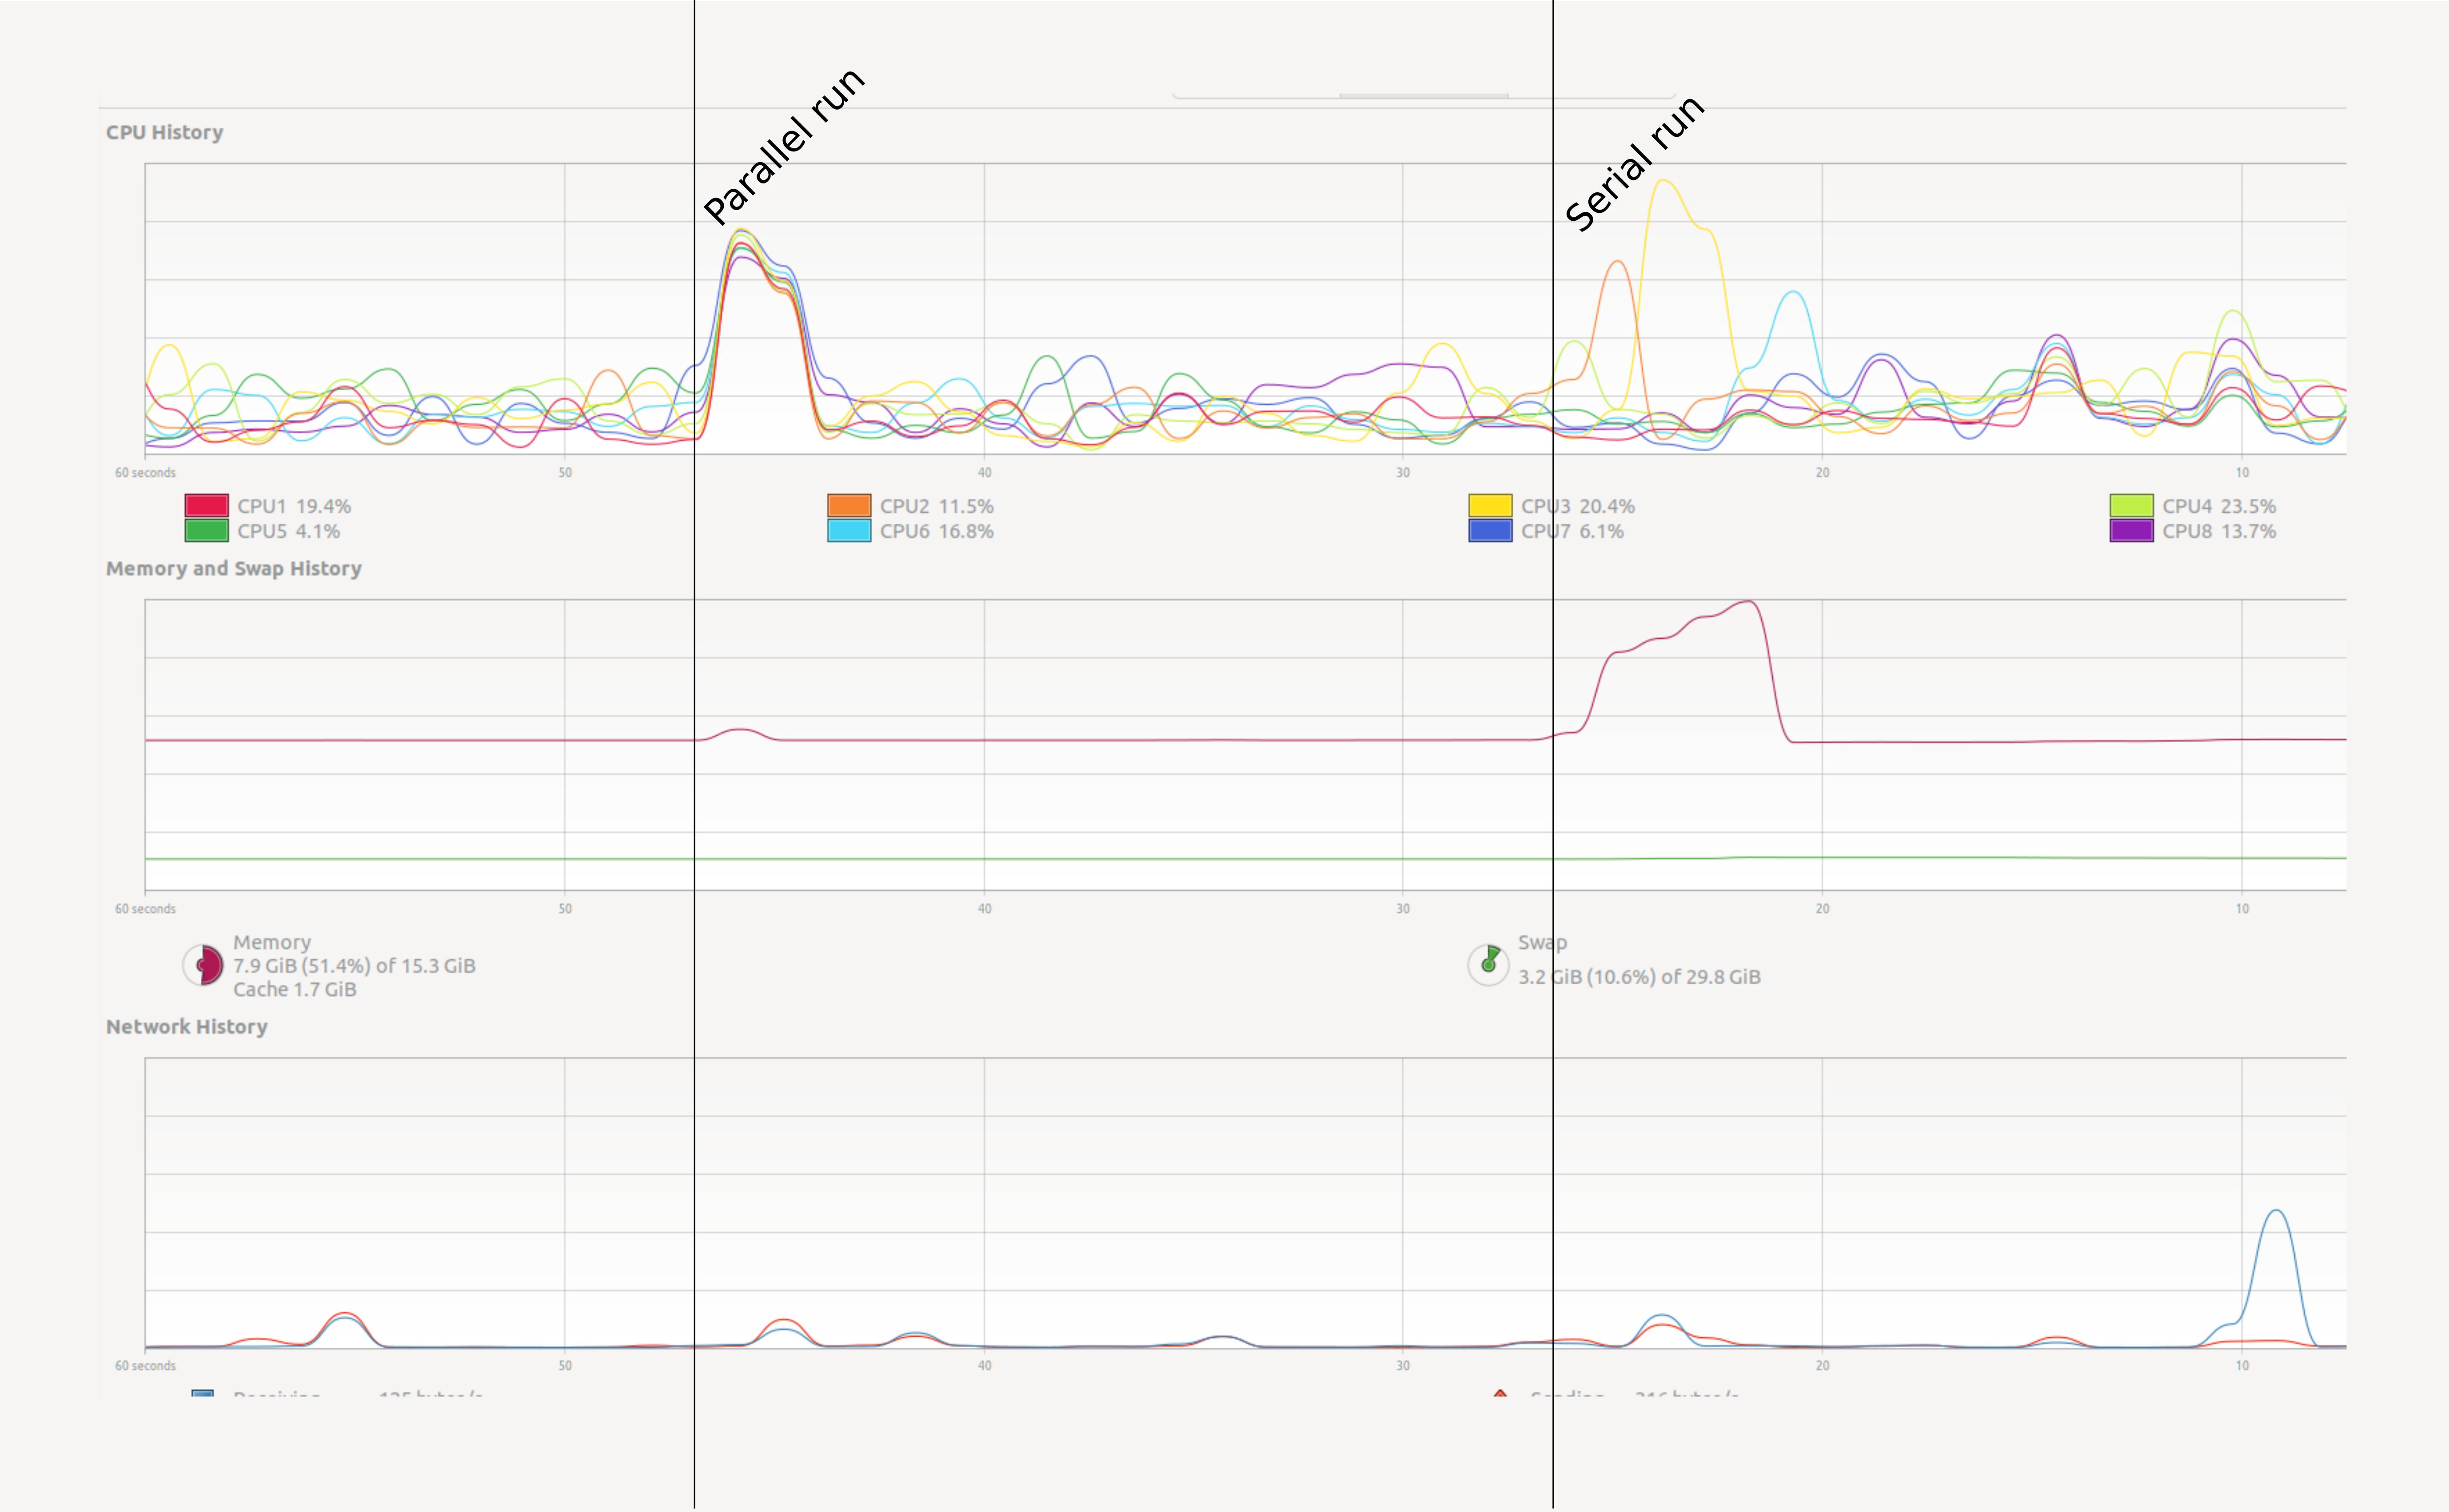
We will get into creating parallel programs in Python later. First let’s see a small example. Open your system monitor (this will differ among specific operating systems), and run the following code examples.
# Summation making use of numpy:
import numpy as np
result = np.arange(10**7).sum()
# The same summation, but using dask to parallelize the code.
# NB: the API for dask arrays mimics that of numpy
import dask.array as da
work = da.arange(10**7).sum()
result = work.compute()
Try a heavy enough task
It could be that a task this small does not register on your radar. Depending on your computer you will have to raise the power to
10**8or10**9to make sure that it runs long enough to observe the effect. But be careful and increase slowly. Asking for too much memory can make your computer slow to a crawl.
How can we test this in a more practical way? In Jupyter we can use some line magics, small “magic words” preceded
by the symbol %% that modify the behaviour of the cell.
%%time
np.arange(10**7).sum()
The %%time line magic checks how long it took for a computation to finish. It does nothing to
change the computation itself. In this it is very similar to the time shell command.
If run the chunk several times, we will notice a difference in the times.
How can we trust this timer, then?
A possible solution will be to time the chunk several times, and take the average time as our valid measure.
The %%timeit line magic does exactly this in a concise an comfortable manner!
%%timeit first measures how long it takes to run a command one time, then
repeats it enough times to get an average run-time. Also, %%timeit can measure run times without
the time it takes to setup a problem, measuring only the performance of the code in the cell.
This way we can trust the outcome better.
%%timeit
np.arange(10**7).sum()
If you want to store the output of %%timeit in a Python variable, you can do so with the -o flag.
time = %timeit -o np.arange(10**7).sum()
print(f"Time taken: {time.average:.4f}s")
Note that this does not tell you anything about memory consumption or efficiency.
Memory profiling
- The act of systematically testing performance under different conditions is called benchmarking.
- Analysing what parts of a program contribute to the total performance, and identifying possible bottlenecks is profiling.
We will use the memory_profiler package to track memory usage.
It can be installed executing the code below in the console:
pip install memory_profiler
In Jupyter, type the following lines to compare the memory usage of the serial and parallel versions of the code presented above (again, change the value of 10**7 to something higher if needed):
import numpy as np
import dask.array as da
from memory_profiler import memory_usage
import matplotlib.pyplot as plt
def sum_with_numpy():
# Serial implementation
np.arange(10**7).sum()
def sum_with_dask():
# Parallel implementation
work = da.arange(10**7).sum()
work.compute()
memory_numpy = memory_usage(sum_with_numpy, interval=0.01)
memory_dask = memory_usage(sum_with_dask, interval=0.01)
# Plot results
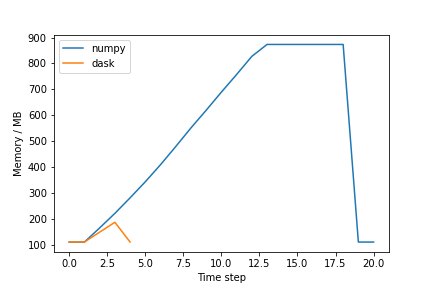
plt.plot(memory_numpy, label='numpy')
plt.plot(memory_dask, label='dask')
plt.xlabel('Time step')
plt.ylabel('Memory / MB')
plt.legend()
plt.show()
The figure should be similar to the one below:
Exercise (plenary)
Why is the Dask solution more memory efficient?
Solution
Chunking! Dask chunks the large array, such that the data is never entirely in memory.
Profiling from Dask
Dask has several option to do profiling from Dask itself. See the dask documentation for more information.
Using many cores
Using more cores for a computation can decrease the run time. The first question is of course: how many cores do I have? See the snippets below to find out:
Find out how many cores your machine has
The number of cores can be found from Python by executing:
import psutil
N_physical_cores = psutil.cpu_count(logical=False)
N_logical_cores = psutil.cpu_count(logical=True)
print(f"The number of physical/logical cores is {N_physical_cores}/{N_logical_cores}")
Usually the number of logical cores is higher than the number of physical course. This is due to hyper-threading, which enables each physical CPU core to execute several threads at the same time. Even with simple examples, performance may scale unexpectedly. There are many reasons for this, hyper-threading being one of them.
See for instance the example below:
On a machine with 4 physical and 8 logical cores doing this (admittedly oversimplistic) benchmark:
x = []
for n in range(1, 9):
    time_taken = %timeit -r 1 -o da.arange(5*10**7).sum().compute(num_workers=n)
    x.append(time_taken.average)
Gives the following result:
import pandas as pd
data = pd.DataFrame({"n": range(1, 9), "t": x})
data.set_index("n").plot()

Discussion
Why is the runtime increasing if we add more than 4 cores? This has to do with hyper-threading. On most architectures it does not make much sense to use more workers than the number of physical cores you have.
Key Points
It is often non-trivial to understand performance
Memory is just as important as speed
Measuring is knowing