Create Visualizations
Overview
Teaching: 15 min
Exercises: 5 minQuestions
How can I create an interactive visualization using Plotly Express?
Objectives
Learn how to create and modify an interactive line plot using the px.line() function
Now that our data is in a tidy format, we can start creating some visualizations. Let’s start by creating a new notebook (make sure to select the dataviz kernel in the Launcher) and renaming it data_visualizations.ipynb.
Let’s make our first cell into a markdown cell, and give this notebook a title:
# Data Visualizations
Remember to also add some metadata and describe what this notebook does.
Import our newly tidy data
First, we need to import pandas and Plotly Express, and then read in our dataframe.
import pandas as pd
import plotly.express as px

df = pd.read_csv("Data/gapminder_tidy.csv")
df
Creating our first plot
Our first plot is going to be relatively simple. Let’s plot the GDP of New Zealand over time. First, let’s figure out what our X and Y axis will need to be.
The X axis is typically used for time, so that will be our year column.
The Y axis will be the GDP amount, which is kept in the value column.
However, this dataframe has a lot of extra information in it. We want to create a new dataframe with only the rows we need for the visualization.
That means we need to filter for rows where the country is “New Zealand” and the metric is “gdpPercap”.
We can do this with the query() function.
df.query("country=='New Zealand'")
This will select all of the rows where country is “New Zealand”. We can add our second condition by either chaining another query() function or specifying the additional condition in the same query() function.
df.query("country=='New Zealand'").query("metric=='gdpPercap'")
df.query("country=='New Zealand' & metric=='gdpPercap'")
Let’s make sure to save that filtered dataframe to a new variable.
df_gdp_nz = df.query("country=='New Zealand' & metric=='gdpPercap'")
Now we can pass this dataframe to the px.line() function. At a minimum, we need to tell the function what dataframe to use, what column should be the X axis, and what column should be the Y axis.
fig = px.line(df_gdp_nz, x = "year", y = "value")
fig.show()
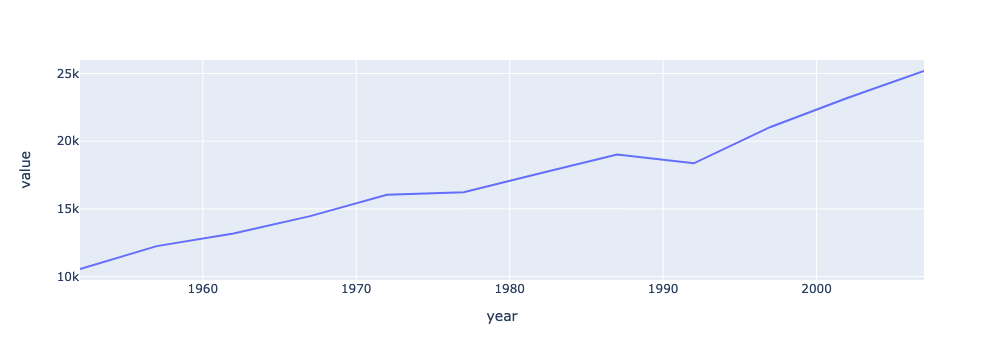
There it is! Our first line plot.
When you want to compare - adding more lines and labels
By itself, this plot of New Zealand’s GDP isn’t especially interesting. Let’s add another line, to compare it to Australia.
First, we need to define a new dataframe to select the rows we need. This time, we will specify the continent as “Oceania”.
df_gdp_o = df.query("continent=='Oceania' & metric=='gdpPercap'")
df_gdp_o
Now, we will create another figure, but this time we need to pass an additional parameter: color.
fig = px.line(df_gdp_o, x = "year", y = "value", color = "country")
fig.show()
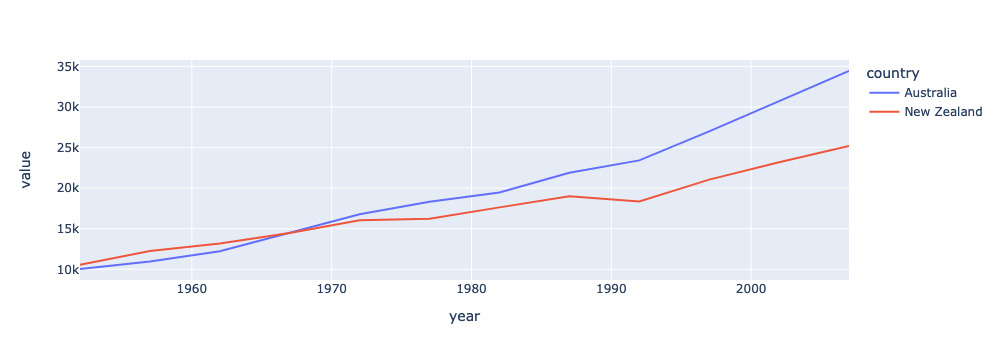
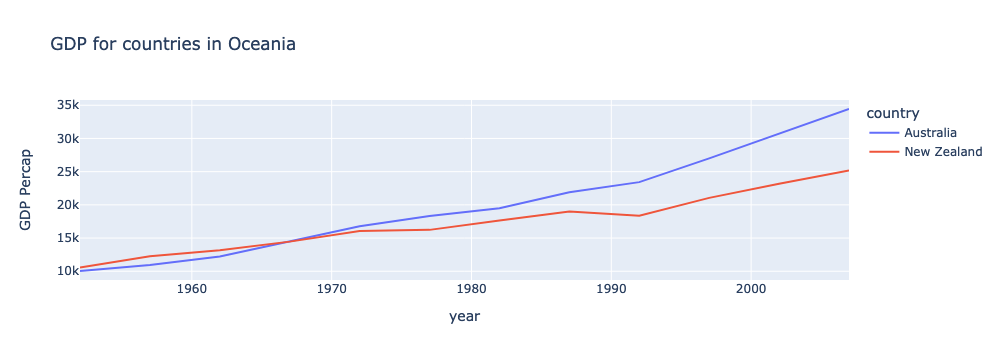
Great! This already looking better. But we should fix that y-axis label and add a title.
title = "GDP for countries in Oceania"
fig = px.line(df_gdp_o, x = "year", y = "value", color = "country", title = title, labels={"value": "GDP Percap"})
fig.show()
Interactivity is baked in to Plotly charts
When you have many more lines, the interactive features of Plotly become very useful. Notice how hovering over a line will tell you more information about that point. You will also see several options in the upper right corner to further interact with the plot - including saving it as a PNG file!
Exercises
Visualize Population in Europe
Create a plot that visualizes the population of countries in Europe over time.
Solution
df_pop_eu = df.query("continent=='Europe' & metric=='pop'")
fig = px.line(df_pop_eu, x = "year", y = "value", color = "country", title = "Population in Europe", labels={"value": "Population"})
fig.show()
Visualize Average Life Expectancy in Asia
Create a plot that visualizes the average life expectancy of countries in Asia over time.
Solution
df_le_as = df.query("continent=='Asia' & metric=='lifeExp'")
fig = px.line(df_le_as, x = "year", y = "value", color = "country", title = "Life Expectancy in Asia", labels={"value": "Average Life Expectancy"})
fig.show()
Key Points
Before visualizing your dataframe, make sure it only includes the rows you want to visualize. You can use pandas’
query()function to easily accomplish thisTo make a line plot with
px.line, you need to specify the dataframe, X axis, and Y axisIf you want to have multiple lines, you also need to specify what column determines the line color
In a Jupyter Notebook, you need to call
fig.show()to display the chart