Other Resources
Overview
Teaching: 10 min
Exercises: 10 minQuestions
What can I do after I have built a pangenome?
What bioinformatic tools are available for downstream analysis of pangenomes?
Objectives
Learn downstream analysis to describe a pangenome
Before building a Pangenome
Before building a Pangenome it is necessary to know the taxonomic classification of the genome of interest. The Genome taxonomy database provides a comprehensive catalog of prokaryotes GTDB. The closest genomes to a new genome can be found with the GTDB toolkit as in this example.
Downstream analysis of pangenomes
We have acquired a comprehensive understanding of pangenome construction techniques at this stage. Our analysis has yielded a gene presence-absence matrix, which serves as a rudimentary representation of our pangenome. Ideally, we can complement this data by incorporating a metadata file encompassing various phenotypic features associated with each sample. These features may include the year of isolation, geographic origin, host information, drug-resistance profiles, levels of pathogenicity or virulence, serotypes, lineages, and more. Armed with this extensive metadata, numerous intriguing avenues for downstream analyses become available to us. By exploring the pangenome, we can uncover invaluable insights and elucidate various aspects of microbial genetics.
Firstly, a focused investigation of the core genome allows us to reconstruct robust phylogenetic trees. By examining the conserved genetic elements shared among organisms, we can establish evolutionary relationships, elucidate common ancestry, and gain a deeper understanding of the microbial diversity within our dataset. Furthermore, these phylogenetic trees are a foundation for designing effective molecular diagnostic tools and formulating targeted antimicrobial drugs or vaccines to combat various strains or lineages.
Simultaneously, we can harness the power of the accessory genome to conduct comparative genomic analyses. This allows us to discern dissimilarities between subsets of samples within our dataset, providing crucial insights into specific traits or characteristics. By identifying genes or genetic variations unique to specific groups of organisms, we can unravel the genetic basis of their phenotypic diversity, such as drug-resistance profiles, pathogenicity, or virulence levels.
Pan-GWAS Analysis
The Genome-Wide Association Studies (GWAS) represent a strategy to investigate the relationship between genetic variations and phenotypic traits in large populations. In Pangenomics, the GWAS strategy could also be applied by adjusting some parameters and assumptions compared with the typical GWAS analysis in eukaryotes.
Scoary is a software tool specifically designed to analyze the gene_presence_absence.csv file generated by Roary and a user-created traits file. It calculates the associations between all genes in the accessory genome and the traits provided. The output is a sorted list of genes based on the strength of association with each trait. The authors defined it as a pan-GWAS tool.
Original paper: Brynildsrud, O., Bohlin, J., Scheffer, L. et al. Rapid scoring of genes in microbial pan-genome-wide association studies with Scoary. Genome Biol 17, 238 (2016). https://doi.org/10.1186/s13059-016-1108-8
Clustering analysis of the accessory genome
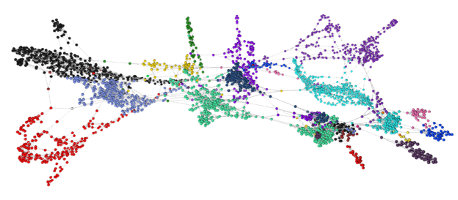
The Graphical Processing for Pangenome-Linked Exploration GraPPLE repository contains scripts to help users visualize their bacterial pangenome datasets in 3D by using Graphia network analysis suite. These graphs allow exploration of bacterial population structures, gene distributions across populations, and the syntenic order of genes. The analysis and visualization are scalable to large datasets comprising thousands of genome sequences. While GraPPLE was initially developed to work with PIRATE output, it can also accept gene presence/absence matrices from other compatible tools like Roary, Panaroo, PPanGGOLiN, and others.
GraPPLE was developed in order to investigate several key questions:
-
How similar are a group of isolates to each other based on the accessory genome? To what extent do these groups align with the core genome phylogeny or other relevant categorizations such as geographical location, habitat, clinical presentation, or sampling date?
-
How are accessory genes interconnected based on their presence/absence across a collection of isolates? Are there significant associations between co-occurring gene clusters and isolate characteristics, such as population clusters, core phylogenetic groupings, or other known attributes?
-
What structural and syntenic relationships exist between core and accessory genes within the complete pangenome? Can the position of a gene provide useful information, such as its function? Can these relationships shed light on the forces driving genome evolution, including the presence of mobile genetic elements and associated functions like virulence or antimicrobial resistance?
Note: Please note that they are currently in beta, so it is important to review the outputs for coherence and report any issues or bugs.
Original paper Harling-Lee, J.D., Gorzynski, J., Yebra, G. et al. A graph-based approach for the visualization and analysis of bacterial pangenomes. BMC Bioinformatics 23, 416 (2022). https://doi.org/10.1186/s12859-022-04898-2
Other tools
OrthoVenn3
OrthoVenn3 is a web visualization tool for comparative genomics. It can make a complete pipeline from clustering to evolutionary analyses. Which can be applied to your own samples or to the ones in the built-in database. It offers a wide variety of visualizations.
Original paper: Jiahe Sun and others, OrthoVenn3: an integrated platform for exploring and visualizing orthologous data across genomes, Nucleic Acids Research, Volume 51, Issue W1, 5 July 2023, Pages W397–W403, https://doi.org/10.1093/nar/gkad313
Benchmarking for Orthologs Predictions
The clustering step is decisive in the results that you will obtain, so choosing a clustering algorithm is a crucial part of working on pangenomics. To facilitate this task, you can utilize the resources the Orthology Benchmarking website provides. This platform offers a pre-processed benchmarking analysis of various methodologies, ranking them based on their efficacy in identifying authentic orthologs (recall). Additionally, it provides the opportunity to assess your own methods and results within this framework.
For detailed instructions on how to submit your own data for evaluation, please refer to the following information:
How to submit my ortholog predictions to Orthology Benchmarking
Original paper: Brigitte Boeckmann and others, Conceptual framework and pilot study to benchmark phylogenomic databases based on reference gene trees, Briefings in Bioinformatics, Volume 12, Issue 5, September 2011, Pages 423–435, https://doi.org/10.1093/bib/bbr034
Wrap up
In conclusion, the vast array of downstream analyses made possible by our pangenome dataset and accompanying metadata file holds immense promise. By exploring the core and accessory genomes, along with phenotypic correlations, we can gain valuable insights into evolutionary relationships, understand the genetic basis of specific traits, and contribute to better knowledge about the adaptive processes bacteria have achieved in their respective lifestyle.
Carpentries Philosophy
A good lesson should be as complete and clear that becomes easy to teach by any instructor. Carpentries lessons are developed for the community, and now you are part of us. This lesson is being developed and we are sure that you can collaborate and help us improve it.
Key Points
Downstream analysis of pangenomes could be focused on describing the core or the accessory genome of the organism studied.
Examples using the information obtained in the CORE GENOME:
a) Selection of a conserved gene to design a molecular test for a diagnostic tool or a vaccine.
b) Reconstruction of a species phylogenetic tree by using all the core genes.
Examples using the information obtained in the ACCESSORY GENOME:
a) Describe niche-specific genes among the strains compared.
b) Analysis of horizontal gene transfer or genetic recombination.
c) Evolutionary studies of genes (duplication, gain-loss genes, etc.).