Functional programming in R
Overview
Teaching: 30 min
Exercises: 60 minQuestions
What is the structure of a function in R?
What are functions important for code readability and quality?
Objectives
Understand how a function in R is structured.
Be able to name the advantages of creating functions.
Be able to execute a vectorised operation using a function and a vector.
Understand that for loops can be replaced by vectorised operations.
Table of contents
- 1. Introduction
- 2. Steps when building a function
- 3. Functional programming in R - simple case
- 4. References

1. Introduction
Functions are at the heart of the R programming language. A lot of analytical steps you will perform in R will be based composed of a series of functions working together.
1.1 When to make functions?
- When you repeat yourself many times. Same block of code repeated over and over (copy-paste-mistake pattern).
- When your code becomes very long (e.g. > 50 lines) and it becomes hard to understand the logic behind your code. What are the steps taken?
- When you want to reuse code over multiple projects over time. Think about a function that makes a plot from the same type of input data, a functiont that performs unit conversion, etc.
- Why? - When you need to create a series of plots, models that all differ by very few optional arguments (e.g. p-value threhold), etc.
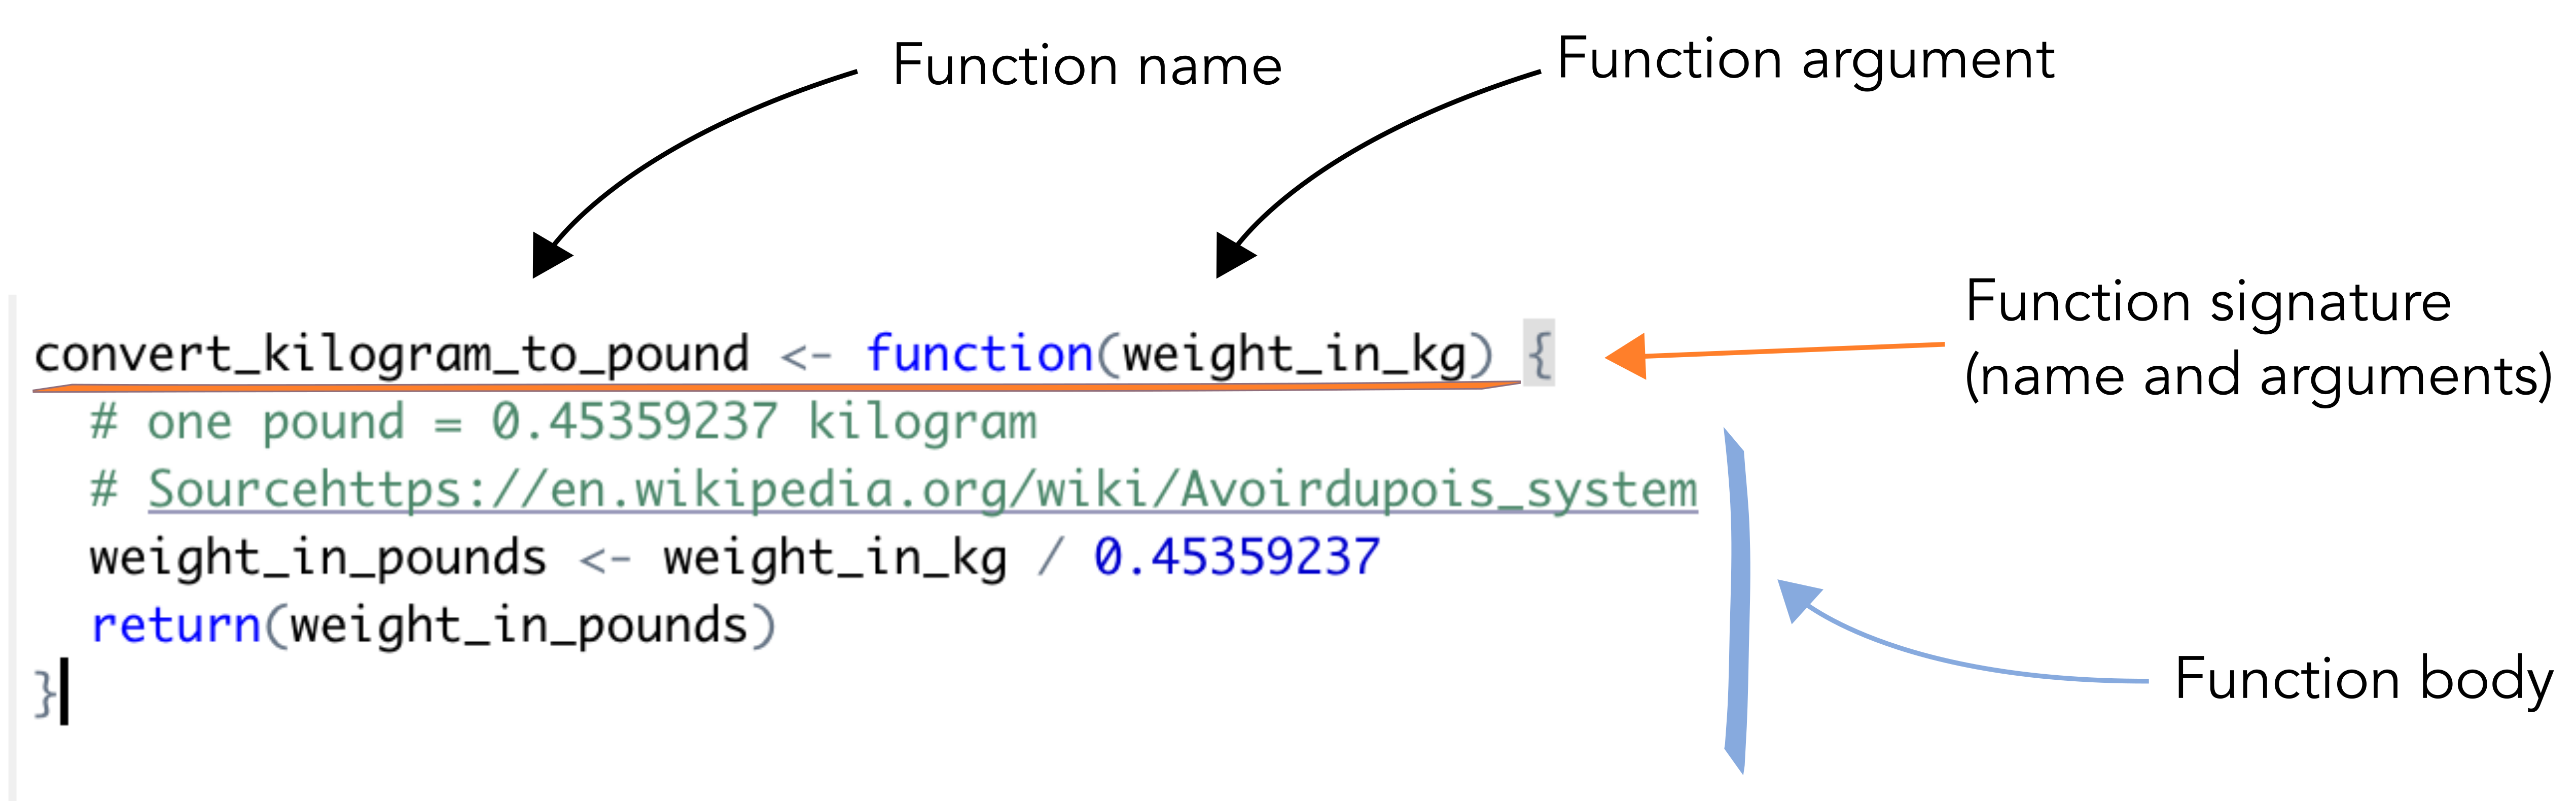
1.2 Function components
- Signature: the name of the function together with its arguments.
- Arguments: arguments of your function. This can be accessed using the
?formals(my_function)or?args(my_function) - Body: function definition (inside curly braces). What your function does.
- Environment: the variables and objects in R memory that are known to R inside the function.
1.3 A simple example
Here is a simple function that converts the weight in kilograms to its corresponding weight in pounds. The conversion rate is taken from Wikipedia.
convert_kilogram_to_pound <- function(weight_in_kg) {
  # one pound = 0.45359237 kilogram
  # Sourcehttps://en.wikipedia.org/wiki/Avoirdupois_system
  weight_in_pounds <- weight_in_kg / 0.45359237
  return(weight_in_pounds)
}
Exercise
Question 1: Apply the
formals()function to theconvert_kilogram_to_poundfunction. What component of the function do you find?
Question 2: What does thebody()function call onconvert_kilogram_to_poundreturn?Solution
formals(convert_kilogram_to_pound)returns the name(s) of the function arguments. Here it returnsweight_in_kgas it is the only argument. An alternative function isformalArgs(convert_kilogram_to_pound)which only returns the name of the argument as a character.
body(convert_kilogram_to_pound)returns the code written inside theconvert_kilogram_to_pound()function.
1.4 Function environment
FIXME
1.5 Recap scheme
1.6 Setup
Before we dive further into functions, let’s get ready:
- First of all, let’s clear our current workspace with the 🧹
- Then, let’s reload the
tidyversesuite of packages. - We will also need another package called
rlang. - Finally, let’s re-import the gapminder dataset to make sure we work with non-modified data.
rm(list = ls()) # similar to the broom. Removes all objects from the current workspace
library("tidyverse")
library("rlang")
gapminder <- readr::read_csv('https://raw.githubusercontent.com/carpentries-incubator/open-science-with-r/gh-pages/data/gapminder.csv')
2. Steps when building a function
2.1 Find a name
Remember the names of dplyr functions?
filteracts on a dataframe rows and filters based on a logic test (> 0)selectacts on a dataframe columns and selects columns based on their names for instance.
These are good names because they are verbs and because they are explicit on what they do.
What’s in a name?
“A rose by any other name would smell as sweet” (Romeo and Juliette, Shakespeare).
Sure! But for functions, naming is essential 😊
So make sure you give your custom function, a clear distinctive name.
Exercise
lm()is an example of a badly named function.
- Find what
lm()stands for by typing?lm()- Can you suggest a better name for that function?
Solution
lm()stands for linear model. It fits a linear model on some dataset.- A better name could be “fit_linear_model()” for instance. It has a verb and is not an abbreviation.
2.2 Turn your initial script into the body of a function
Let’s see how we can convert our script to plot the GDP per capita per country section 2.1 of the previous episode
This is what we had for one country (e.g. “Afghanistan”):
## filter the country to plot
gap_to_plot <- gapminder %>%
  filter(country == "Afghanistan")

## plot
my_plot <- ggplot(data = gap_to_plot, aes(x = year, y = gdpPercap)) +
  geom_point() +
  ## add title and save
  labs(title = paste("Afghanistan", "GDP per capita", sep = " "))
my_plot
This will become the body of a new function.
How shall we call our new function?
Could you propose a good name for that function? Remember, it has to contain a verb, be relatively short and meaningful.
By convention, everything within the body of a function has to be indented. You can add two spaces (space bar x 2) in front of every line.
Since it is also a good style tip to have indentations after the %>% operator (following the tidyverse style), you will have a total of 2x2 (4) spaces before some lines.
Let’s copy and paste our piece of code into the body of our newly defined function:
plot_gdp_per_cap_per_country <- function(data = gapminder){

  gap_to_plot <- gapminder %>%
    filter(country == "Afghanistan")

  ## plot
  my_plot <- ggplot(data = gap_to_plot, aes(x = year, y = gdpPercap)) +
    geom_point() +
    ## add title and save
    labs(title = paste("Afghanistan", "GDP per capita", sep = " "))

  return(my_plot) # optional but explicit on what the function returns
}
Exercise
Take a look at the code of our function. There are two lines of code that need to be generalised. Can you find which ones?
Solution
Line 1:
filter(country == "Afghanistan")
Line 2:labs(title = paste("Afghanistan", "GDP per capita", sep = " "))
These two lines are not generic and our function will always plot results for “Afghanistan”.
plot_gdp_per_cap_per_country <- function(data = gapminder){

  gap_to_plot <- gapminder %>%
    filter(country == "Afghanistan")

  ## plot
  my_plot <- ggplot(data = gap_to_plot, aes(x = year, y = gdpPercap)) +
    geom_point() +
    ## add title and save
    labs(title = paste("Afghanistan", "GDP per capita", sep = " "))

  return(my_plot) # optional but explicit on what the function returns
}
2.3 Add arguments in the function signature
Since our function has a body but is missing an argument namely cntry, let’s add it. We will change its name to country_to_plot to better reflect its purpose.
# define the function
plot_gdp_percap_from_gapminder <- function(data = gapminder, country_to_plot = "Albania"){

  gap_to_plot <- data %>%
    filter(country == country_to_plot)

  ## plot
  my_plot <- ggplot(data = gap_to_plot, aes(x = year, y = gdpPercap)) +
    geom_point() +
    ## add title and save
    labs(title = paste(country_to_plot, "GDP per capita", sep = " "))

  return(my_plot) # optional but explicit on what the function returns
}
# run the function
plot_gdp_percap_from_gapminder <- function(data = gapminder, country_to_plot = "Albania")
If you would execute this code, it would not work because all tidyverse functions are using something called “tidy evaluation” that is a form of non-standard evaluation used mostly by dplyr verbs such as filter, select etc.
tidy evaluation
This is clearly outside of the scope of this lesson. If interested, please consult the related
dplyrsection and this blog post.
Inside the function, the country_to_plot expression needs to be first quoted (not evaluated) before being passed to dplyr functions. We do this by using the enquo() function to capture both expression and its initial environment.
plot_gdp_percap_from_gapminder <- function(data = gapminder, country_to_plot = "Albania"){

  # enquo quotes the "country_to_plot" variable and does not evaluate it yet
  country_to_plot = enquo(country_to_plot) # quote

  # uncomment if you want to see what enquo(country_to_plot) does inside the function
  # print(country_to_plot)

  gap_to_plot <- data %>%
    filter(country == !!country_to_plot) # unquote
  # the bang bang operator !! evaluates the expression in the dplyr filter call

  ## plot
  my_plot <- ggplot(data = gap_to_plot, aes(x = year, y = gdpPercap)) +
    geom_point() +
    ## add title and save
    labs(title = paste(as_name(country_to_plot), "GDP per capita"))

  return(my_plot) # optional but explicit on what the function returns
}

# execute the function with default arguments
plot_gdp_percap_from_gapminder()
You should obtain a plot for Albania (default).
Now, you can easily plot the GDP per capita for a given country.
plot_gdp_percap_from_gapminder(country_to_plot = "Cuba")
plot_gdp_percap_from_gapminder(country_to_plot = "France")
3. Functional programming in R - simple case
R is at its core a functional language meaning it applies functions to objects and returns another object. We can use this property to improve our code and get ride of the for loops.
Indeed, for loops are not easy to read and understand since they make use of temporary variables,
3.1 The map() function
This example is taken from Stanford Data Challenge Lab (DCL) course.
Execute this code to get the number of moons per planet as a list:
moons <-
  list(
    earth = 1737.1,
    mars = c(11.3, 6.2),
    neptune =
      c(60.4, 81.4, 156, 174.8, 194, 34.8, 420, 2705.2, 340, 62, 44, 42, 40, 60)
  )
Each vector in the list contains the radius of the moons in kilometer. For instance, the Earth moon radius is 1731.1 km.
To count the number of moons for each planet, we can execute length() on each element of the list:
length(moons$earth)
length(moons$mars)
length(moons$neptune)
Not only this is tedious but can be impossible to perform if the moons list would contain too many elements. Previously, for loop gave us one solution to do this.
Exercise
Can you achieve the same result with a for loop?
Solution
for (i in seq_along(moons)){
  print(length(moons[[i]]))
}
Here, we will see a package called purrr that makes this process more straightforward.

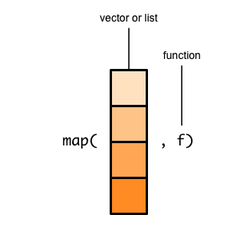
The map function takes a vector or a list and a function as its two arguments.
# first argument = list of moons' radius
# second argument = function length()
map(moons, length)
This returns a list. Ideally, a simplified object would be a vector with only 3 values inside (the number of moons per planet). There is a map() variant that does precisely that and it is called map_int():
map_int(moons, length)
earth    mars  neptune
    1       2       14
3.2 Detailed explanation
The map() function takes a list or a vector and a function as its two arguments.
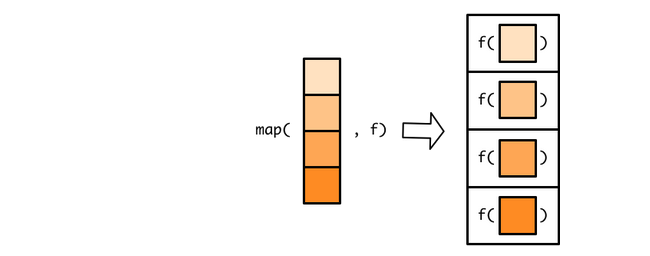
map() takes each element of the list/vector and applies the function to it. Hence the name “map” since it maps each item of a vector/list to a function.
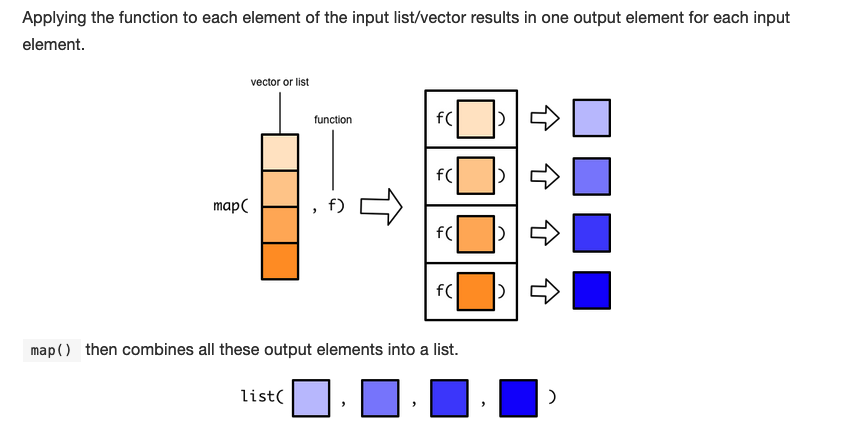
When we applied the map() function to the moons list with the length() function, it returned a list with the length of each item in the moons list.
3.3 map() family of functions
We have already seen that the map() function comes with variants since we used the map_int() function that returns integers.
When mathematical operations need to be performed, the map_dbl() that returns doubles (numeric decimal values) comes in handy.
Try out:
map_dbl(moons, median)
earth    mars  neptune
1737.1   11.3  2705.2
This is necessary when the applied function returns doubles/numeric values while the map() variant expects integers. If you try this, it will return an error:
map_int(moons, median)
The first element returned by median is 1731.1 that is a double. Therefore, it cannot be converted to an integer (1731) without losing information.
Error: Can't coerce element 1 from a double to a integer
Indeed, map() comes with a whole family of functions. Check the help manual of map():
?map()
[...]
map(.x, .f, ...)

map_lgl(.x, .f, ...)

map_chr(.x, .f, ...)

map_int(.x, .f, ...)

map_dbl(.x, .f, ...)

map_raw(.x, .f, ...)

map_dfr(.x, .f, ..., .id = NULL)

map_dfc(.x, .f, ...)

[...]

Value
map() Returns a list the same length as .x.

map_lgl() returns a logical vector, map_int() an integer vector, map_dbl() a double vector, and map_chr() a character vector.

map_df(), map_dfc(), map_dfr() all return a data frame.
3.4 map() applied to gapminder
Using the map() function, we can now create a list called all_plots that contain all our ggplot figures.
# We take only the first 10 countries
countries_to_plot <- unique(gapminder$country)[1:10]

# Create a list that contain our plots
all_plots <- map(
  .x = countries_to_plot,
  .f = function(x) plot_gdp_percap_from_gapminder(data = gapminder, country_to_plot = x)
  )
To save the plots on the disk, the map2() function that takes two input vector/list instead of one. The first vector/list will be the titles of the files while the second vector/list will be the all_plots list.
The two input vector/list have to have the same length.
# save plots
map2(.x = paste0(countries_to_plot, ".png"),
     .y = plots$plot,
     function(x,y) ggsave(filename = x, plot = y))
Discussion
What do you think about this for loop replacement? Do you find it more clear or just more complex?
4. References
- Beautiful custom functions in R
- Richie Cotton DataCamp Introduction to Writing Functions in R
- Tidy evaluation
- Exploring Non-Standard Evaluation
- Programming with dplyr
- Practical tidy evaluation
- Stanford Data Challenge Lab (DCL)
Key Points
A function in R consist of a name, one or several arguments, a body and an execution environment.
Functions can avoid code repetition and their associated mistake.
The name of a function should contain a verb to describe its action.
Vectorised operations allow to replace for loops and make your code more readable and maintanable.