Introduction
Overview
Teaching: 30 min
Exercises: 0 minQuestions
What will I learn during this workshop?
What are the tools that I will be using?
What are the tidy data principles?
What is working in a more open way beneficial?
Objectives
Discover a complete data analysis process revolving around the tidy principles.
Learn how to increase your data analysis efficacy
Table of contents
1. Overview
Welcome!
In this training you will learn R, RStudio, git, and GitHub. You will learn modern data science with R and the tidyverse suite of packages. It’s going to be fun and empowering! You will learn a reproducible workflow that can be used in research and analyses of all kinds.
In particular, you will learn about the concept of literate programming, a concept coined by Donald Kuth where a program code is made primarily to be read and understood by other people, and secondarily to be executed by the computer. This means that literate programs are very easy to understand and share, as all the code is well explained.
This training will get acquainted with these skills and best practices, you will get comfortable with a workflow that you can use in your own projects. Overall, you will
Three main takeaways
- Modern data transformation and visualization (R/RStudio,
tidyverse).- Collaborative version control (
git/GitHub).- Associating code and its description through literate programming (R Markdown/GitHub).
1.1 What to expect
This is going to be a fun workshop.
The plan is to expose you to a lot of great tools that you can have confidence using in your research. You’ll be working hands-on and doing the same things on your own computer as we do live on up on the screen. We’re going to go through a lot in these two days and it’s less important that you remember it all. More importantly, you’ll have experience with it and confidence that you can do it. The main thing to take away is that there are good ways to approach your analyses; we will teach you to expect that so you can find what you need and use it! A theme throughout is that tools exist and are being developed by real, and extraordinarily nice, people to meet you where you are and help you do what you need to do. If you expect and appreciate that, you will be more efficient in doing your awesome science.
You are all welcome here, please be respectful of one another. You are encouraged to help each other. We abide to the Carpentries Code of Conduct.
Everyone in this workshop is coming from a different place with different experiences and expectations. But everyone will learn something new here, because there is so much innovation in the data science world. Instructors and helpers learn something new every time, from each other and from your questions. If you are already familiar with some of this material, focus on how we teach, and how you might teach it to others. Use these workshop materials not only as a reference in the future but also for talking points so you can communicate the importance of these tools to your communities. A big part of this training is not only for you to learn these skills, but for you to also teach others and increase the value and practice of open data science in science as a whole.
1.2 What you will learn
- how to think about data
- how to think about data separately from your research questions.
- how and why to tidy data and analyze tidy data, rather than making your analyses accommodate messy data.
- how there is a lot of decision-making involved with data analysis, and a lot of creativity.
- how to increase efficiency in your data science
- foster reproducibility for you and others.
- facilitate collaboration with others — especially your future self!
- how Open Science is a great benefit
- Open Science is often good science: reproducible, clear, easy to share and access.
- broaden the impact of your work.
- ameliorate your scientific reputation.
- how to learn with intention and community
- think long-term instead of only to get a single job done now.
- the #rstats online community is fantastic. The tools we’re using are developed by real people. Real, nice people. They are building powerful and empowering tools and are welcoming to all skill-levels.
1.3 Be persistent
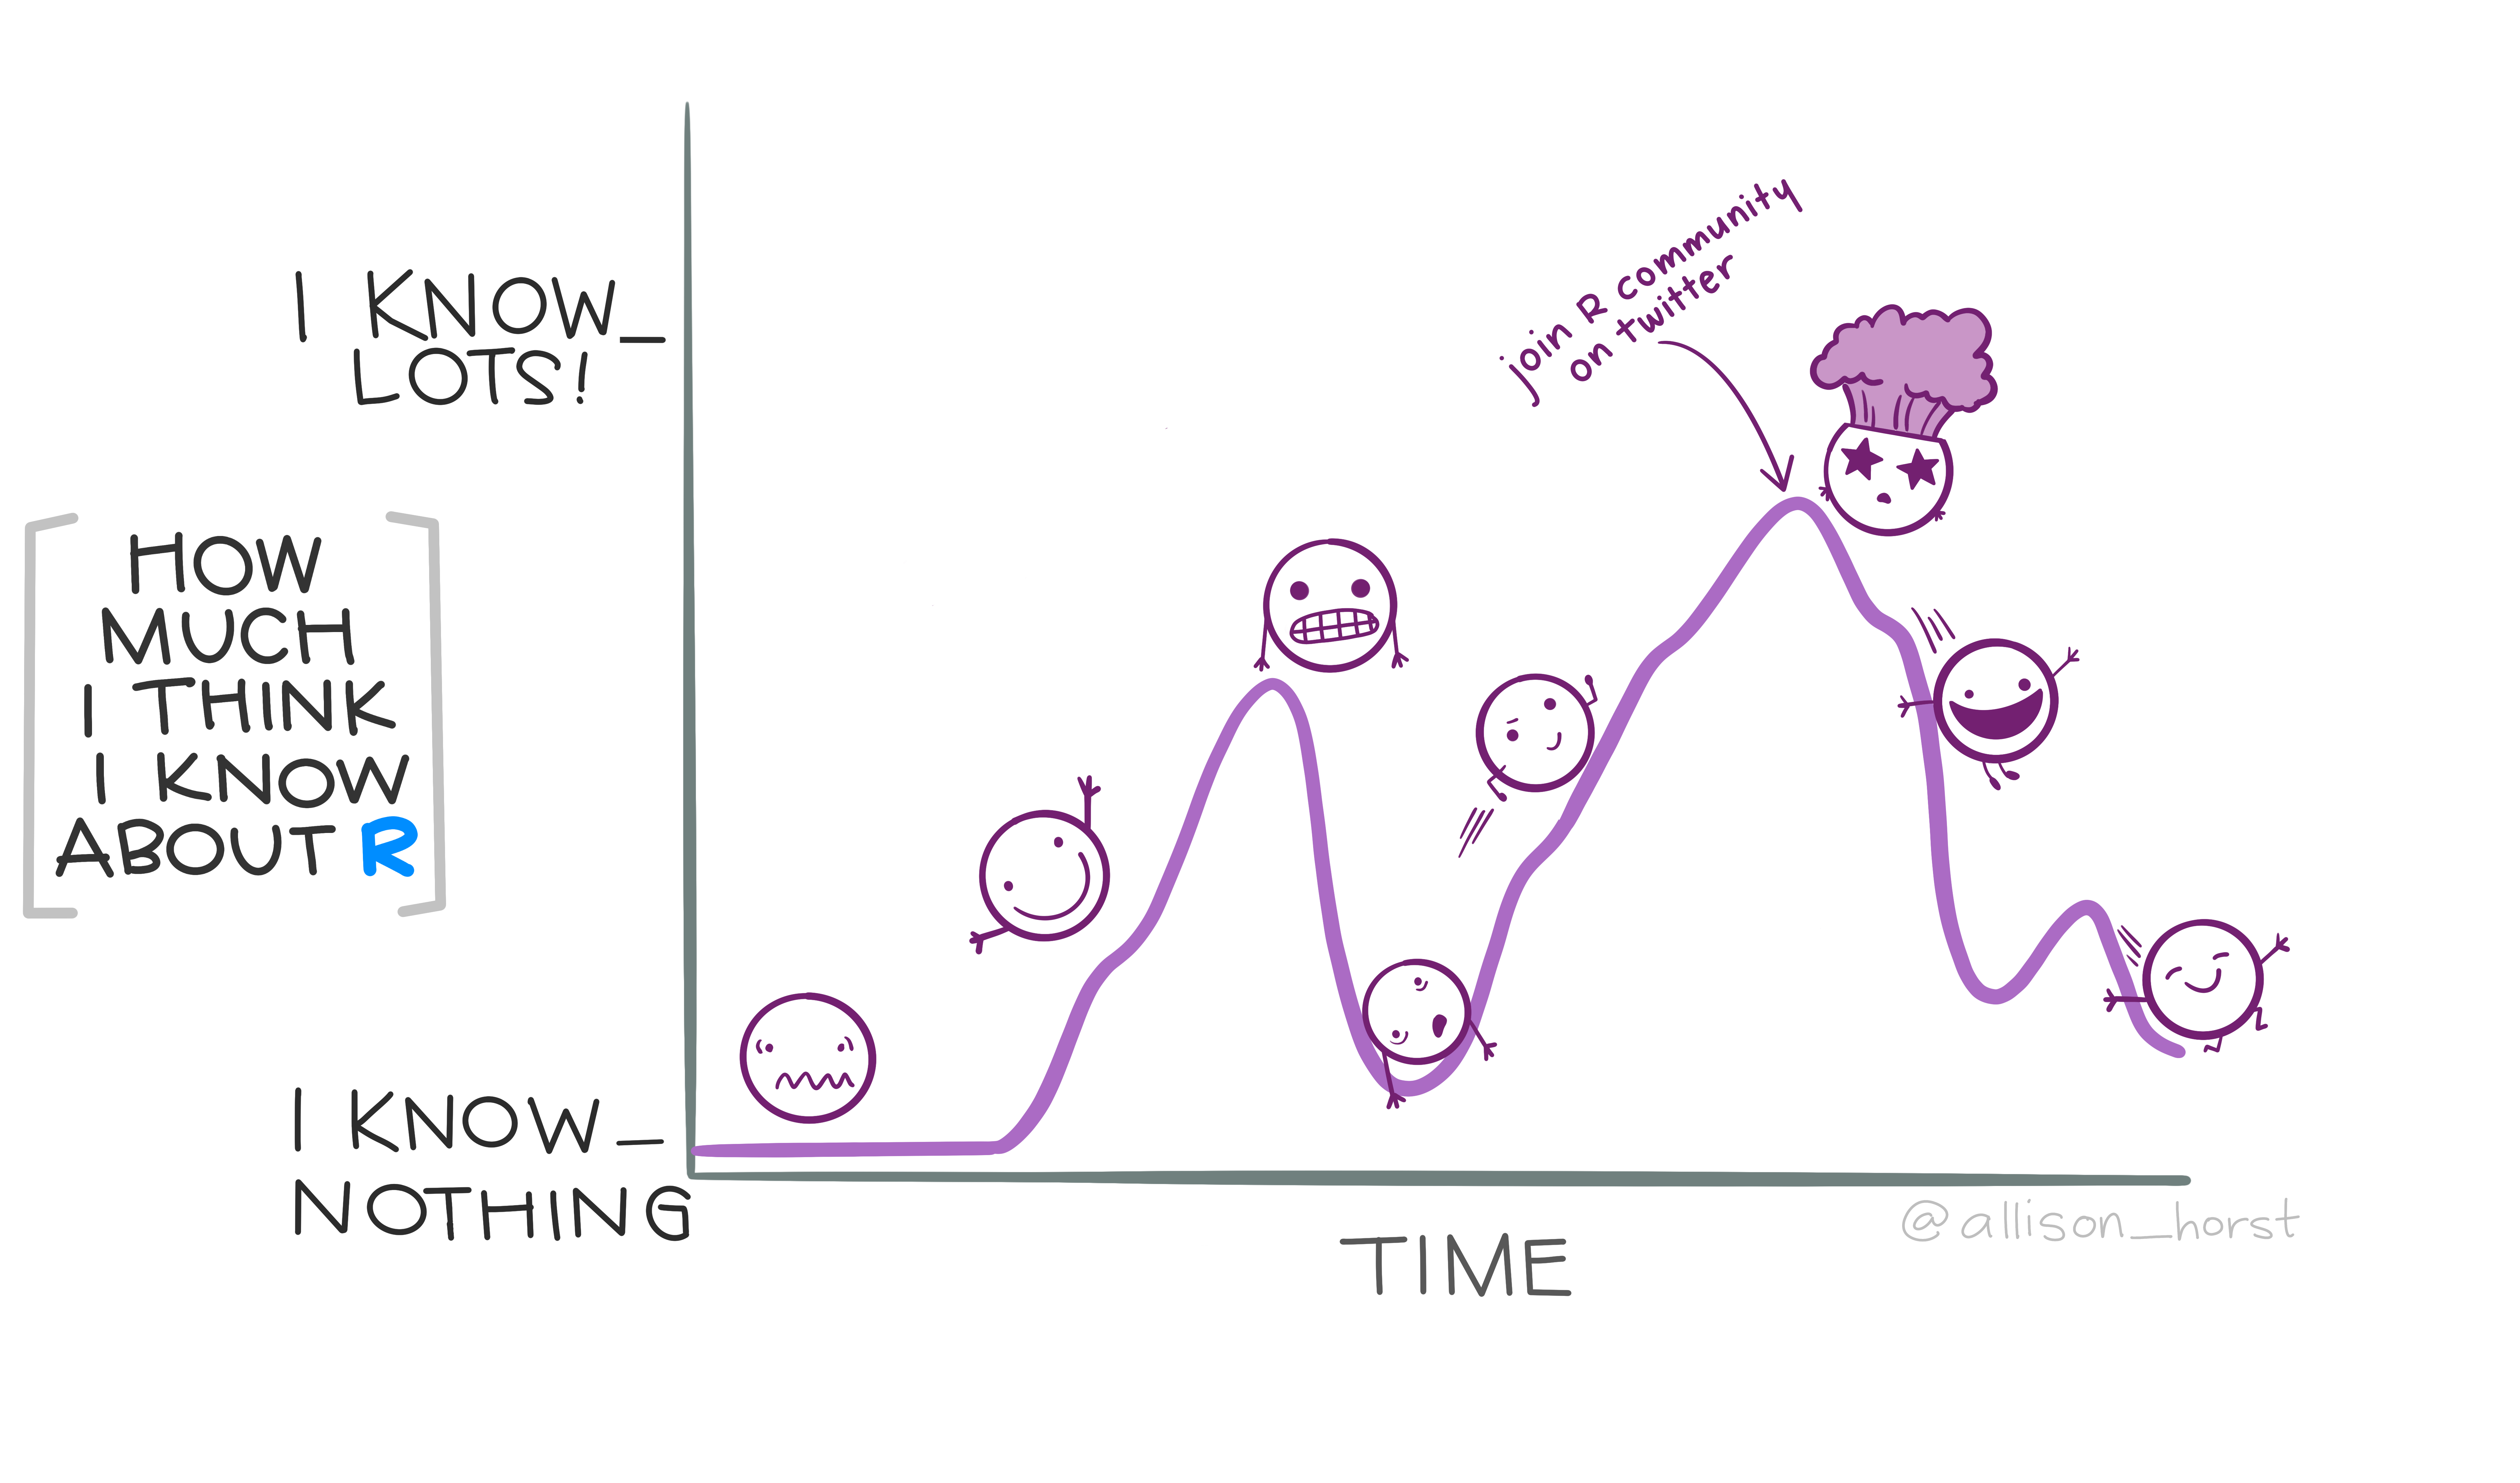
Learning a new programming language such as R and a new theme (data analysis) is not an easy task. Also, there is literally no end to learning, you will always find a better more smooth way to do things, a new package recently developed etc.
2. The tidy data workflow
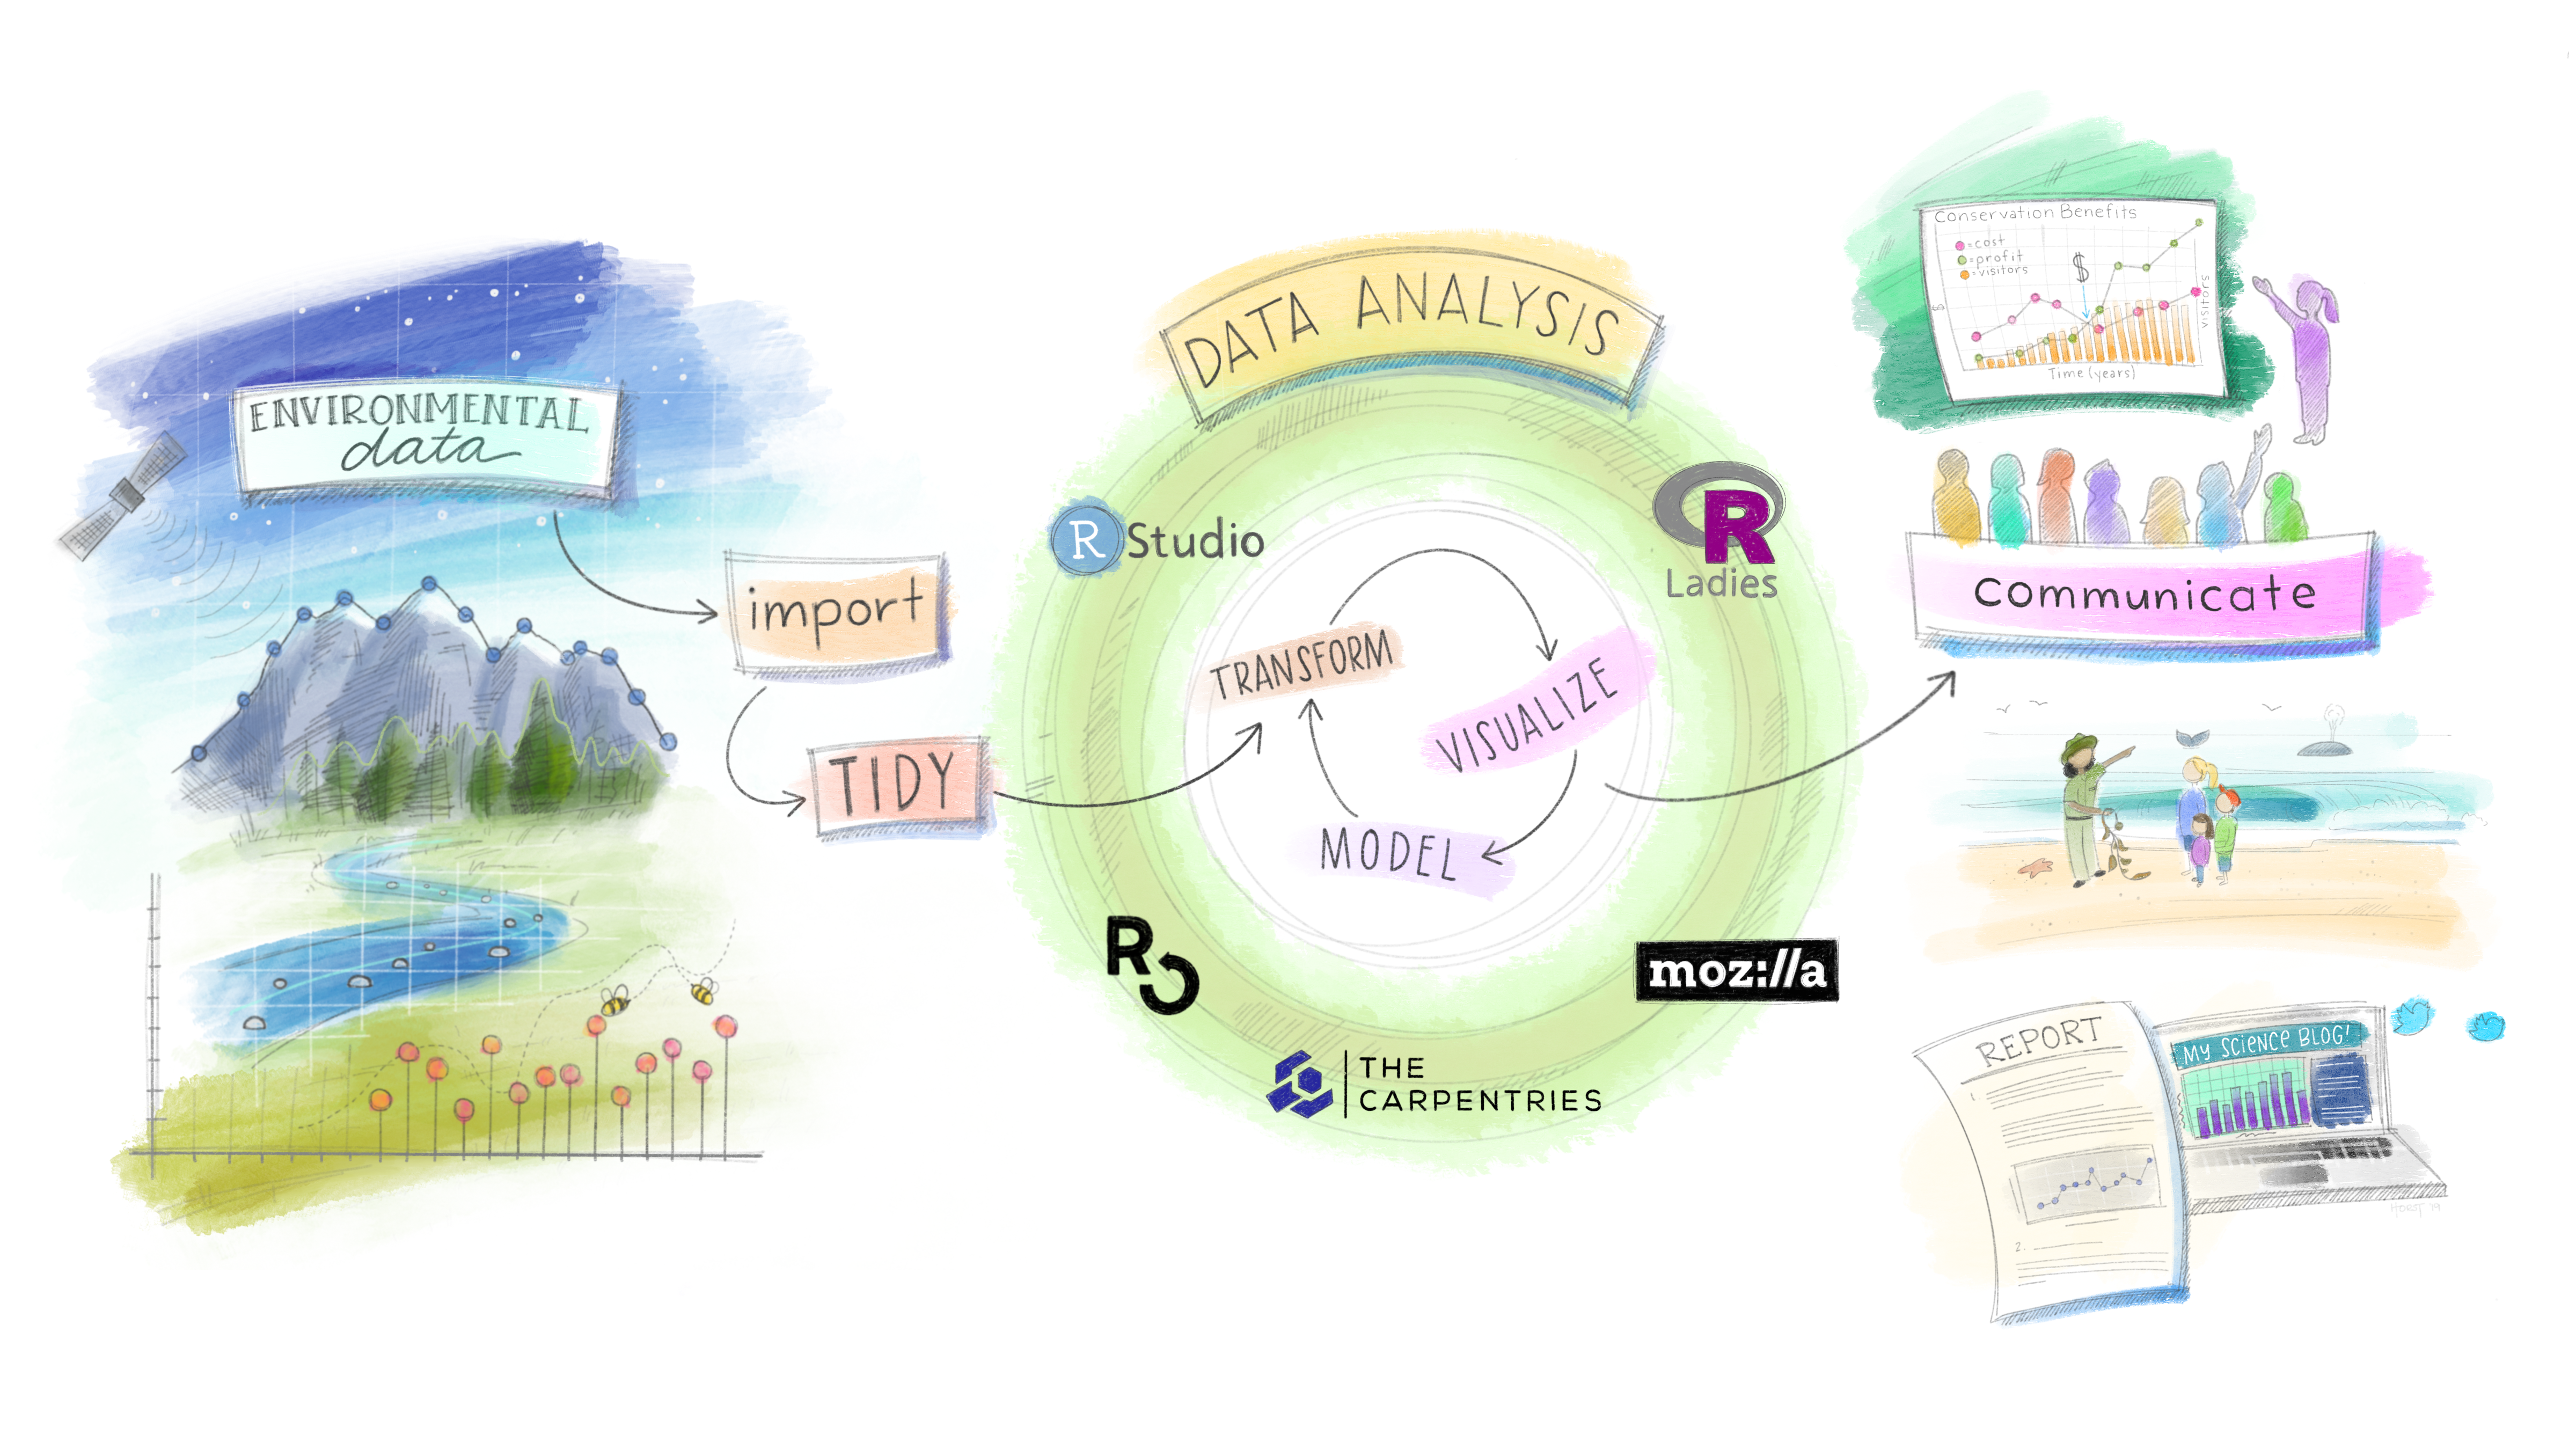
We will be learning about tidy data. And how to use a tidyverse suite of tools to work with tidy data.
Hadley Wickham and his team have developed a ton of the tools we’ll use today. Here’s an overview of techniques to be covered in Hadley Wickham and Garrett Grolemund of RStudio’s book R for Data Science:
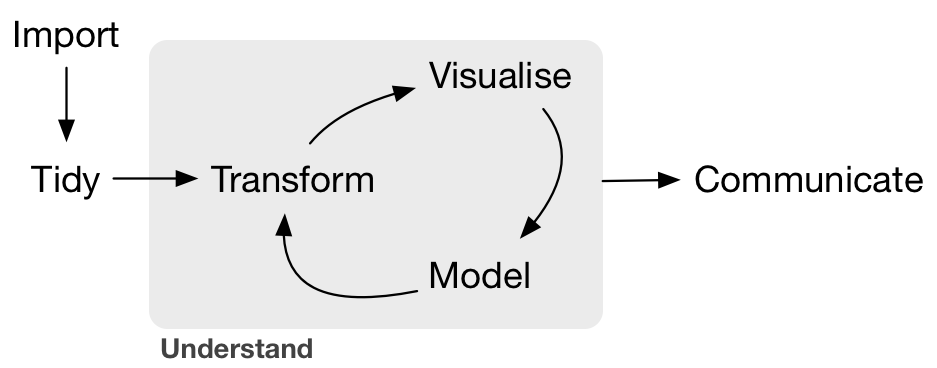
We will be focusing on:
- Tidy:
tidyrto organize rows of data into unique values. - Transform:
dplyrto manipulate/wrangle data based on subsetting by rows or columns, sorting and joining. - Visualize:
ggplot2static plots, using grammar of graphics principles. - Communicate: dynamic documents with
knitrto produce R Markdown notebooks.
This is really critical. Instead of building your analyses around whatever (likely weird) format your data are in, take deliberate steps to make your data tidy. When your data are tidy, you can use a growing assortment of powerful analytical and visualization tools instead of inventing home-grown ways to accommodate your data. This will save you time since you aren’t reinventing the wheel, and will make your work more clear and understandable to your collaborators (most importantly, Future You).
Reference: original paper about tidy datasets from Hadley Wickham.
2.1 Learning with public datasets
One of the most important things you will learn is how to think about data separately from your own research context. Said in another way, you’ll learn to distinguish your data questions from your research questions. Here, we are focusing on data questions, and we will use data that is not specific to your research.
We will be using several different data sets throughout this training, and will help you see the patterns and parallels to your own data, which will ultimately help you in your research.
2.2 Emphasizing collaboration
Collaborating efficiently has historically been really hard to do. It’s only been the last 20 years or so that we’ve moved beyond mailing things with the postal service. Being able to email and get feedback on files through track changes was a huge step forward, but it comes with a lot of bookkeeping and reproduciblity issues (did I do my analyses with thesis_final_final.xls or thesis_final_usethisone.xls?). But now, open tools make it much easier to collaborate.
Working with collaborators in mind is critical for reproducibility. And, your most important collaborator is your future self. This training will introduce best practices using open tools, so that collaboration will become second nature to you!
2.3 By the end of the course
By the end of the course, you’ll wrangle a few different data sets, and make your own graphics that you’ll publish on webpages you’ve built collaboratively with GitHub and RMarkdown. Woop!
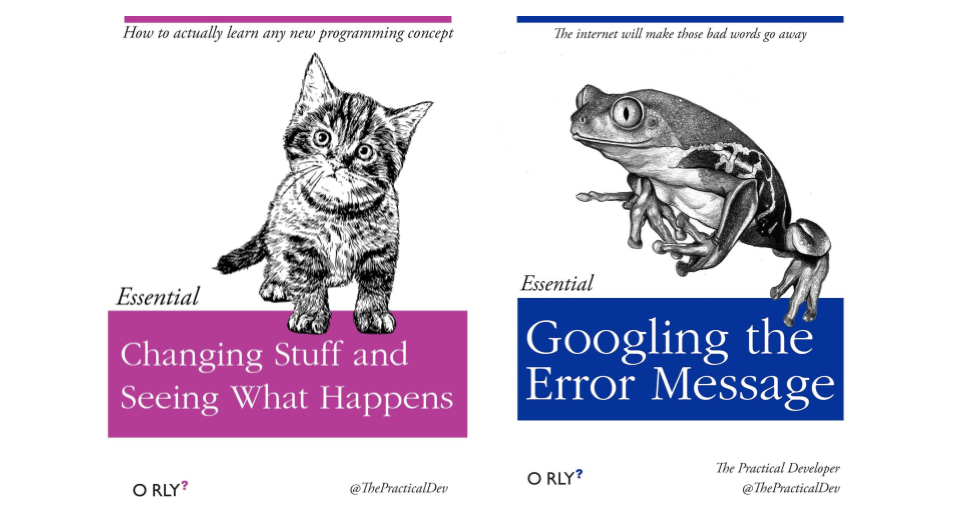
Here are some important things to keep in mind as you learn (these are joke book covers):
3. Credits
This lesson has been formatted according to the Carpentries Foundation lesson template and following their recommendations on how to teach researchers good practices in programming and data analysis.
This material builds from a lot of fantastic materials developed by others in the open data science community. Most of the content derives from the Ocean Health Index Data Science Training which are greatly acknowledge for the quality of their teaching materials.
It also pulls from the following resources, which are highly recommended for further learning and as resources later on. Specific lessons will also cite more resources.
- R for Data Science by Hadley Wickham and Garrett Grolemund
- STAT 545 by Jenny Bryan
- Happy Git with R by Jenny Bryan
- Software Carpentry by the Carpentries
- Artwork from @juliesquid for @openscapes (illustrated by @allison_horst).
- Artwort from @allisonhorst rstats illustrations
Key Points
Tidy data principles are essential to increase data analysis efficiency and code readability.
Using R and RStudio, it becomes easier to implement good practices in data analysis.
I can make my workflow more reproducible and collaborative by using git and Github.