Running commands with Snakemake
Placeholders and wildcards
Chaining rules
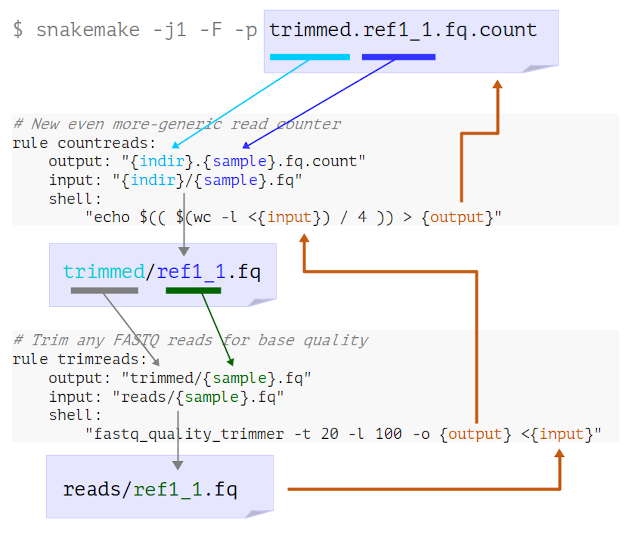
Figure 1
Image 1 of 1: ‘A visual representation of the above process showing the rule definitions, with arrows added to indicate the order wildcards and placeholders are substituted. Blue arrows start from the final target at the top, which is the file trimmed.ref1_1.fq.count, then point down from components of the filename to wildcards in the output of the countreads rule. Arrows from the input of this rule go down to the output of the trimreads rule. Orange arrows then track back up through the shell parts of both rules, where the placeholders are, and finally back to the target output filename at the top.’

Complex outputs, logs and errors
How Snakemake plans its jobs
Figure 1
Image 1 of 1: ‘Diagram showing jobs as coloured boxes joined by arrows representing data flow. The box labelled as kallisto_index is in green at the top, with two blue boxes labelled trimreads and two yellow boxes labelled countreads. The blue trimreads boxes have arrows into the respective yellow countreads boxes. Finally there is a kallisto_quant job shown as a red box, with incoming arrows from both the trimreads box as well as the kallisto_index box.’
Figure 2
Image 1 of 1: ‘A DAG for the partial workflow with four boxes, representing two trimreads jobs and a kallisto_index job, then a kallisto_quant job receiving input from the previous three, The boxes for the kallisto_index and trimreads jobs are dotted, but the kallisto_quant box is solid.’

Processing lists of inputs
Handling awkward programs
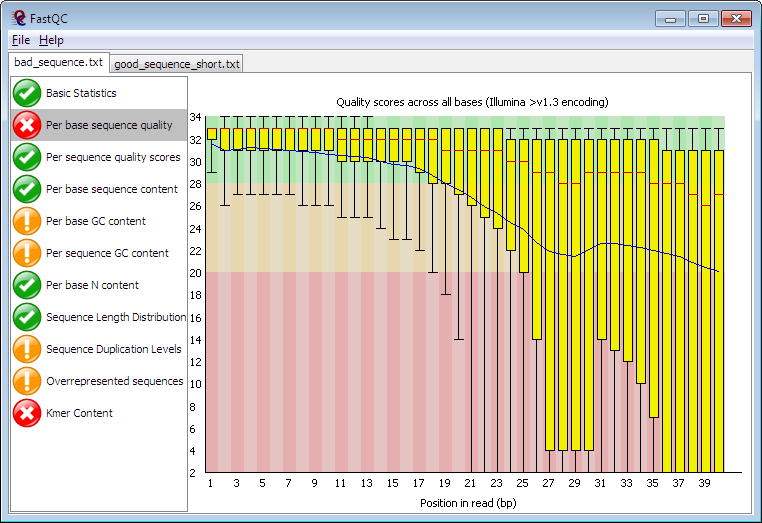
Figure 1
Image 1 of 1: ‘Screenshot of a typical FastQC report specifically showing the per-base quality box-and-whisker plot. This is one of eleven views that are shown as a selectable list in the application window. The plot itself shows vertical yellow bars that get increasingly taller and lower from left to right, indicating how the base quality in these short reads deteriorates as the run progresses. There is a red X icon next to this plot, while other views listed have green ticks or yellow exclamation point icons.’

Finishing the basic workflow
Figure 1
Image 1 of 1: ‘Summary of our full QC workflow with icons representing the steps listed above. The input data is also summarized, with 18 paired FASTQ files under yeast/reads, for the three repeats of all three conditions, as well as the transcriptome in gzipped FASTA format.’
Configuring workflows
Optimising workflow performance
Figure 1
Image 1 of 1: ‘Representation of a computer with four microchip icons indicating four available cores. To the right are five small green boxes representing Snakemake jobs and labelled as wanting 1, 1, 1, 2 and 8 threads respecively.’
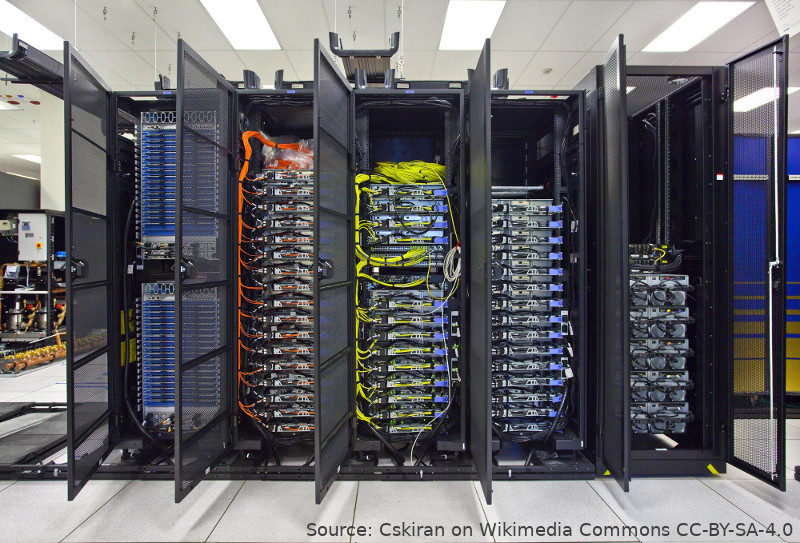
Figure 2
Image 1 of 1: ‘A photo of some high performance computer hardware racked in five cabinets in a server room. Each cabinet is about 2.2 metres high and 0.8m wide. The doors of the cabinets are open to show the systems inside. Orange and yellow cabling is prominent, connecting ports within the second and third racks.’

Conda integration
Constructing a whole new workflow
Figure 1
Image 1 of 1: ‘A box-and-arrow representation of the cutadapt, concatenation, and assembly steps in the above script, with the names of the six files from the three ref samples in pairs at the top. Arrows come down from each pair of files into a corresponding cutadapt box, then under this the arrows cross as they go from the three cutadapt boxes to the two boxes labelled "concatenate". Under this is a single box labelled "assembly (velvet)" and a final box at the bottom labelled "find longest contig".’
