The Importance of Message
Last updated on 2023-12-18 | Edit this page
Overview
Questions
- What is a chart?
- What is the purpose of a chart?
- What do we need to make a chart?
- Why is chart message so important?
Objectives
- Define what a chart is
- Explain the purpose of a chart
- Identify the components of a chart
- Explain the importance of a chart’s message
What is a chart?
A chart is a visual representation of the relationships among data elements. A visual representation allows people to see and quickly comprehend relationships among data elements by processing the information in the brain’s visual cortex1.
Purpose of a chart
The purpose of a chart is to communicate. An effective chart clearly communicates a message to the viewer. An ineffective chart confuses the viewer because it contains no message or several muddled messages.
Components of a chart
The individual pieces that we need to build a chart are:
- Data arranged in a table
- A message about the data
- Graphical elements
An imbalance in any of these components will make a chart ineffective or impossible:
- Without data, a chart has no information to communicate
- Without a message, a chart has nothing clear to say about the data
- Without graphics, a chart cannot visualize information
In this episode, we will talk about data, tables, and messages. We will address graphical elements in the next episode.
Why no software?
It may seem odd that the key components of a chart do not include software. While software is a useful tool for chart-making, it is not strictly necessary. You can create an effective chart by hand as long as you have the three essential chart components: a table of data, a message about the data, and graphical elements. Software can help you arrive at these three components more quickly, but it cannot automatically create an effective chart on its own. An effective chart communicates, and communication is a human activity.
Prepare the data
We need to prepare data before attempting to visualize it in a chart. This process is often called “cleaning.” A thorough overview of data cleaning is outside the scope of this lesson, but here are some guidelines.
Clean data is summarizable, countable, and calculable. This means that the data table contains no:
- White spaces before or after data in each cell
- Outliers, nulls, missing data, or empty cells
- Formatting, such as color coding, bold, or italicized text
For efficient data analysis and visualization, cleaned data must also be made tidy. Tidy data2 means:
- Columns are for variables
- Rows are for observations
- One value per cell
Resources for learning about cleaning data
- The Data Carpentry Ecology Data in Spreadsheets lesson offers step-by-step instructions for managing, cleaning, and tidying tabular data to prepare it for analysis
- Broman, K. W., & Woo, K. H. (2018). Data organization in spreadsheets (e3183v2). PeerJ Inc. https://doi.org/10.7287/peerj.preprints.3183v2
The role of tables
A table is necessary for making a chart, but is not a substitute for a chart. A table must be read to convey its information. Reading a data table makes it difficult to understand any patterns that might be present in the data. Consider this data table:
| Average Monthly Temperature (°F) | Daily Walks per Dog |
|---|---|
| 30 | 0 |
| 35 | 1 |
| 45 | 1 |
| 55 | 2 |
| 65 | 3 |
| 78 | 2 |
| 80 | 2 |
| 88 | 1 |
| 70 | 3 |
| 60 | 3 |
| 45 | 1 |
| 35 | 0 |
Take 1 minute to read the table and discuss it with your neighbor. How easy or difficult is it to understand the data? What patterns can you detect?
From table to chart
To create a chart from a table, data elements recorded in different
columns of the table are arranged along the x and
y axes of a Cartesian plane.
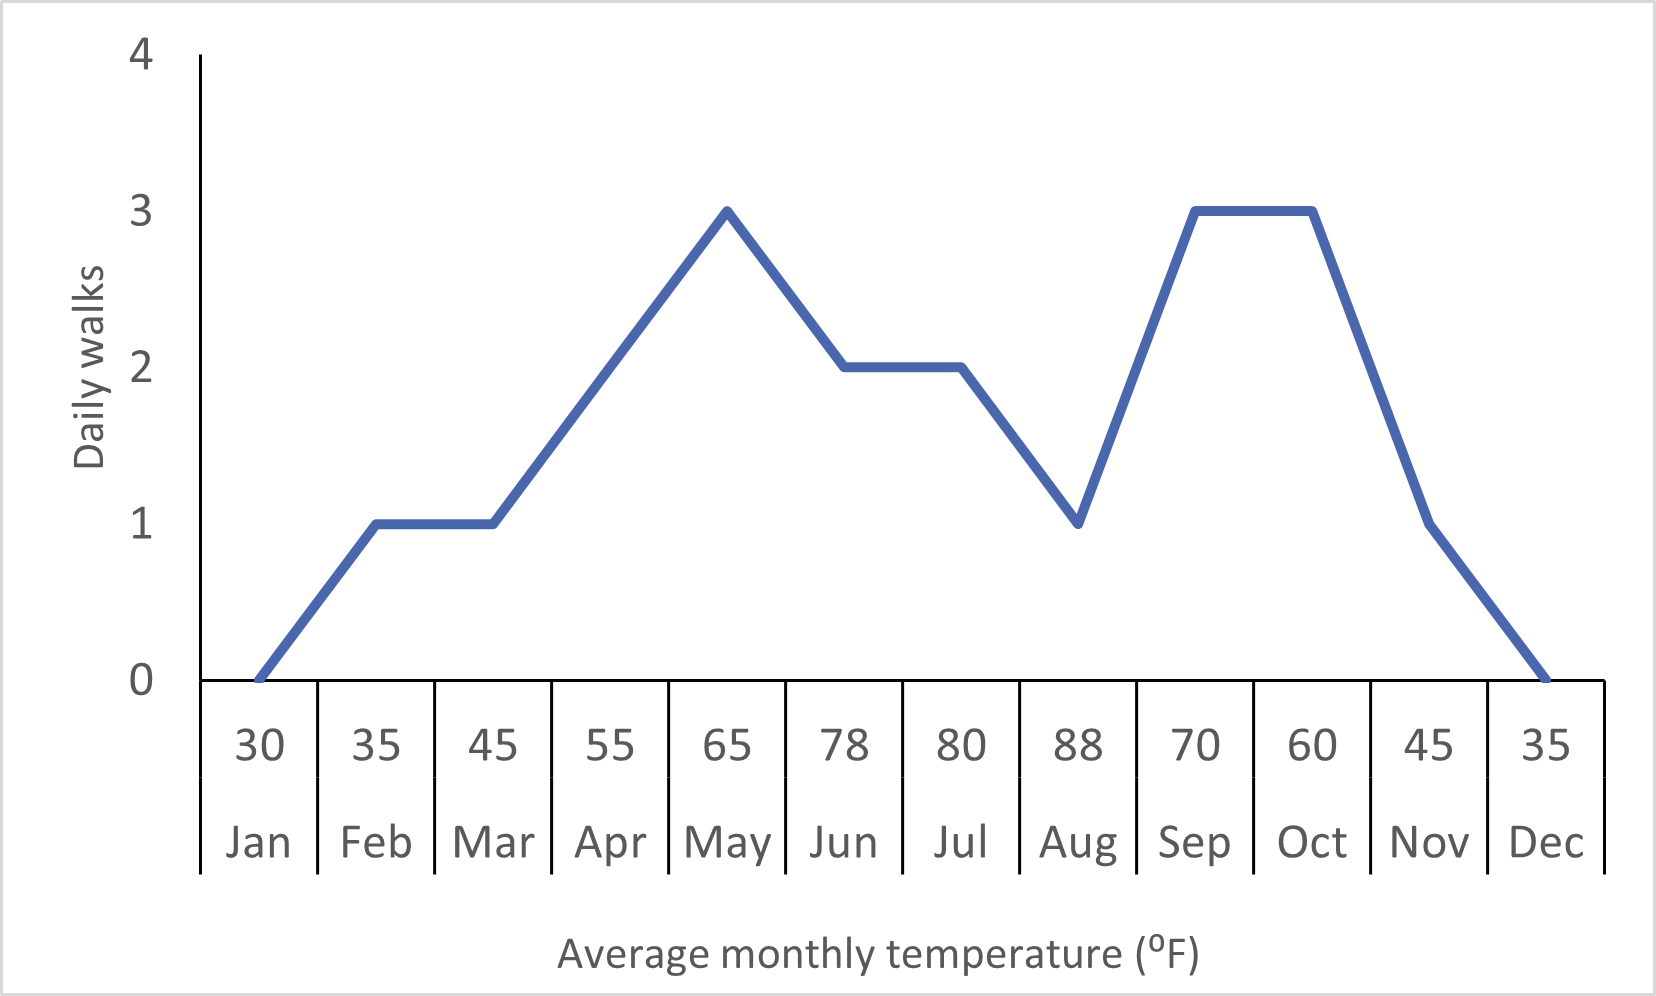
If we arrange the data points for Average Monthly Temperature along
an x axis and the data points for Daily Walks per Dog along
a y axis, we can connect the places where those data points
intersect to create this chart:
Take 1 minute to view the chart and discuss it with your neighbor. How easy or difficult is it to understand the data? What patterns can you detect?
Chart message
The relationship between the two elements that emerges when
x is plotted against y creates the message of
the chart3. This message is one sentence that
describes the relationship that the chart visualizes. This single
sentence becomes the title of your chart. If you are having trouble
stating the relationship in one sentence, you may have too many
relationships for one chart.
It takes practice to identify and articulate a message for a chart, but knowing where it comes from is a first step. You’ll practice this skill more during subsequent episodes.
Challenge: Identify a chart message
Choose the sentence that best describes the relationship depicted in the chart above:
- Dogs get fewer daily walks during seasonal temperature extremes.
- Monthly average temperature varies during the year.
- Dogs get between 0 and 4 walks daily.
The correct answer is 1. This sentence describes an interaction
between seasonal temperature and number of daily walks. These are the
two data elements plotted on the x and y axes
of this chart.
Importance of Chart Message
Clearly-imparted information - messages - about relationships within a set of data drive problem-solving and decision-making about the entities represented by the data. These solutions and decisions have real-world consequences.
In this lesson we will use a dataset about large North American canids: wolves, coyotes, and foxes4. Public policy and scientific decisions have drastically changed these populations over the past century. The presence or absence of these animals near population centers, livestock, and nature preserves stirs public debate in the present day. You will practice communicating scientific information about large North American canids in messages and charts that the public can understand.
- A chart visualizes data relationships in a format that people can see instead of read.
- The purpose of a chart is to communicate.
- Data arranged in a table and a message about the data are two of the three components of a chart.
- A chart’s message drives decision-making and problem-solving.
Bertin, J. (1981). Graphics and graphic information-processing (W. J. Berg & P. Scott, Trans.). de Gruyter.↩︎
Wickham, H. 2014. “Tidy Data.” Journal of Statistical Software 59 (10). 10.18637/jss.v059.i10 https://doi.org/10.18637/jss.v059.i10↩︎
Bertin, J. (1981). Graphics and graphic information-processing (W. J. Berg & P. Scott, Trans.). de Gruyter.↩︎
Newsome, T. M. & Ripple, W. J. (2015). Data from: A continental scale trophic cascade from wolves through coyotes to foxes, Dryad, Dataset, https://doi.org/10.5061/dryad.s0d20↩︎