All Images
Introduction
Resource Requirements
Figure 1

Figure 2

Scheduler Tools
Scaling Study
Figure 1
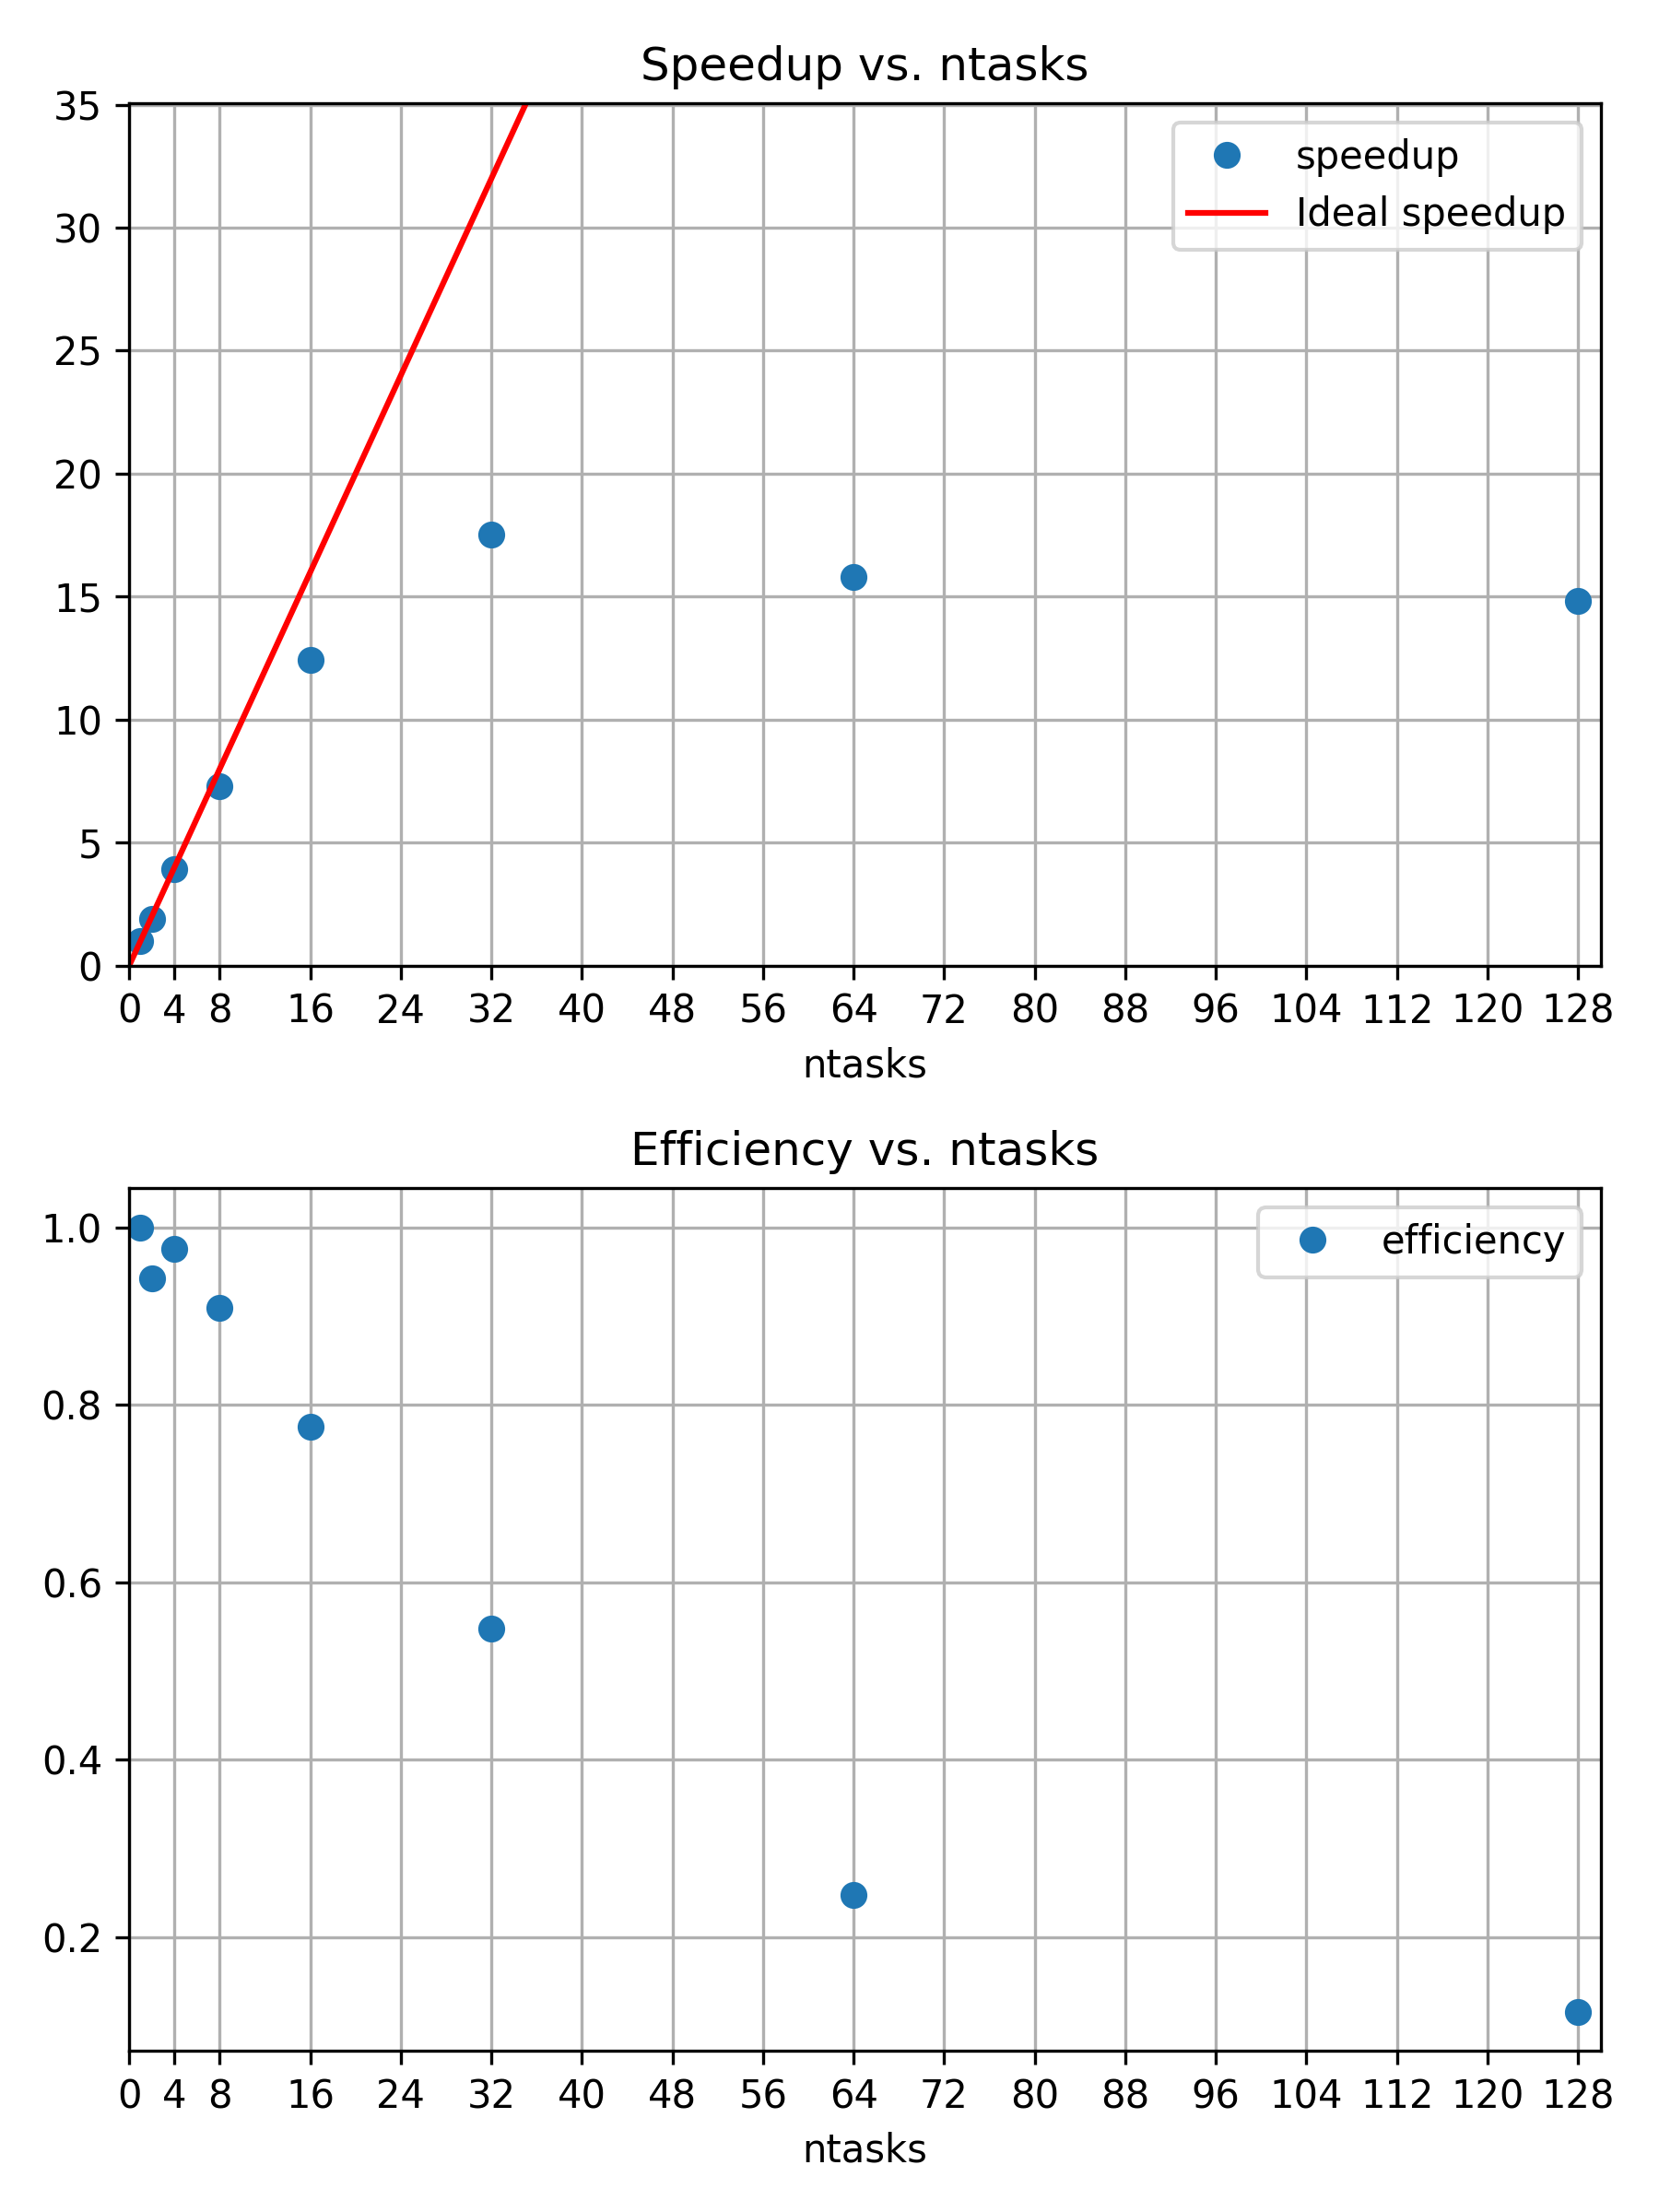
Speedup and efficiency of strong scaling
example
Figure 2

Three snowmen in 800x800 with 128 samples per
pixel
Figure 3

Three snowmen in 800x800 with 8192 samples per
pixel
Figure 4
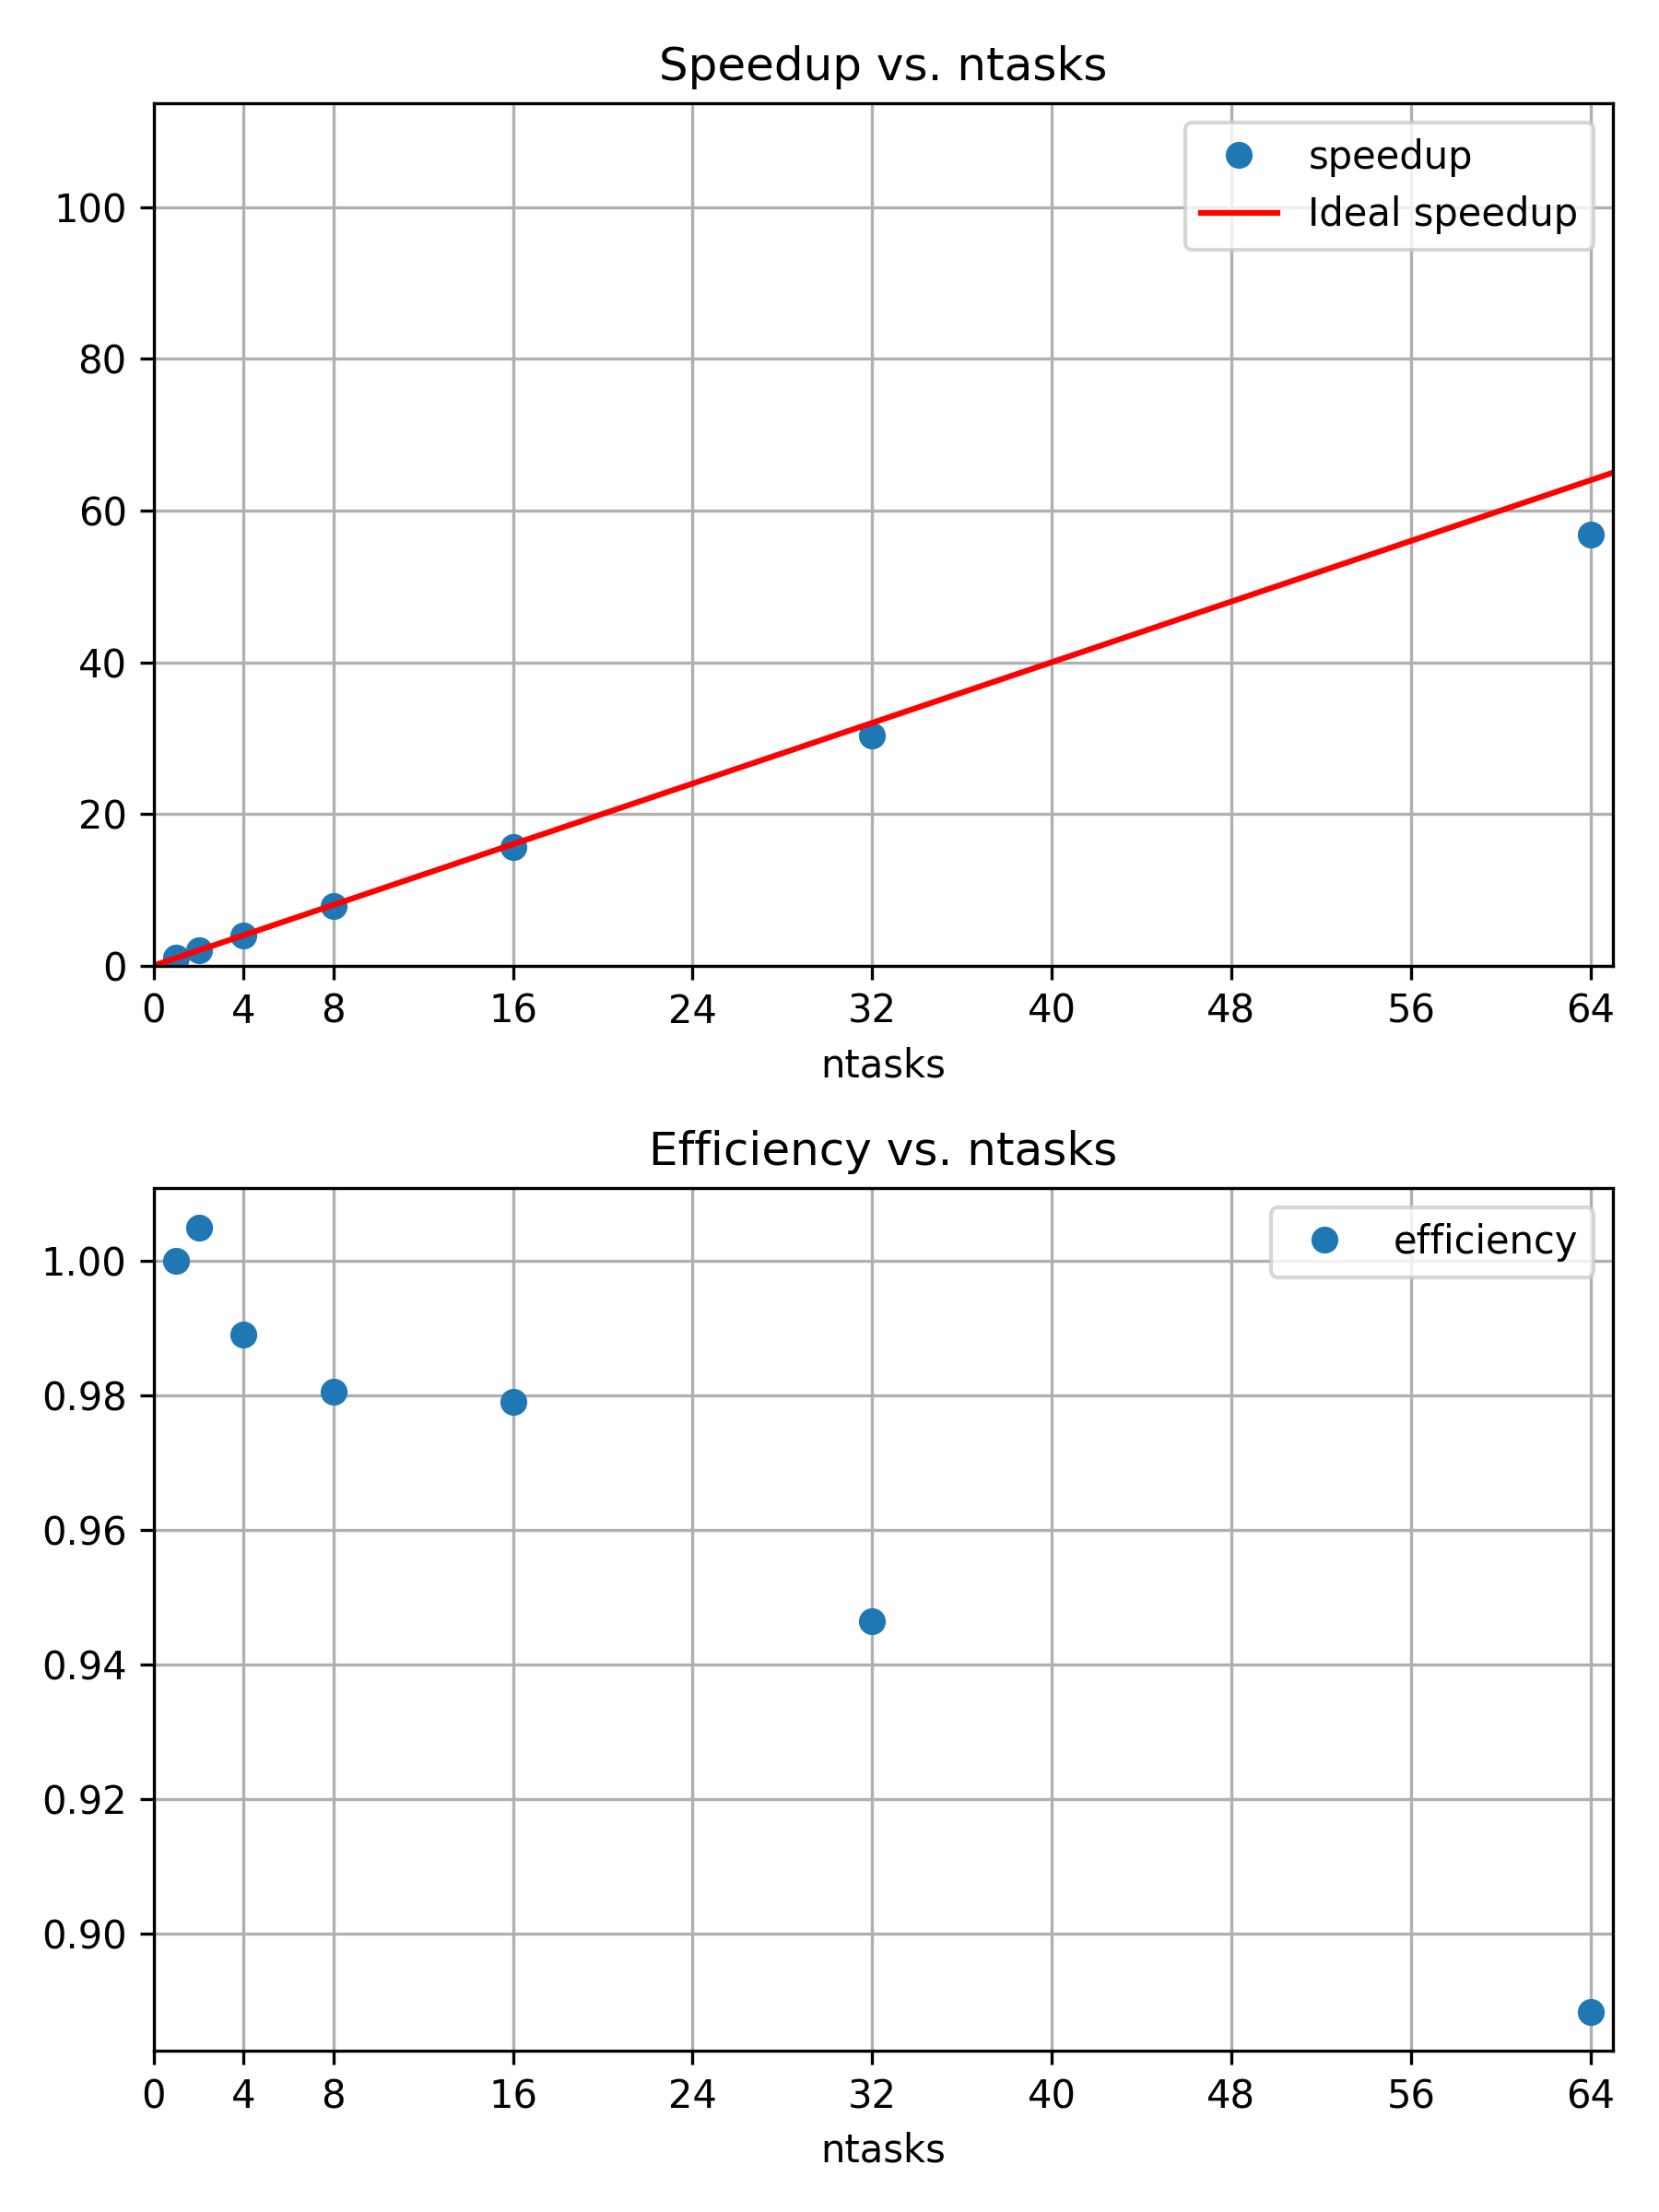
Speedup and efficiency of weak scaling
example
Performance Overview
Figure 1
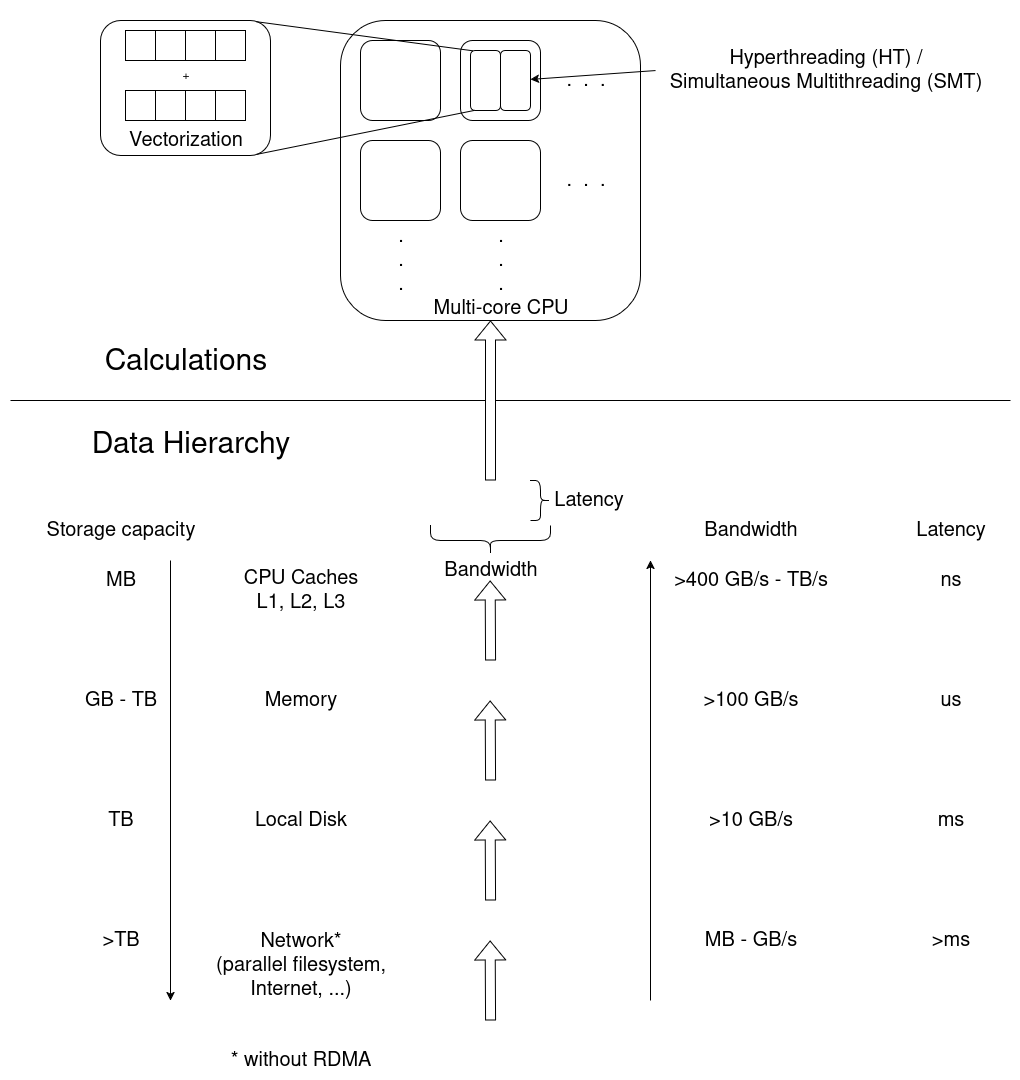
The underlying hardware frames any performance
analysis. Calculations are performed in multiple cores, potentially
multiple threads per core, and even in vectorized instructions where a
single operation is applied to multiple sets of data in a single
instruction. Data moves through the data hierarchy to CPU cores, where
each level “closer” to the CPU has a smaller storage capacity, but
larger bandwidth and smaller latencies, improving access
performance.
Figure 2

ClusterCockpits main menu. Select “My Jobs” to
see a list of the jobs associated to your account.
Figure 3
Figure 4
Figure 5
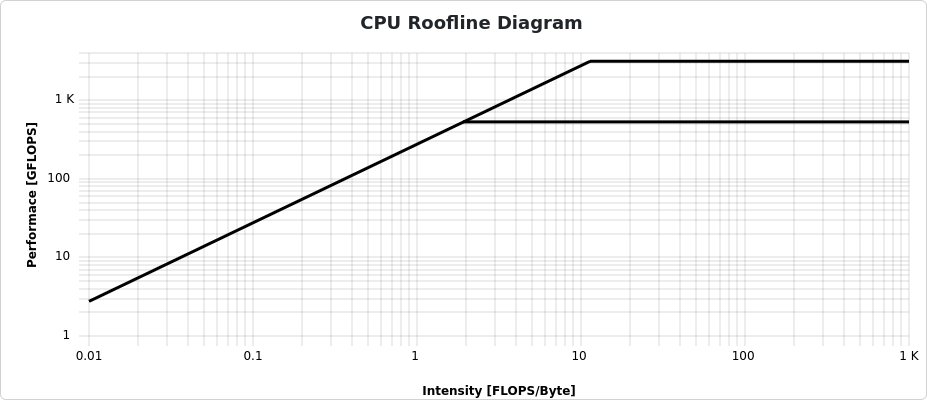
Figure 6

Figure 7
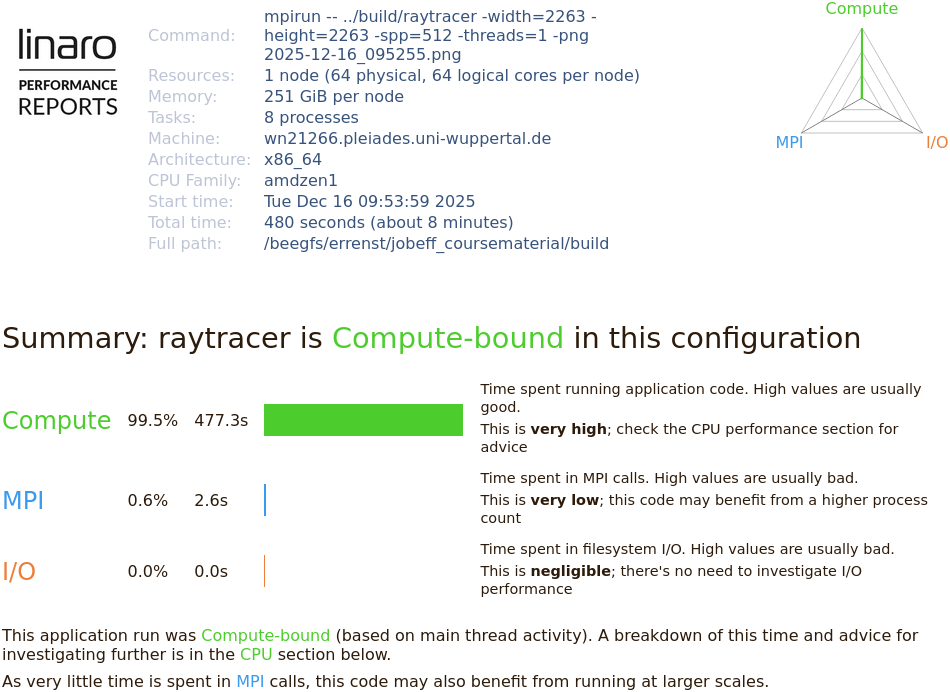
Figure 8
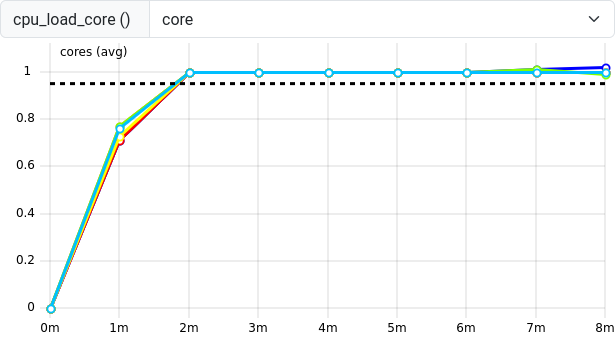
Figure 9
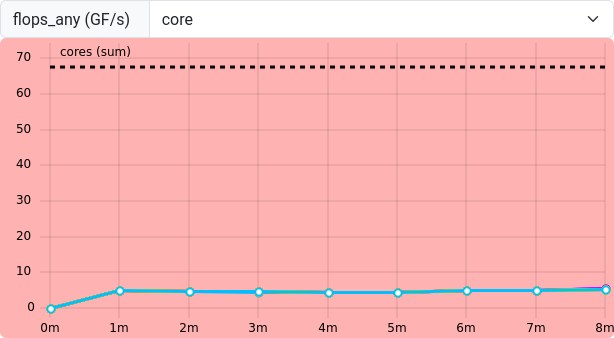
Figure 10
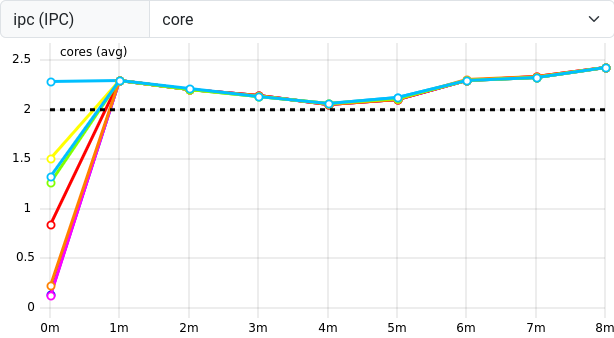
Figure 11
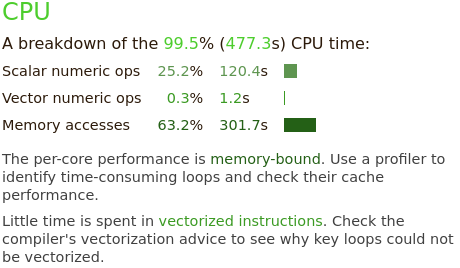
Figure 12
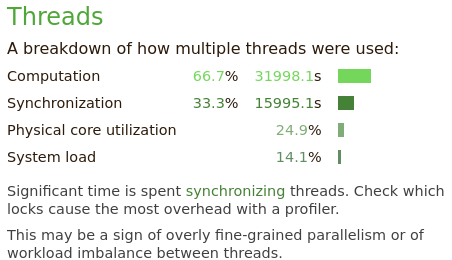
Figure 13
Figure 14
Figure 15
Figure 16
Figure 17

Figure 18
Figure 19
Figure 20
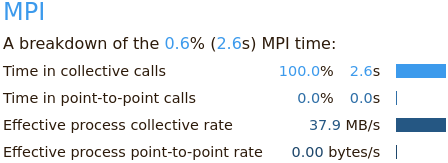 Performance Reports
also summarizes the applications behavior in terms of MPI calls,
e.g. time spent in collective calls involving all processors, or
point-to-point communications.
Performance Reports
also summarizes the applications behavior in terms of MPI calls,
e.g. time spent in collective calls involving all processors, or
point-to-point communications.
Figure 21
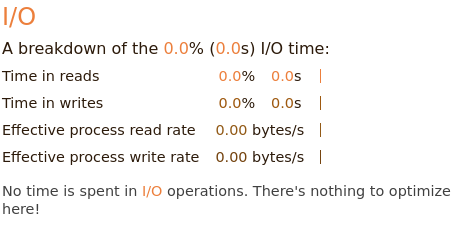 The I/O block
summarizes measurements of interactions with the local file systems.
Here, no I/O operations are affecting the applications performance at
all.
The I/O block
summarizes measurements of interactions with the local file systems.
Here, no I/O operations are affecting the applications performance at
all.