Exploring high dimensional data
Overview
Teaching: 20 min
Exercises: 2 minQuestions
What is a high dimensional dataset?
Objectives
Define a dimension, index, and observation
Define, identify, and give examples of high dimensional datasets
Summarize the dimensionality of a given dataset
Introduction - what is high dimensional data?
What is data?
da·ta
/ˈdadə, ˈdādə/ noun “the quantities, characters, or symbols on which operations are performed by a computer”
—Oxford Languages
(how is data formatted? structured, semi-structured, unstructured: flat file, json, raw text)
There is a conversion to numerical representation happening here
A rectangular dataset: Original data set not rectangular, might require conversion that produces high dimensional rectangular data set.
We’re discussing structured, rectangular data only today.
What is a dimension?
di·men·sion
/dəˈmen(t)SH(ə)n, dīˈmen(t)SH(ə)n/
noun noun: dimension; plural noun: dimensions
- a measurable extent of some kind, such as length, breadth, depth, or height.
- an aspect or feature of a situation, problem, or thing.
—Oxford Languages
A Tabular/Rectangular Data Context

Each row is an observation, is a sample.

Each column is a feature, is a dimension.

The index is not a dimension.

A Dataset
- Some number of observations > 1
- every feature of an observation is a dimension
- the number of observations i.e. the index, is not a dimension
Examples of datasets with increasing dimensionality
1 D
- likert scale question (index: respondent_id, question value (-3 to 3)
2 D
- scatter plot (x, y)
- two question survey (index: respondent_id, q1 answer, q2 answer)
- data from temperature logger: (index: logged_value_id, time, value)
3 D
- surface (x, y, z)
- scatter plot with variable as size per point (x, y, size)
- 2d black and white image (x, y, pixel_value)
- moves log from a game of ‘battleship’ (index: move number, x-coord, y-coord, hit/miss)
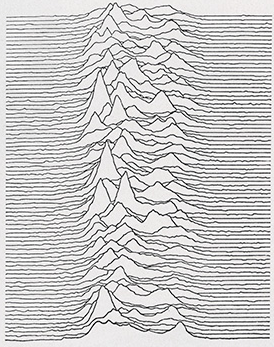
- consecutive pulses of CP 1919 (time, x, y)

4 D
- surface plus coloration, (x, y, z, color_label)
- surface change over time (x, y, z, time)
30 D
- Brain connectivity analysis of 30 regions
20, 000 D
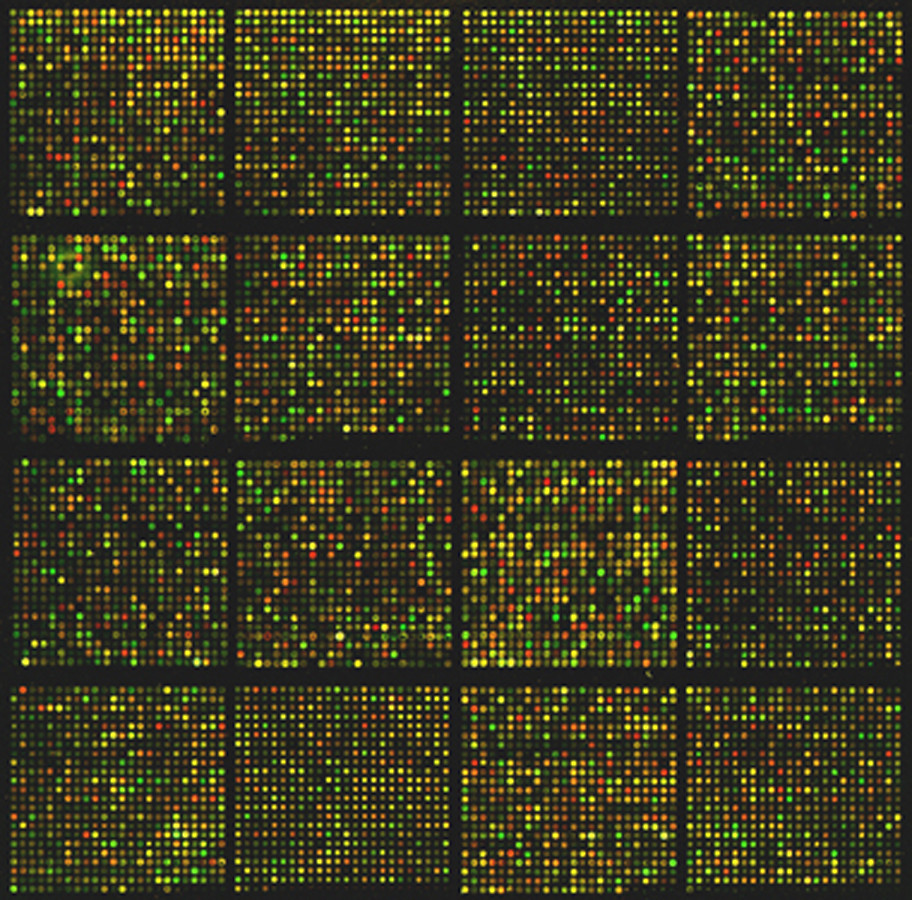
human gene expression e.g.

Exercise - Battleship moves:
discussion point is this 3d or 4d?
is the move number a dimension or an index?
move_id column (A-J) row (1-10) hit 0 A 1 False 1 J 10 True 2 C 7 False n … … Solution
3d: move_id is an index!
- order sequence matters but not the specific value of the move number
4d: move_id is a dimension!
- odd or even tells you which player is making which move
- order sequence is important, but when a specific moves get made might matter - what if you wanted to analyze moves as a function of game length?
There is always an index
- move_id is an index
- that doesn’t mean there is no information there
- you can perform some feature engineering with move_id
- this would up the dimensionality of the inital 3d dataset perhaps adding two more dimensions:
- player
- player’s move number
Exercise - Film:
consider a short, black and white, silent film, in 4K. It has the following properties:
- 1 minute long
- 25 frames per second
- 4K resolution i.e. 4096 × 2160.
- standard color depth 24 bits/pixel
Think of this film as a dataset, How many observations might there be?
Solution:
60 seconds x 25 frames per second = 1500 frames or ‘observations’. Is there another way to think about this?
Exercise: How many dimensions are there per observation?
Solution:
There are three dimensions per observation:
- pixel row (0-2159)
- pixel col (0-4095)
- pixel grey value (0-255)
Exercise: How many dimensions would there be if the film was longer, or shorter?
Solution:
- The number of dimensions would NOT change.
- There would simply be a greater or fewer number of ‘observations’
Exercise: How many dimensions would there be if the film was in color?
Solution:
4 dimensions.
There is an extra dimension per observation now.
- channel value (red, green, blue)
- pixel row (0-2159)
- pixel col (0-4095)
- pixel intensity (0-255)
Exercise: Titanic dataset
Look at the kaggle Titantic Dataset.
passenger_id pclass name sex age sibsp parch ticket fare cabin embarked boat body home.dest survived 1216 3 Smyth, Miss. Julia female 0 0 335432 7.7333 Q 13 1 699 3 Cacic, Mr. Luka male 38.0 0 0 315089 8.6625 S Croatia 0 1267 3 Van Impe, Mrs. Jean Baptiste (Rosalie Paula Govaert) female 30.0 1 1 345773 24.15 S 0 449 2 Hocking, Mrs. Elizabeth (Eliza Needs) female 54.0 1 3 29105 23.0 S 4 Cornwall / Akron, OH 1 576 2 Veal, Mr. James male 40.0 0 0 28221 13.0 S Barre, Co Washington, VT 0 What column is the index?
Solution:
PassengerId
Exercise: What columns are the dimensions?
Solution:
- pclass
- name
- sex
- age
- sibsp
- parch
- ticket
- fare
- cabin
- embarked
- survived
Exercise: how many dimensions are there?
Solution:
11
Exercise: Imagine building a model to predict survival on the titantic
- would you use every dimension?
- what makes a dimension useful?
- could you remove some dimensions?
- could you combine some dimensions?
- how would you combine those dimensions?
- do you have fewer dimensions after combining?
- do you have less information after combining?
Solution:
- No, some variables are poor predictors and can be ignored
- If it is (anti-)correlated with survival (in some context) i.e. has information.
- Yes any mostly null columns are not useful (add no information), any highly correlated columns also (no additional information)
- Yes
- Maybe add SibSp and Parch into one ‘family count’.
- Yes.
- Yes, but more data than if columns had been excluded.
High-Dimensional Data
What is high-dimensional data? Unfortunately, there isn’t a precise definition. Often, when people use the term, they are referring to specific problems and headaches that arise when working with data that has many (typically dozens or more) features (a.k.a. dimensions). These problems are generally referred to as the “curse of dimensionality”.
Curse of Dimensionality
The “curse of dimensionality” refers to the challenges that arise when dealing with data in high-dimensional spaces. These challenges include:
- Overfitting in Models: Machine learning models are prone to overfitting when the number of features approaches or exceeds the number of observations in the data. In this context, what is considered “high-dimensional is relative to the number of observations in your data.
- Increased Computational Complexity: As dimensions increase, so do compute needs both in terms of memory and processing power. This can make the analysis more difficult.
- Visualization Challenges: Visualizing data with many features becomes challenging, as humans can easily comprehend only up to three dimensions.
- Increased Sparsity: As dimensions increase, the volume of the space grows exponentially, making data points more spread out and less dense.
- Reduced Meaningfulness of Distance: As dimensions increase, the concept of distance between data points becomes less intuitive and less useful for distinguishing between different points.
Throughout this workshop, we’ll see how these challenges, or “curses,” apply to our research goals and explore strategies to address them.
Key Points
data can be anything - as long as you can represent it in a computer
A dimension is a feature in a dataset - i.e. a column, but NOT an index.
an index is not a dimension