Introduction
Figure 1
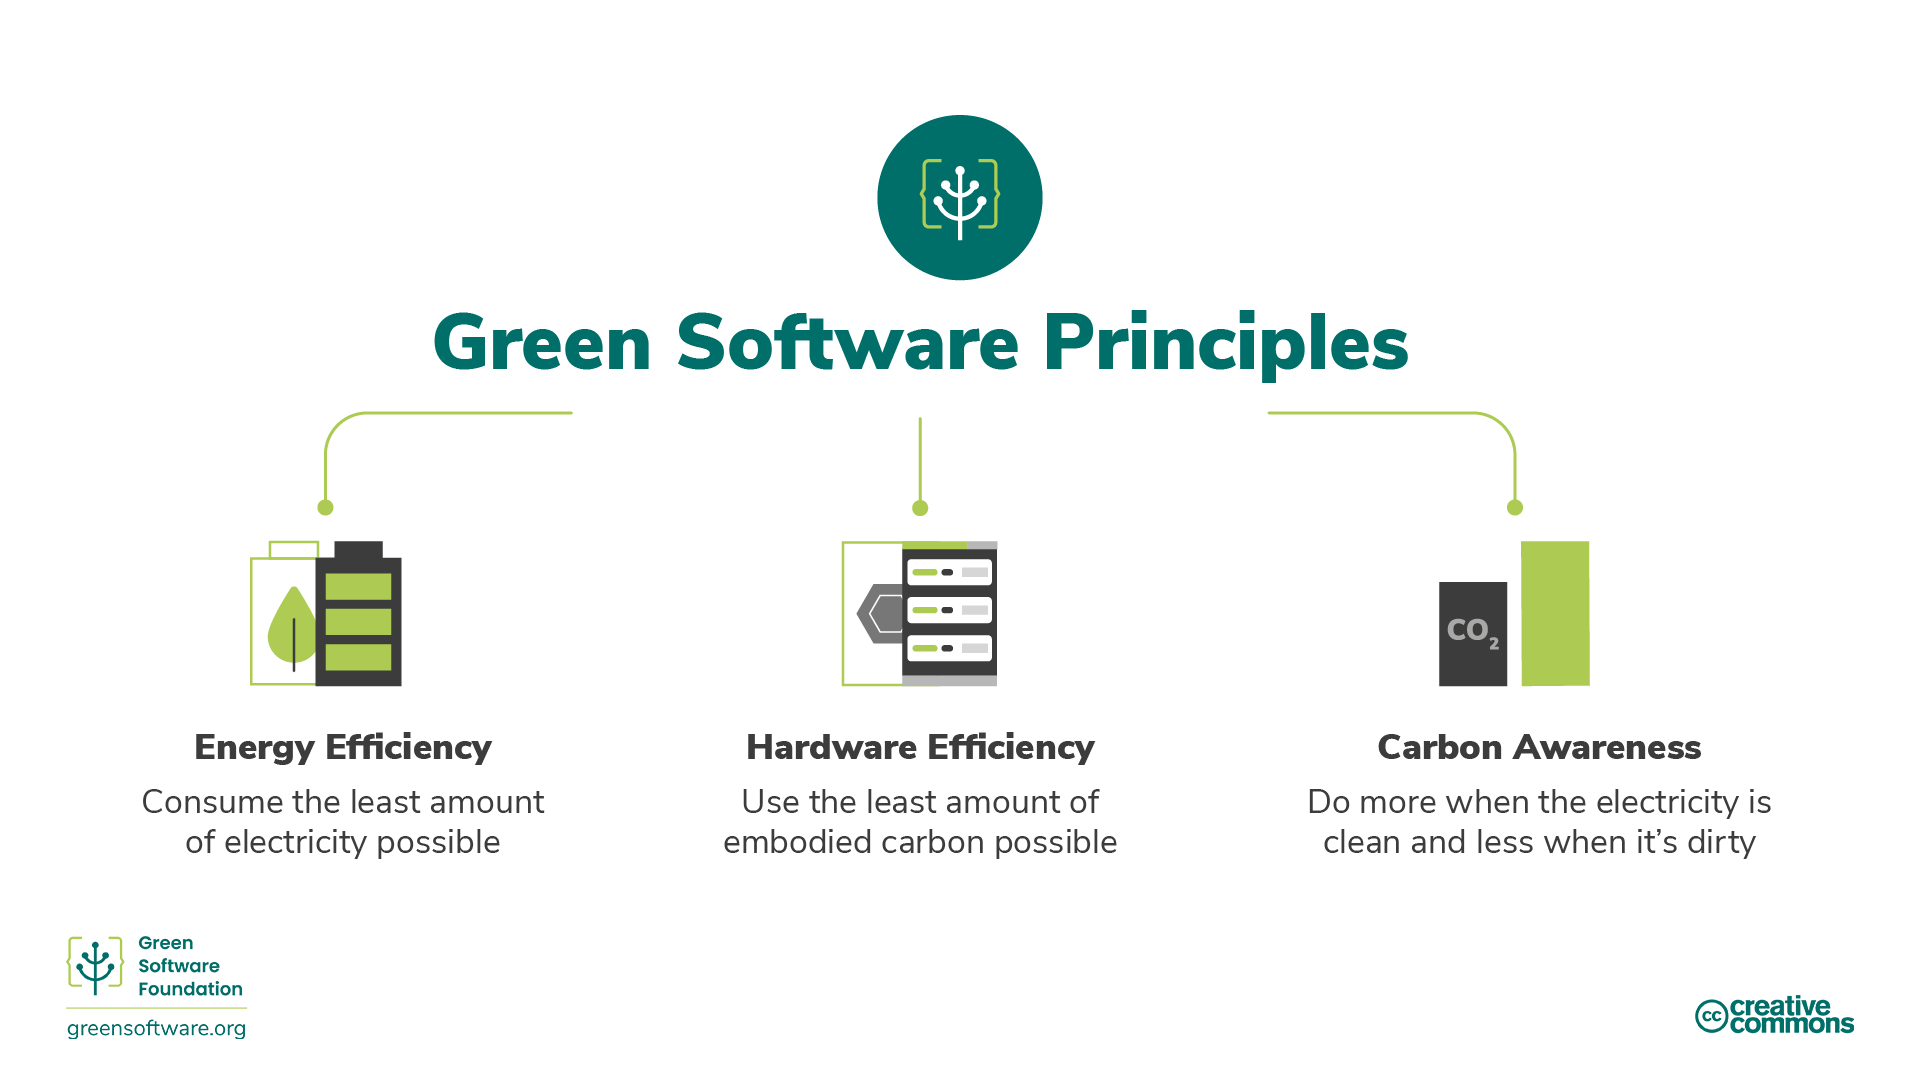
Diagram illustrating three activities that can
reduce carbon emissions from software use
Carbon Efficiency
Energy Efficiency
Figure 1
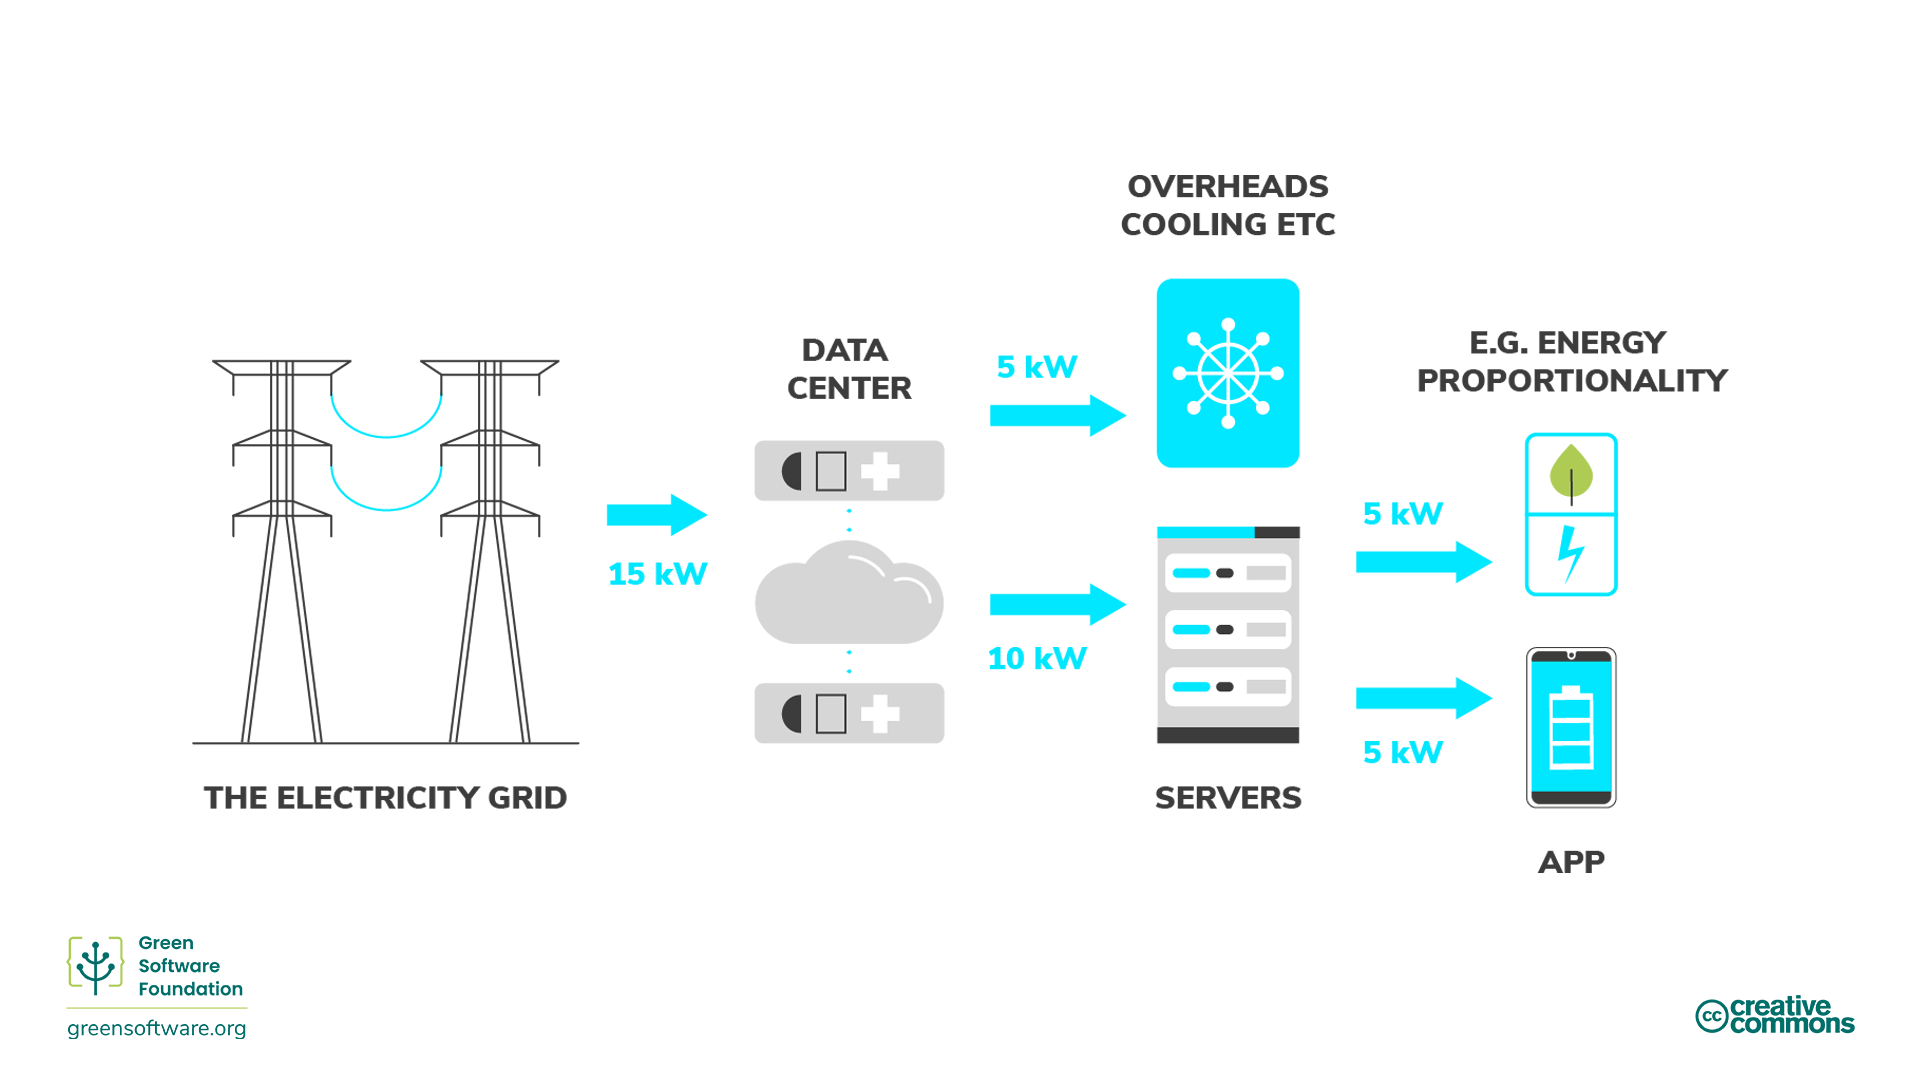
Diagram illustrating the chain of electricity
use in server/HPC setup
Figure 2
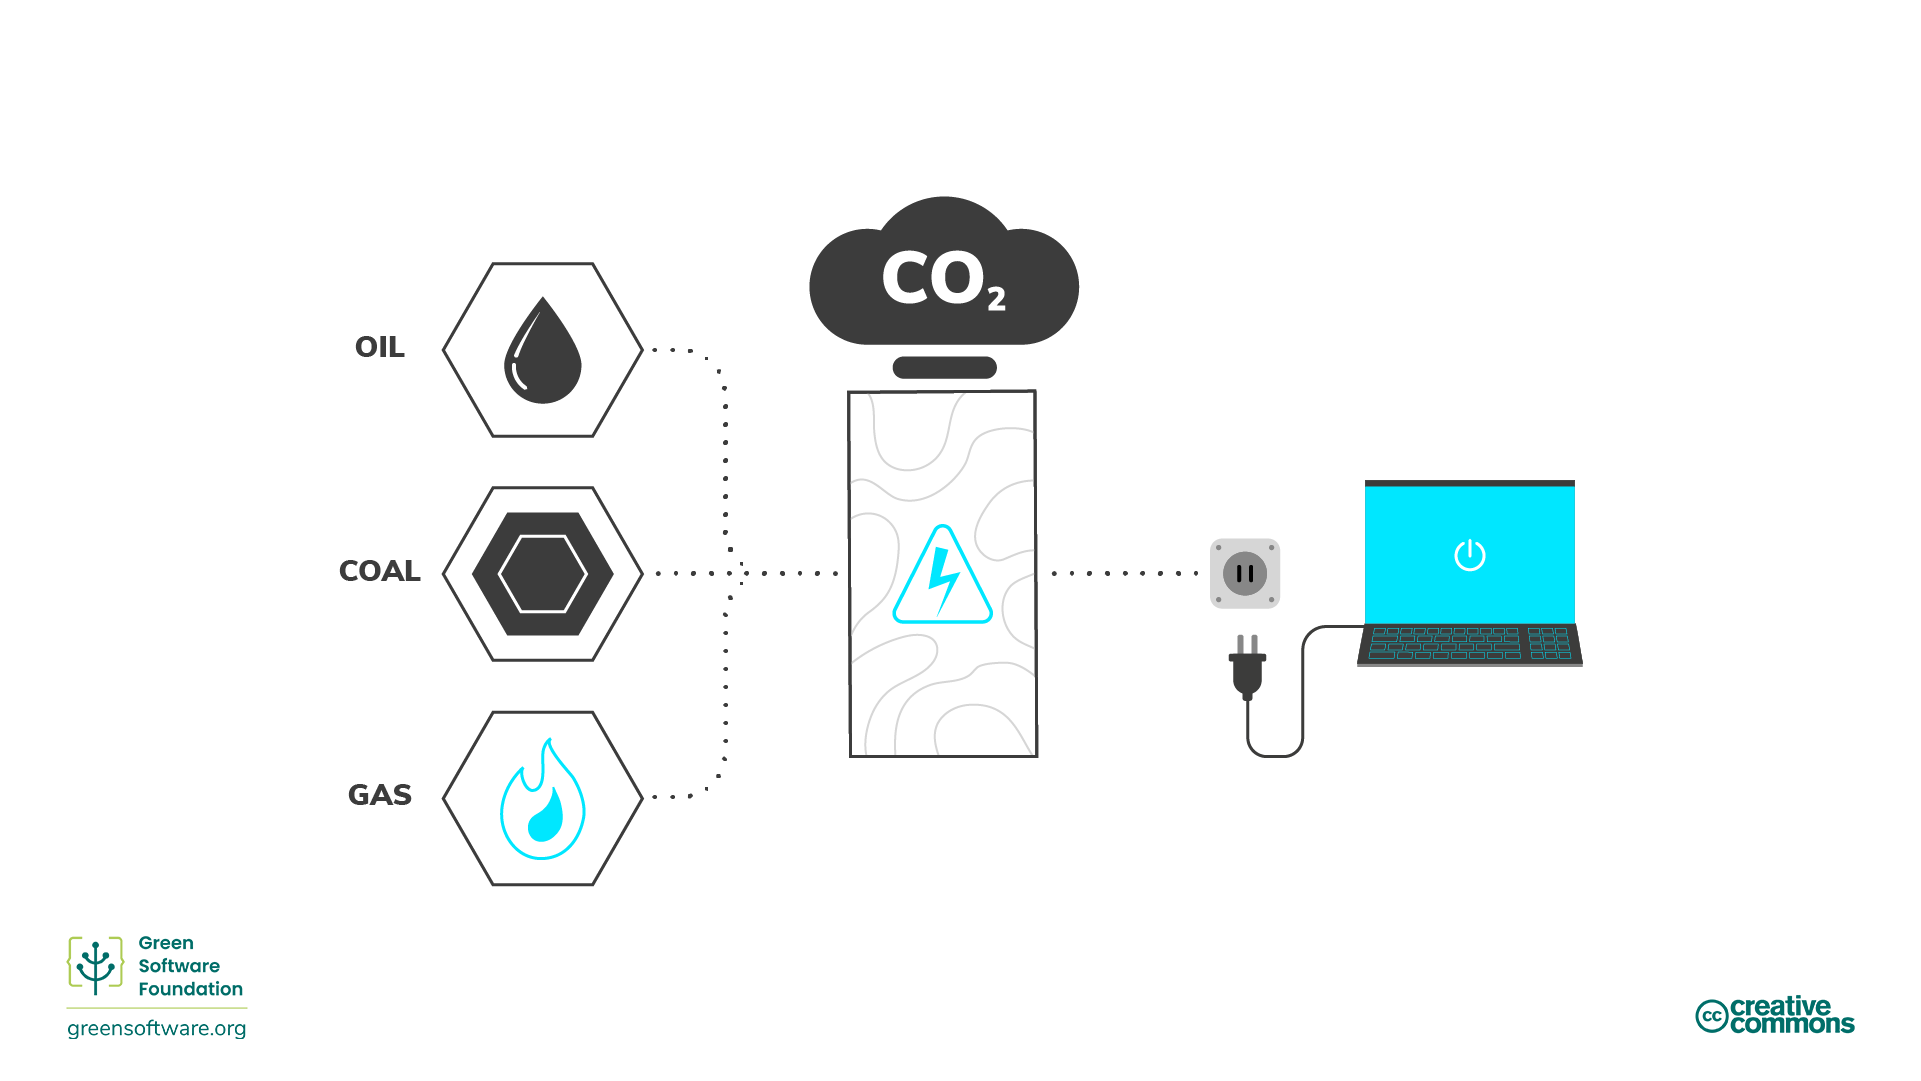
Diagram of link from fossil fuels to
energy
Figure 3
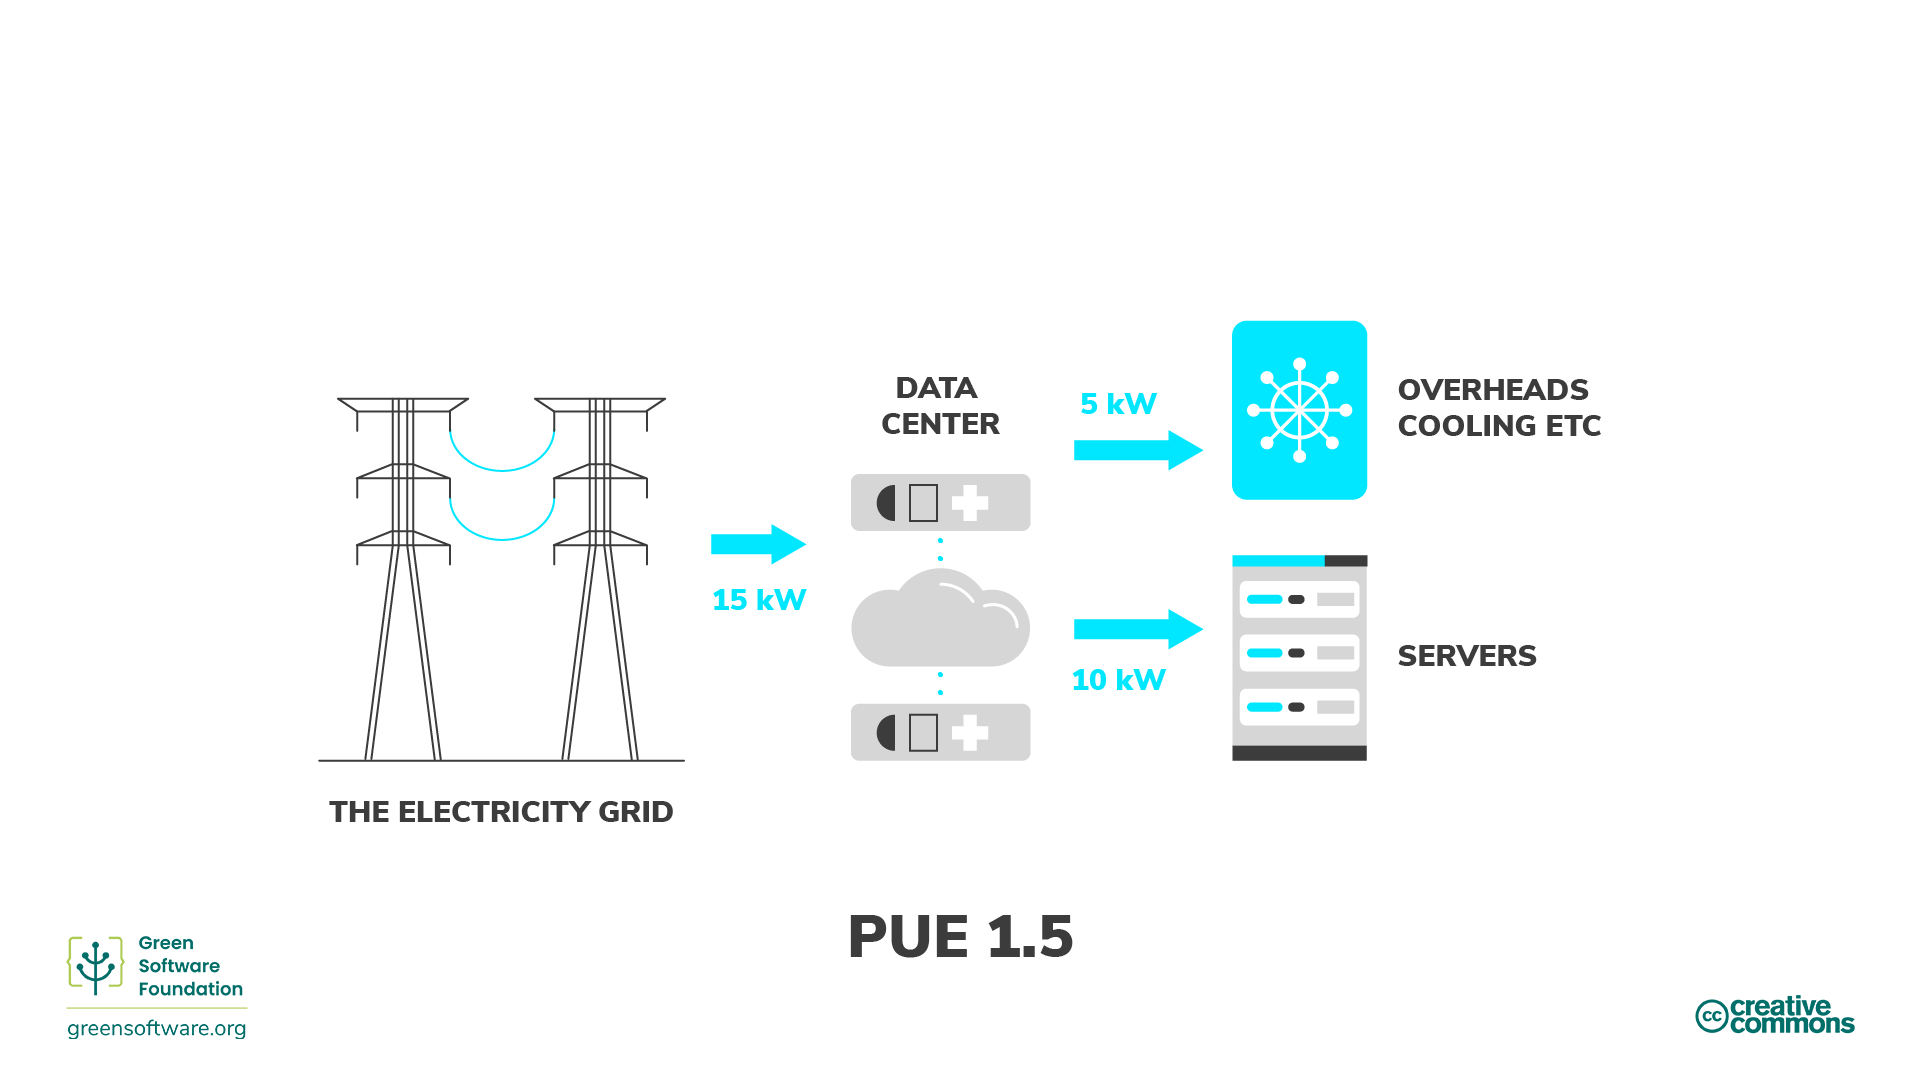
Diagram illustrating power usage effectiveness
(PUE) of data centres
Figure 4
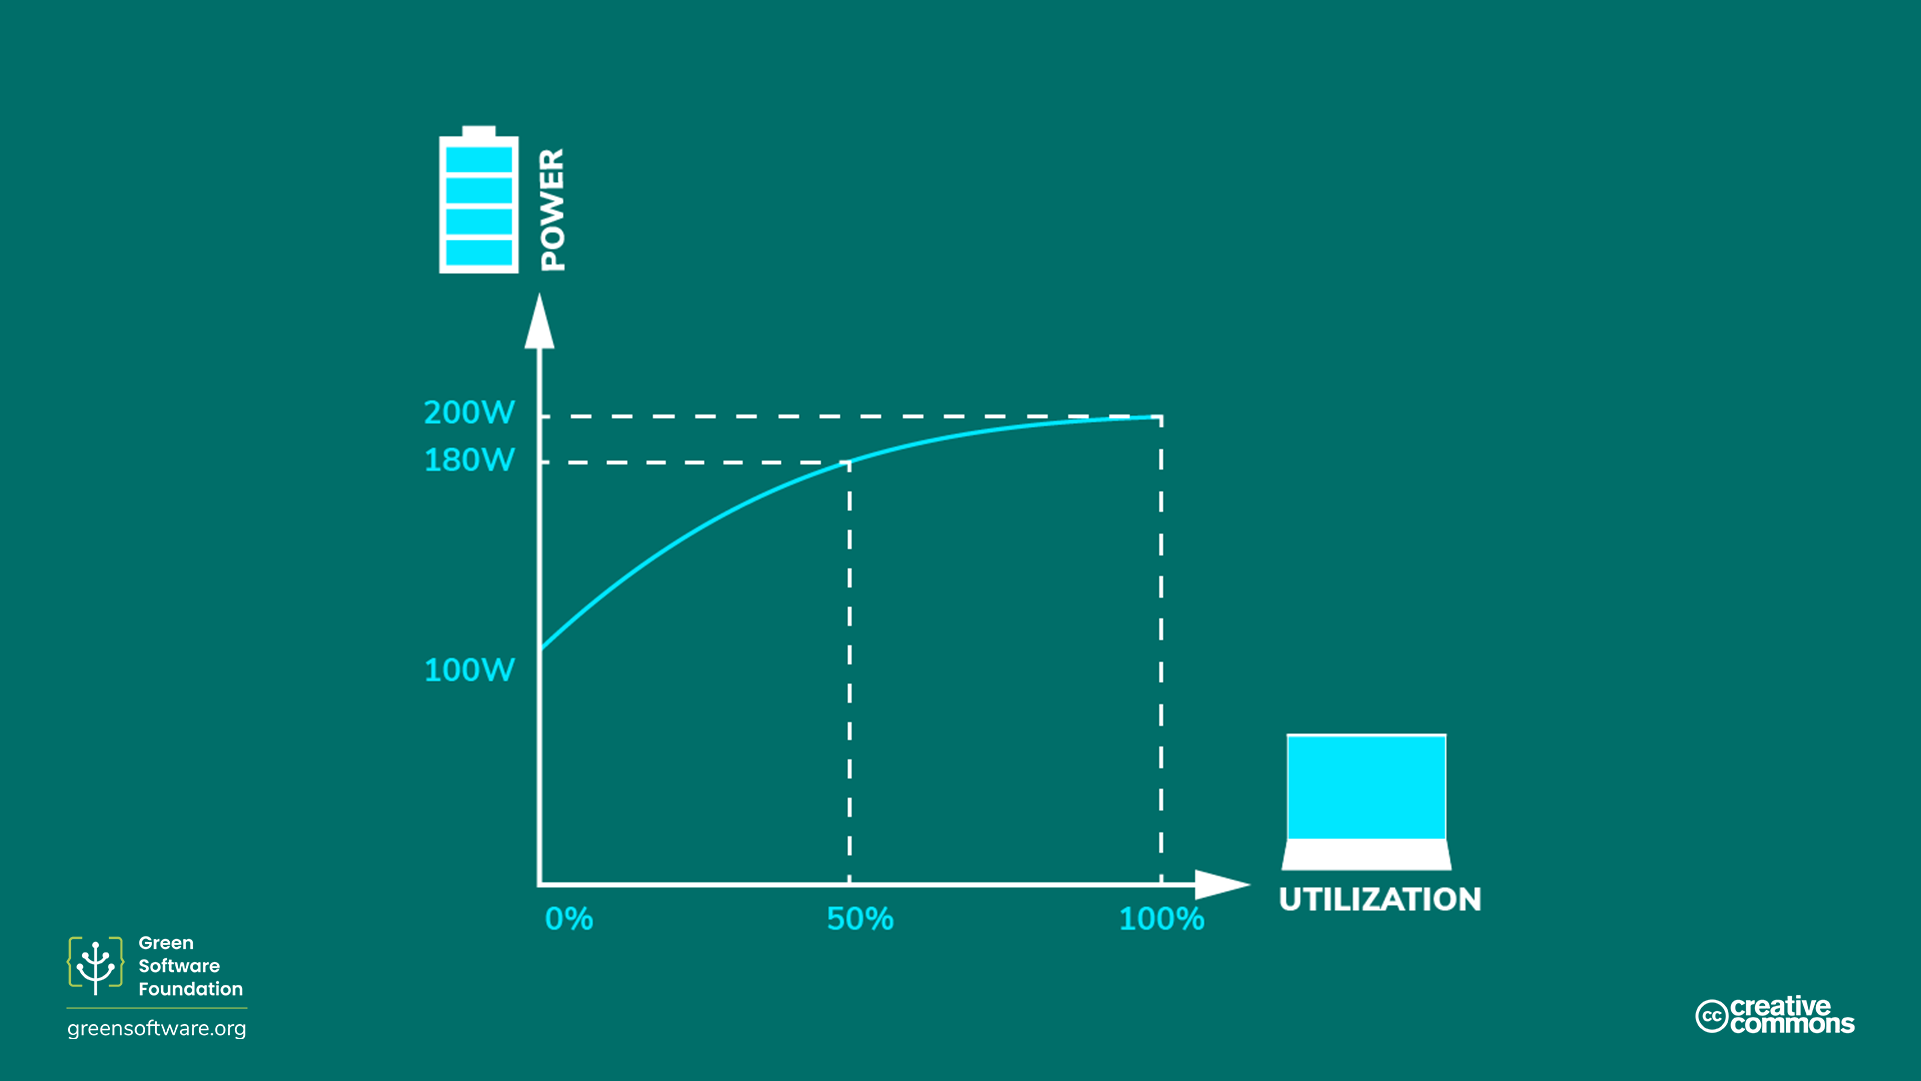
Schematic graph showing relationship between
power draw and utilisation of computer infrastructure
Carbon Awareness
Figure 1
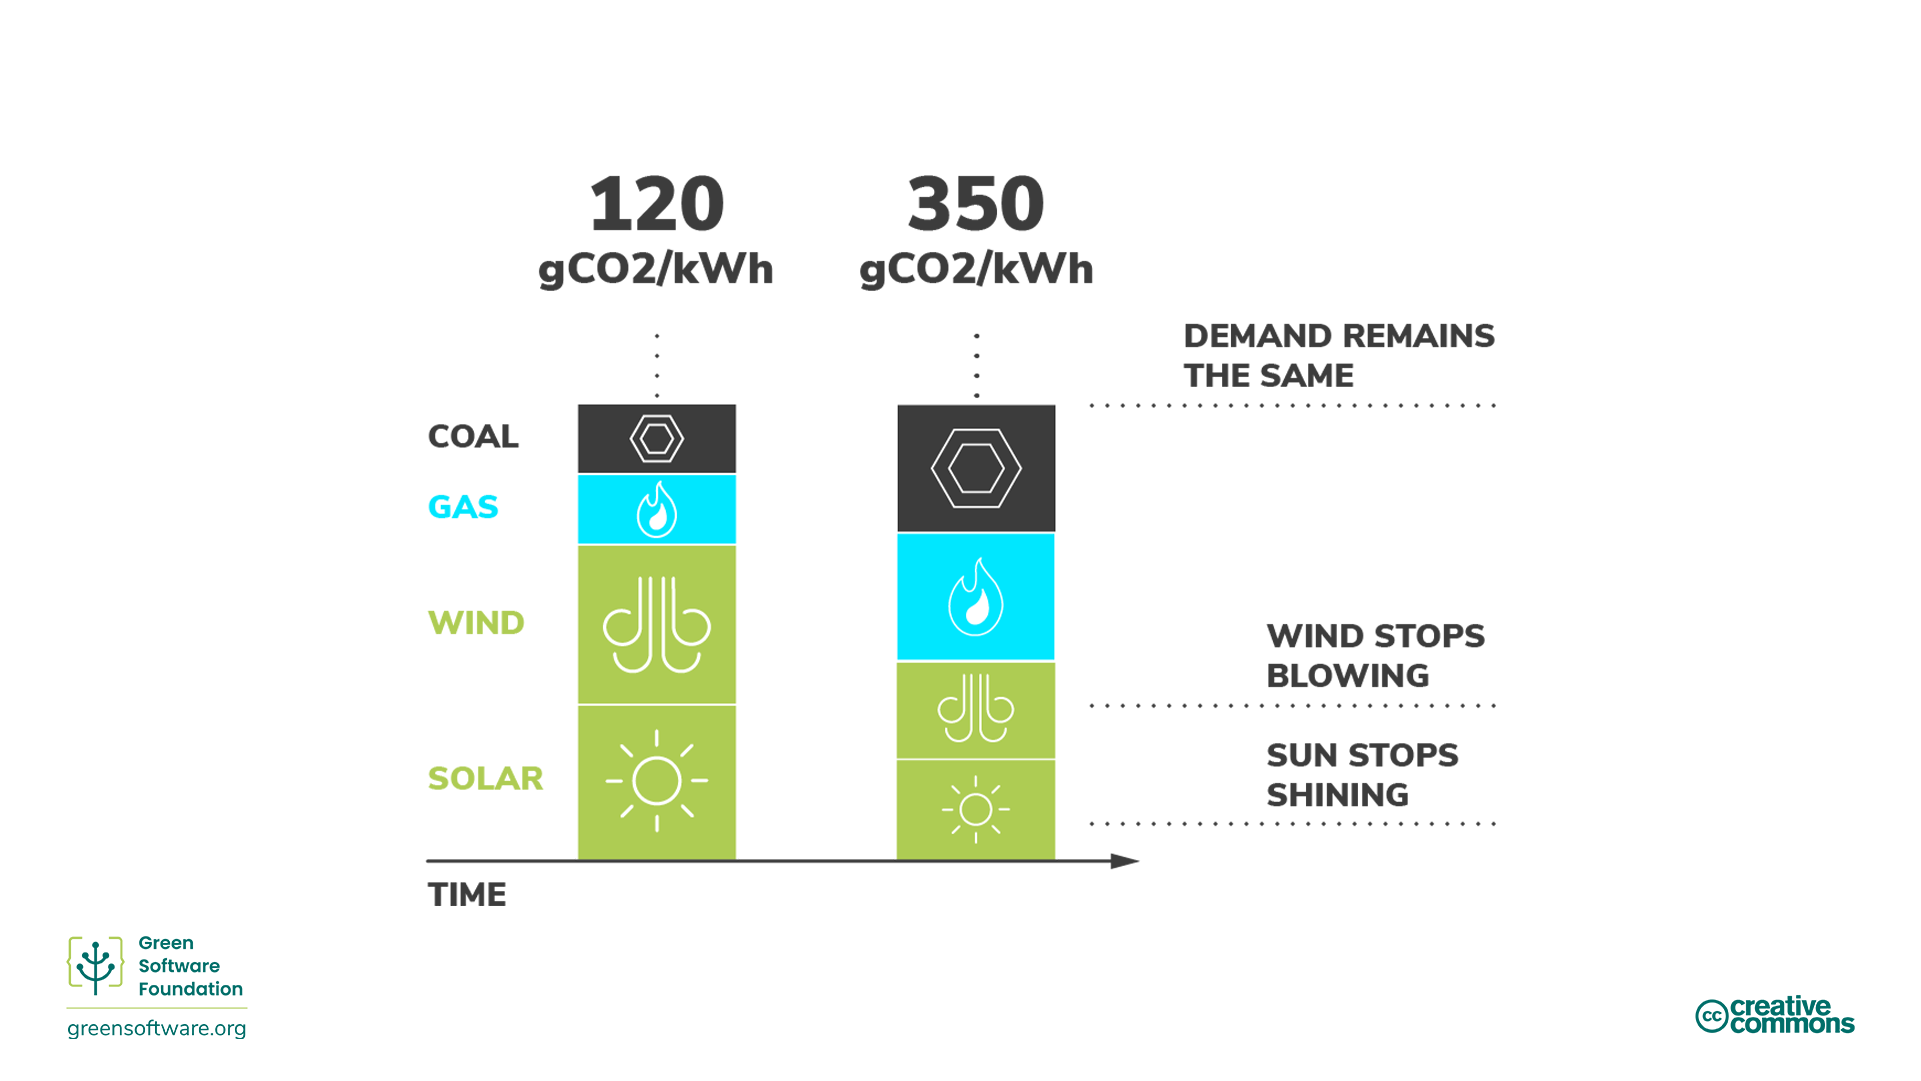
Diagram illustrating change in carbon intensity
over time due to changes in atmospheric conditions
Figure 2
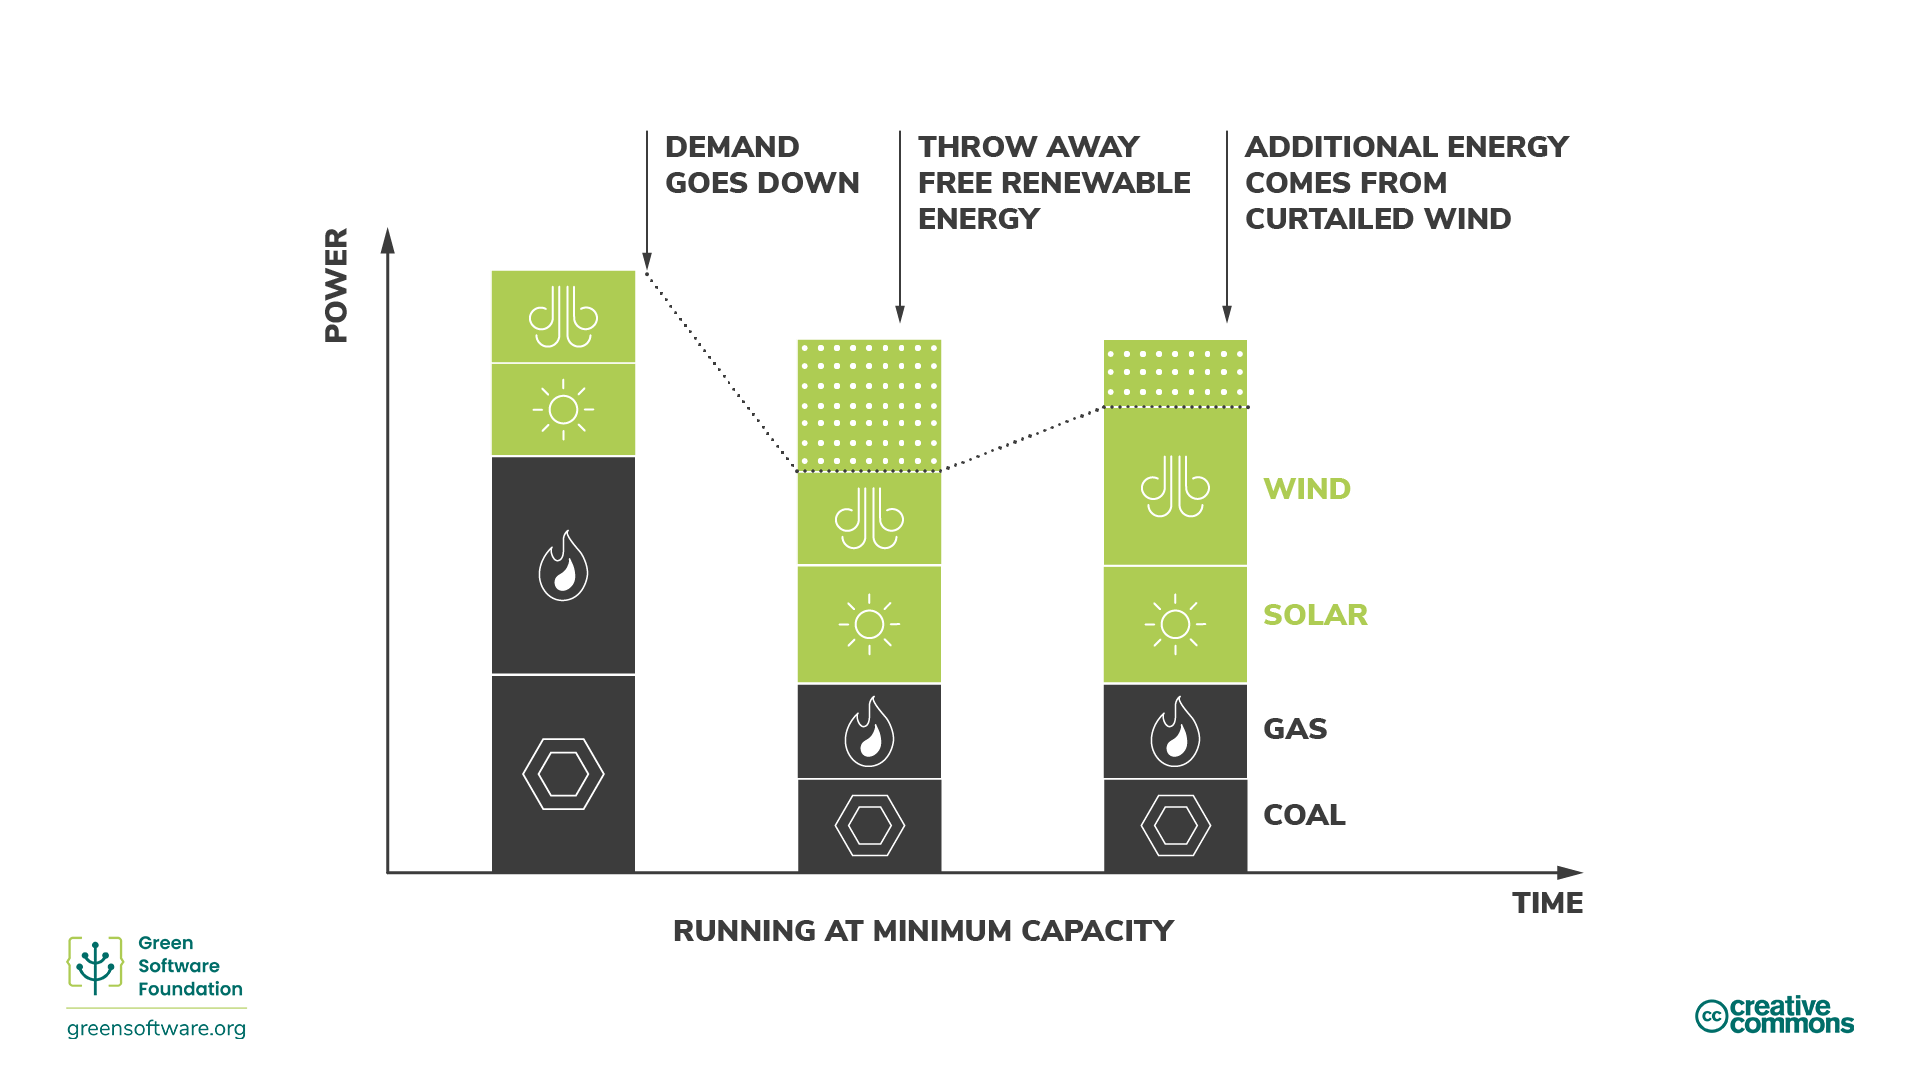
Diagram illustrating marginal carbon intensity
and curtailment
Figure 3
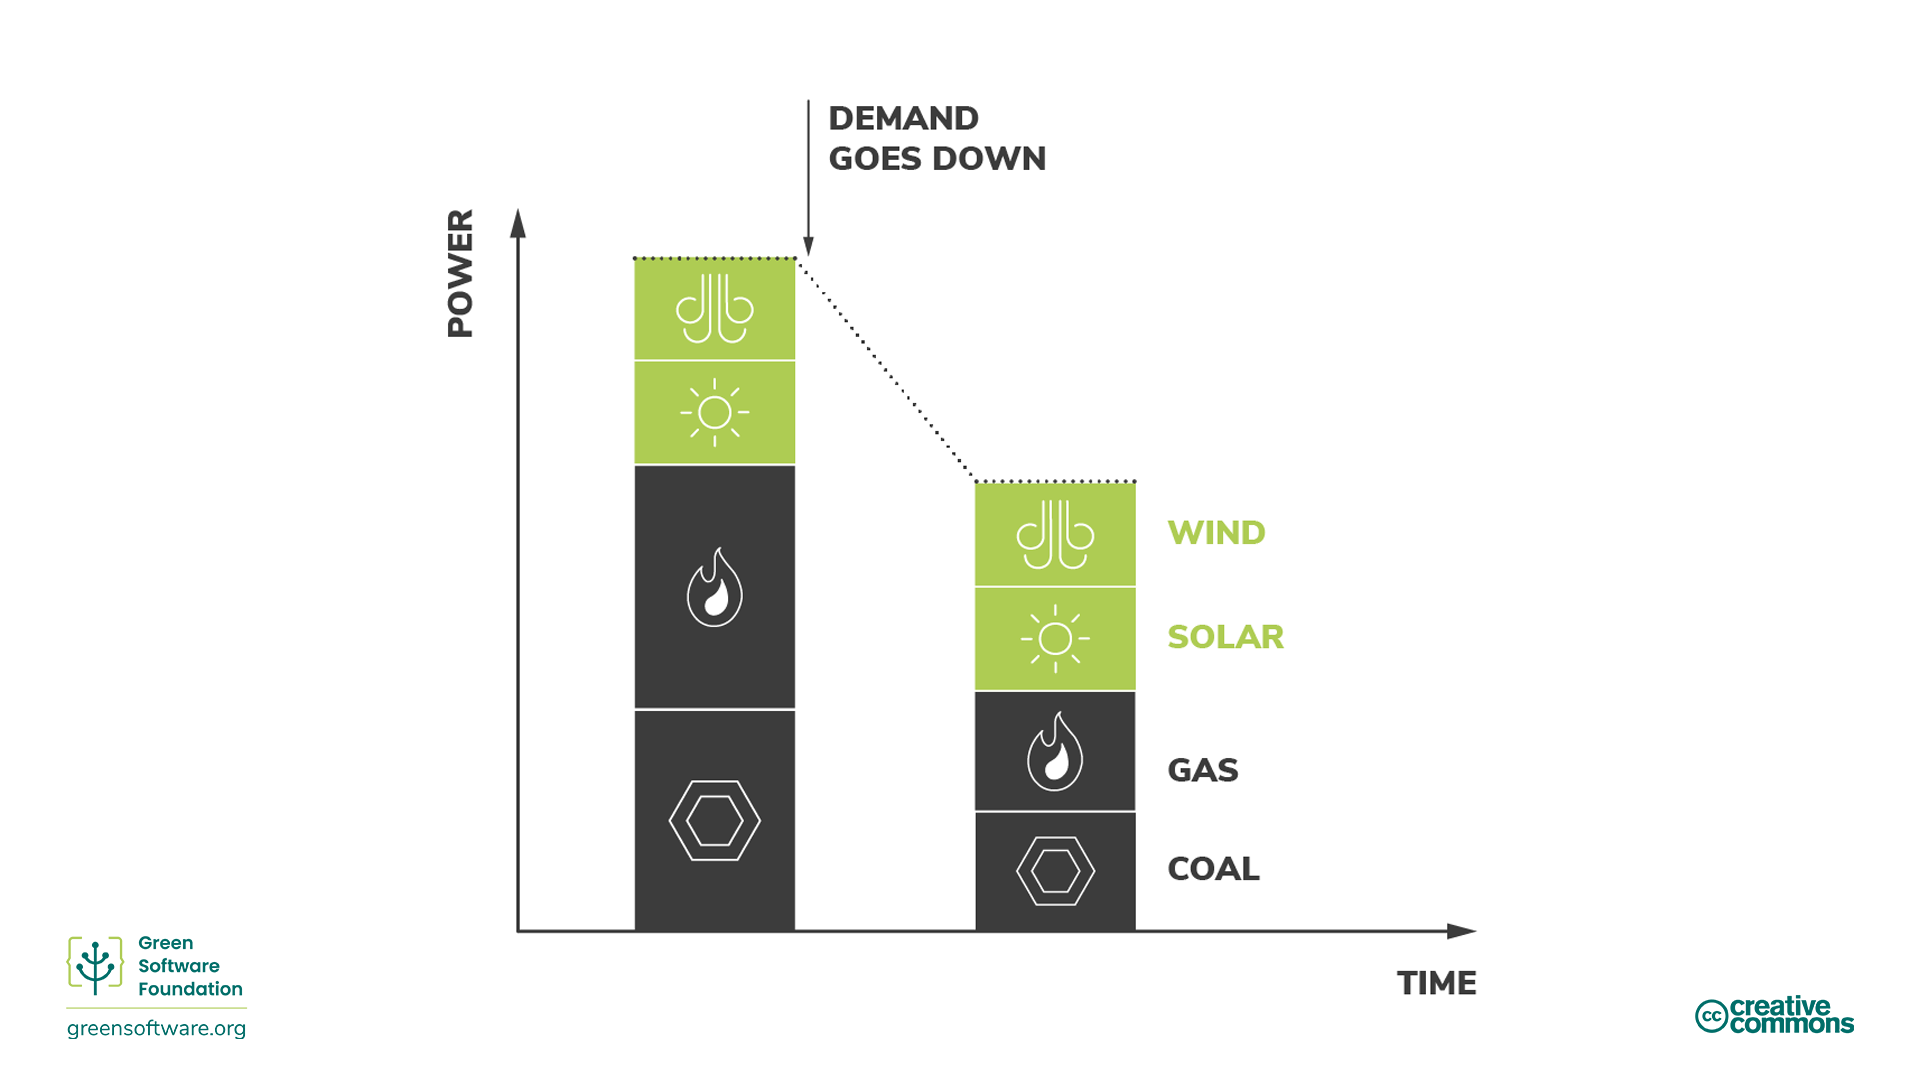
Diagram illustrating reduction in demand from
fossil fuel plants
Figure 4
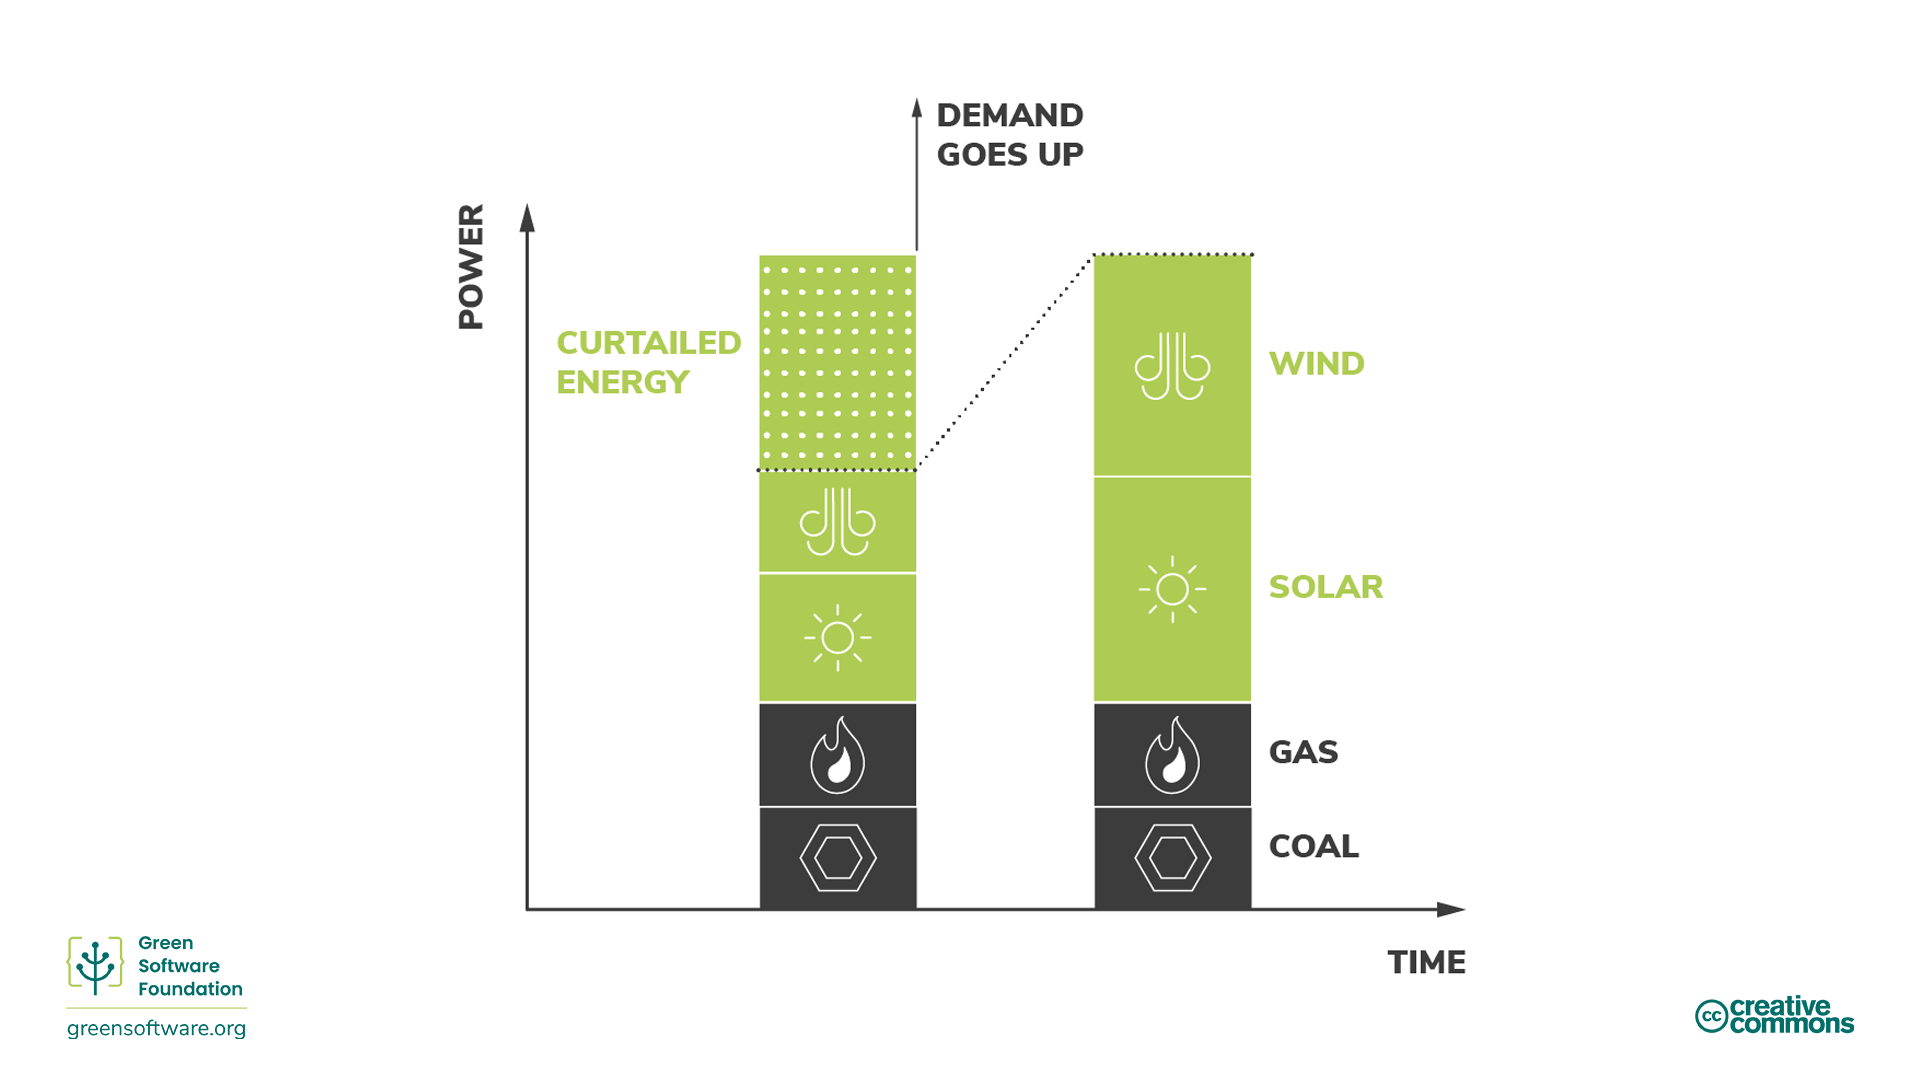
Diagram illustrating increase in demand from
renewable sources
Figure 5
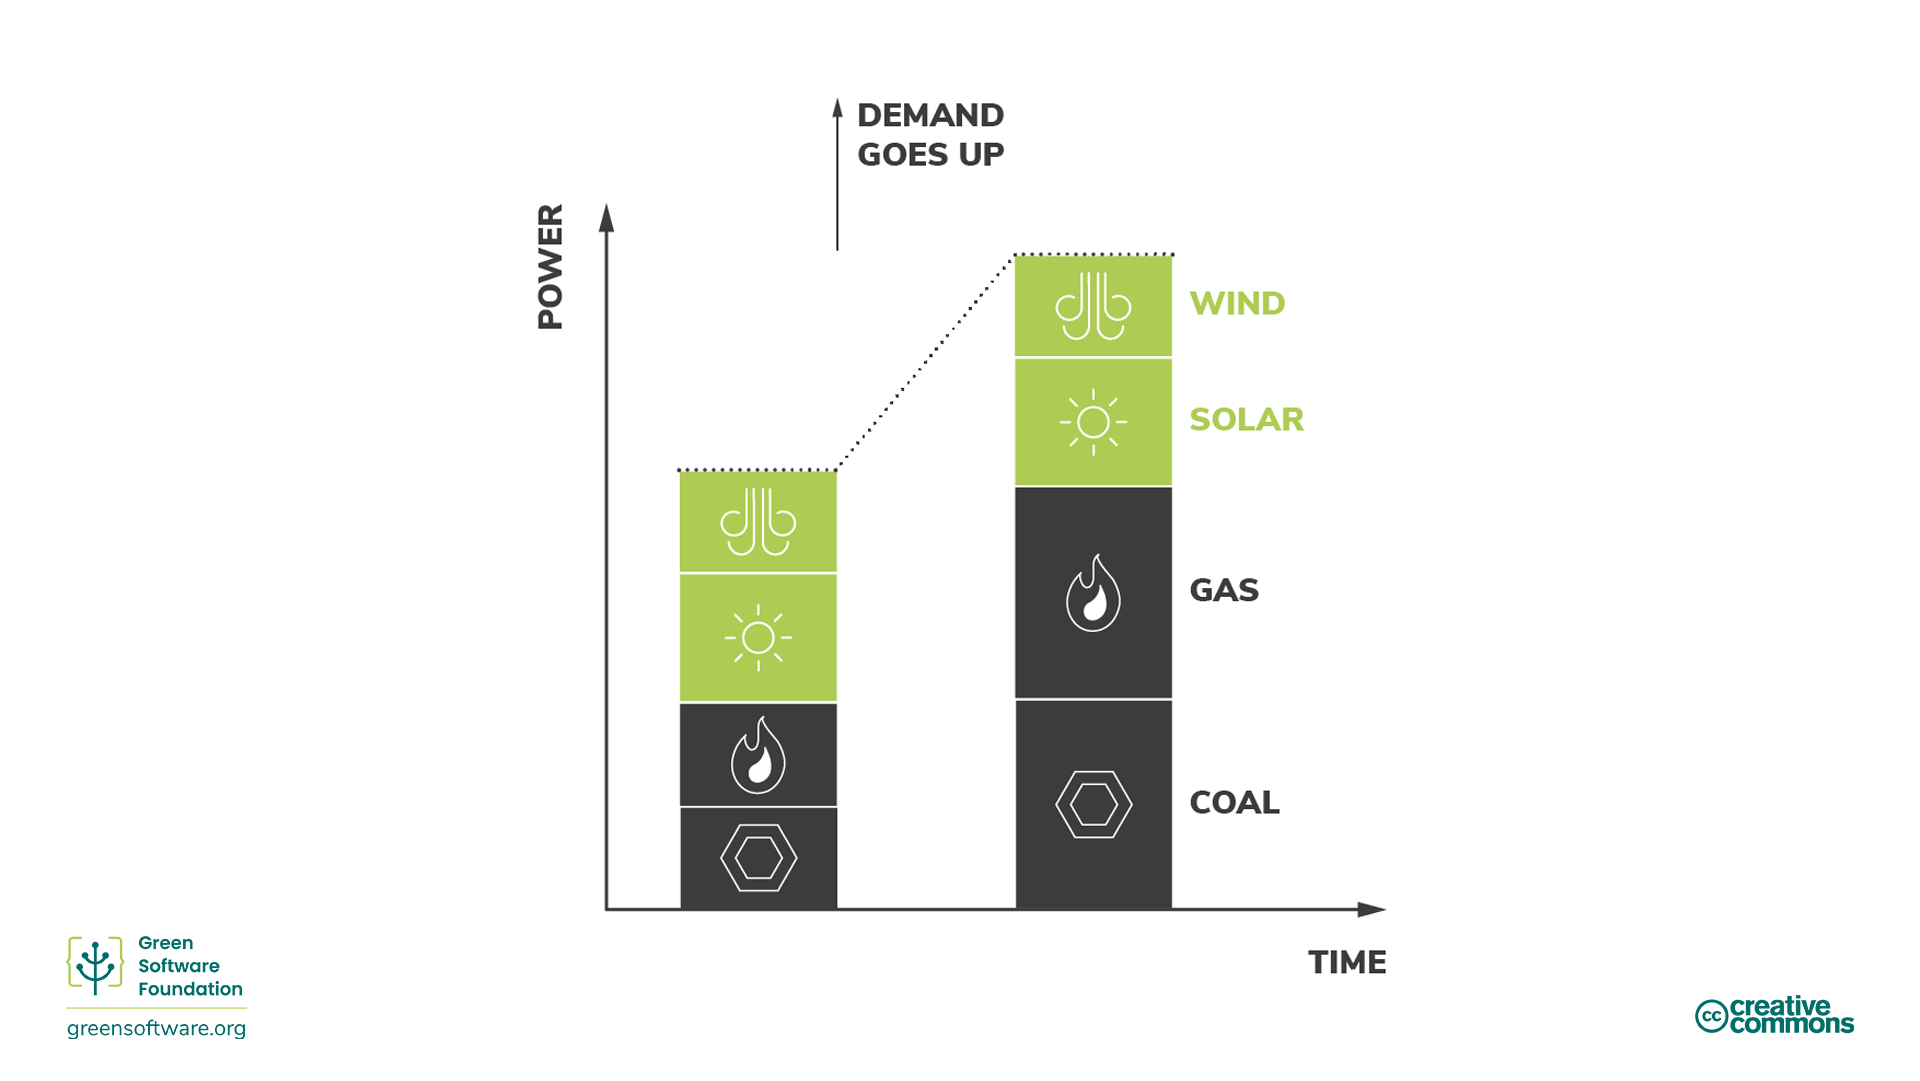
Diagram illustrating increase in demand from
non-renewable sources
Figure 6
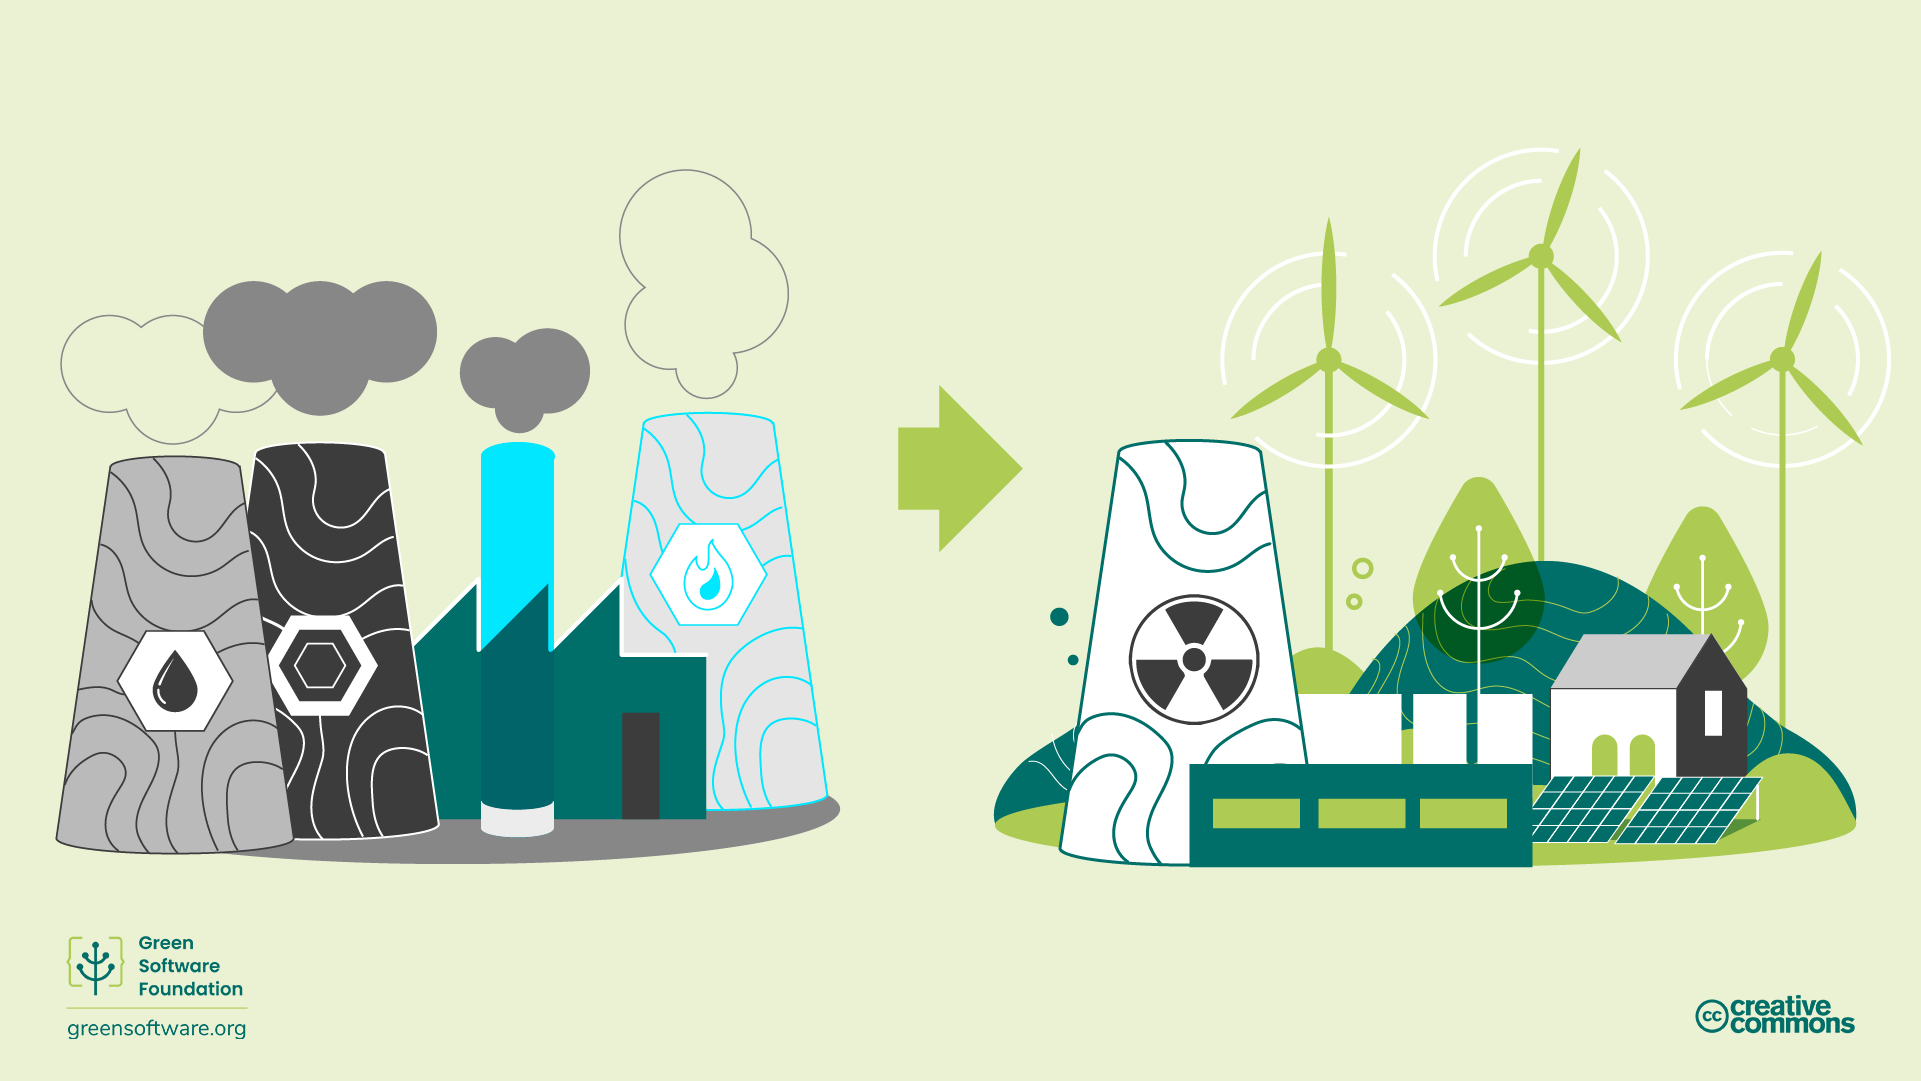
Image of transition from high-carbon to
low-carbon energy sources
Figure 7
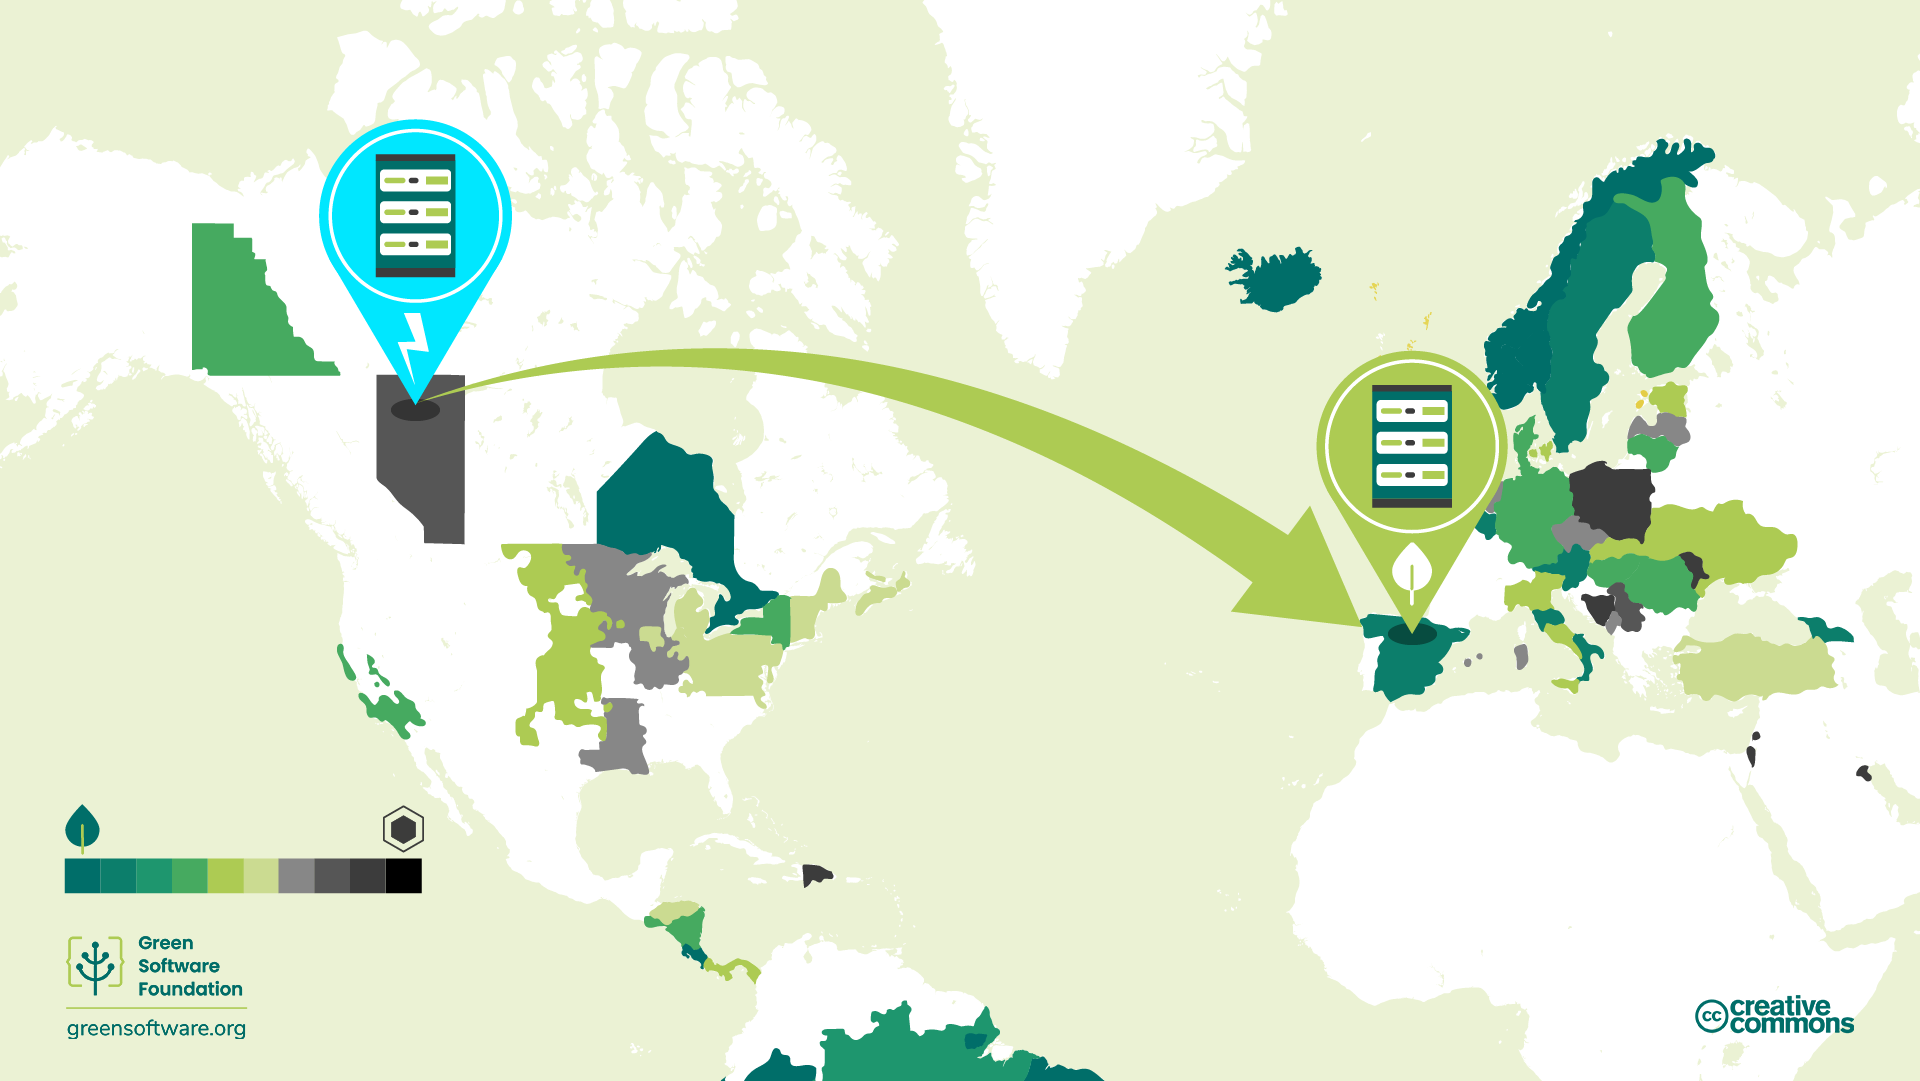
Diagram illustrating spatial demand
shifting
Figure 8
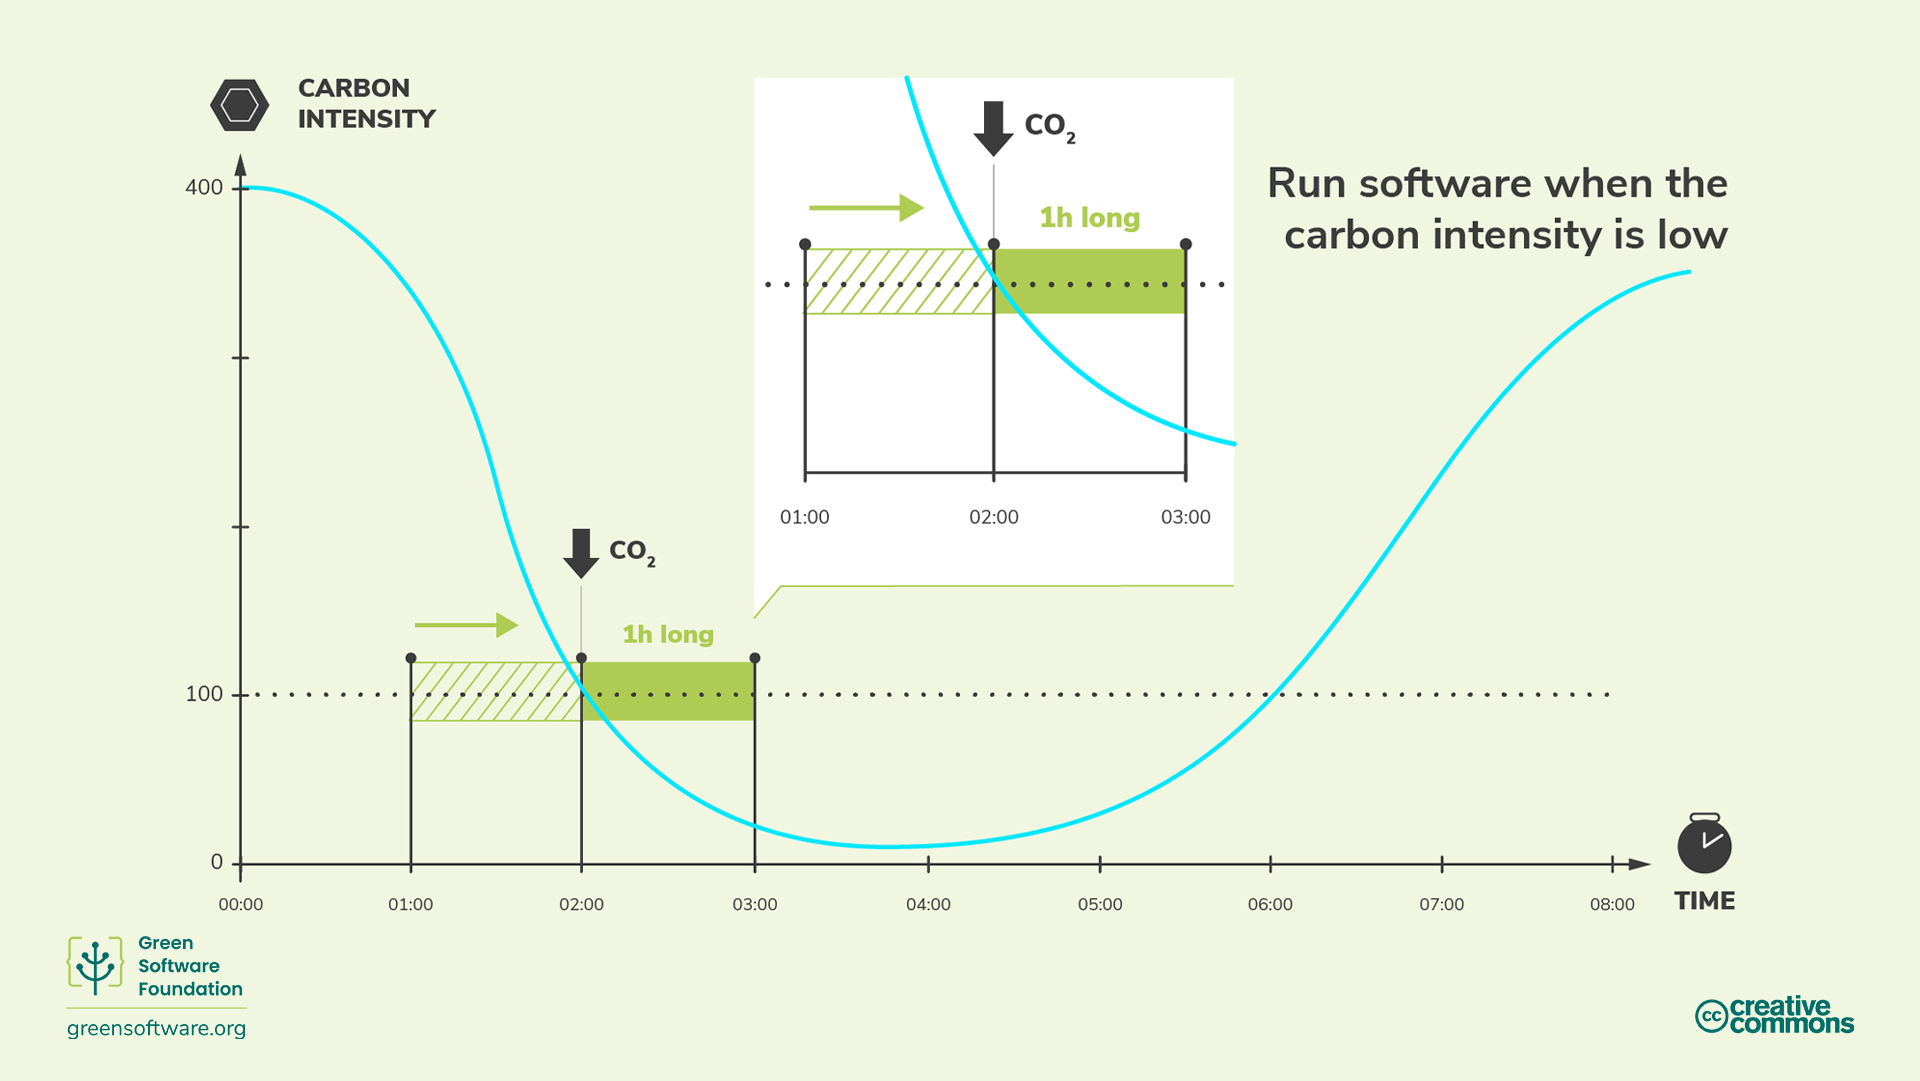
Diagram illustrating spatial demand
shifting
Figure 9
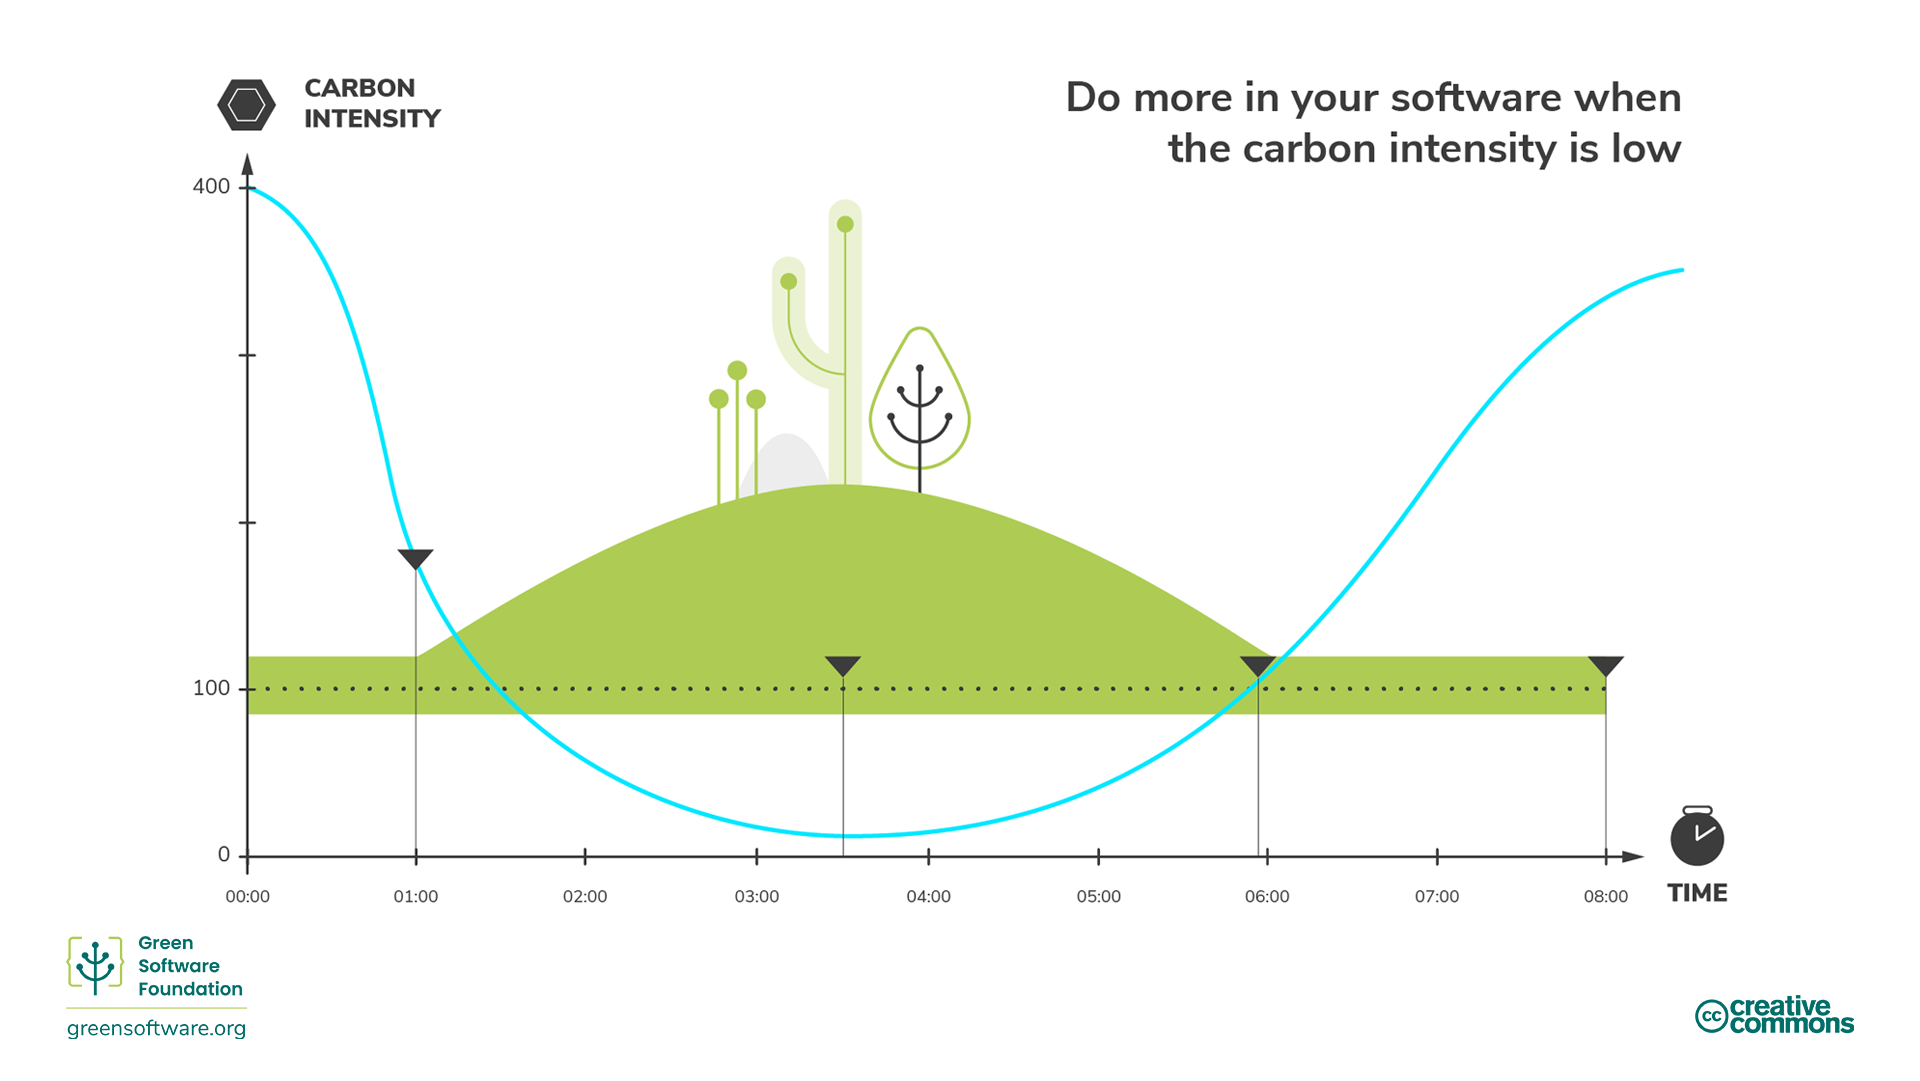
Diagram illustrating demand shaping
Hardware Efficiency
Figure 1
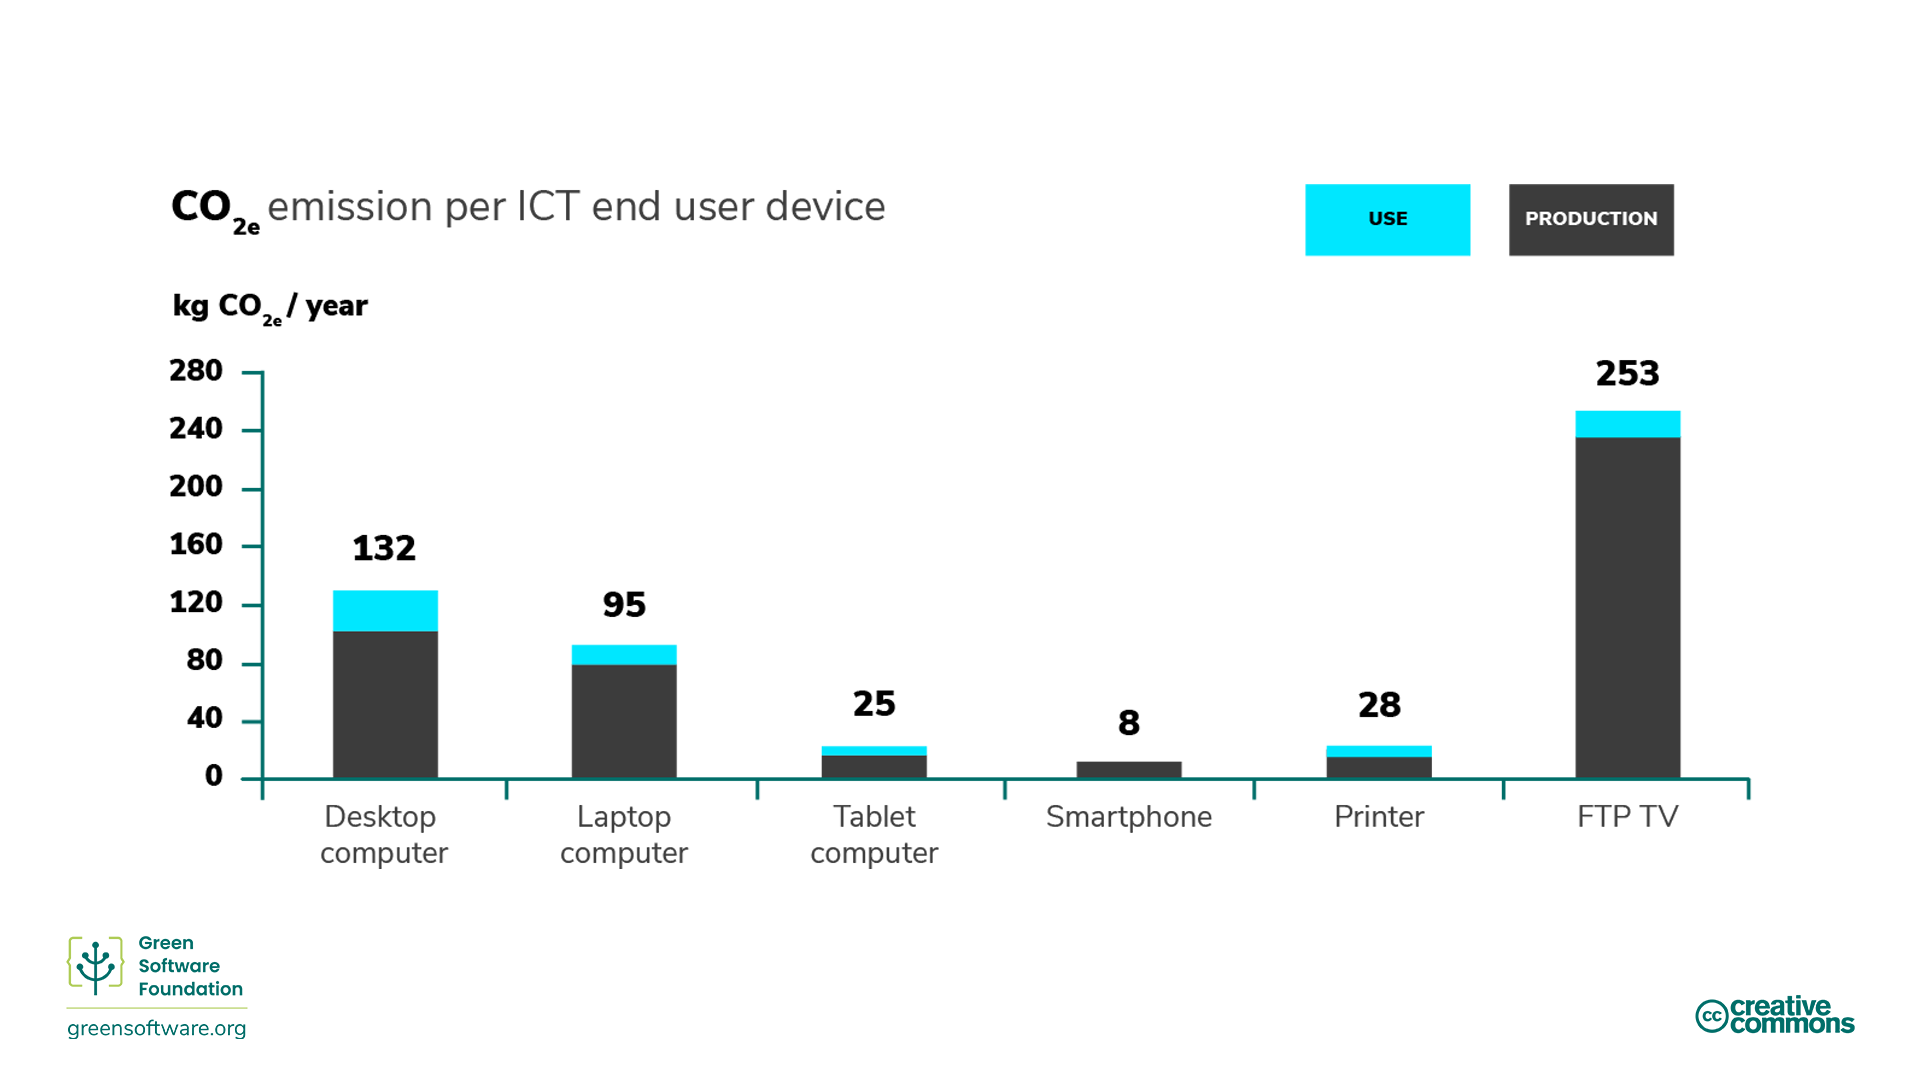
Bar chart illustrating embodied carbon from
various end-user devices
Figure 2
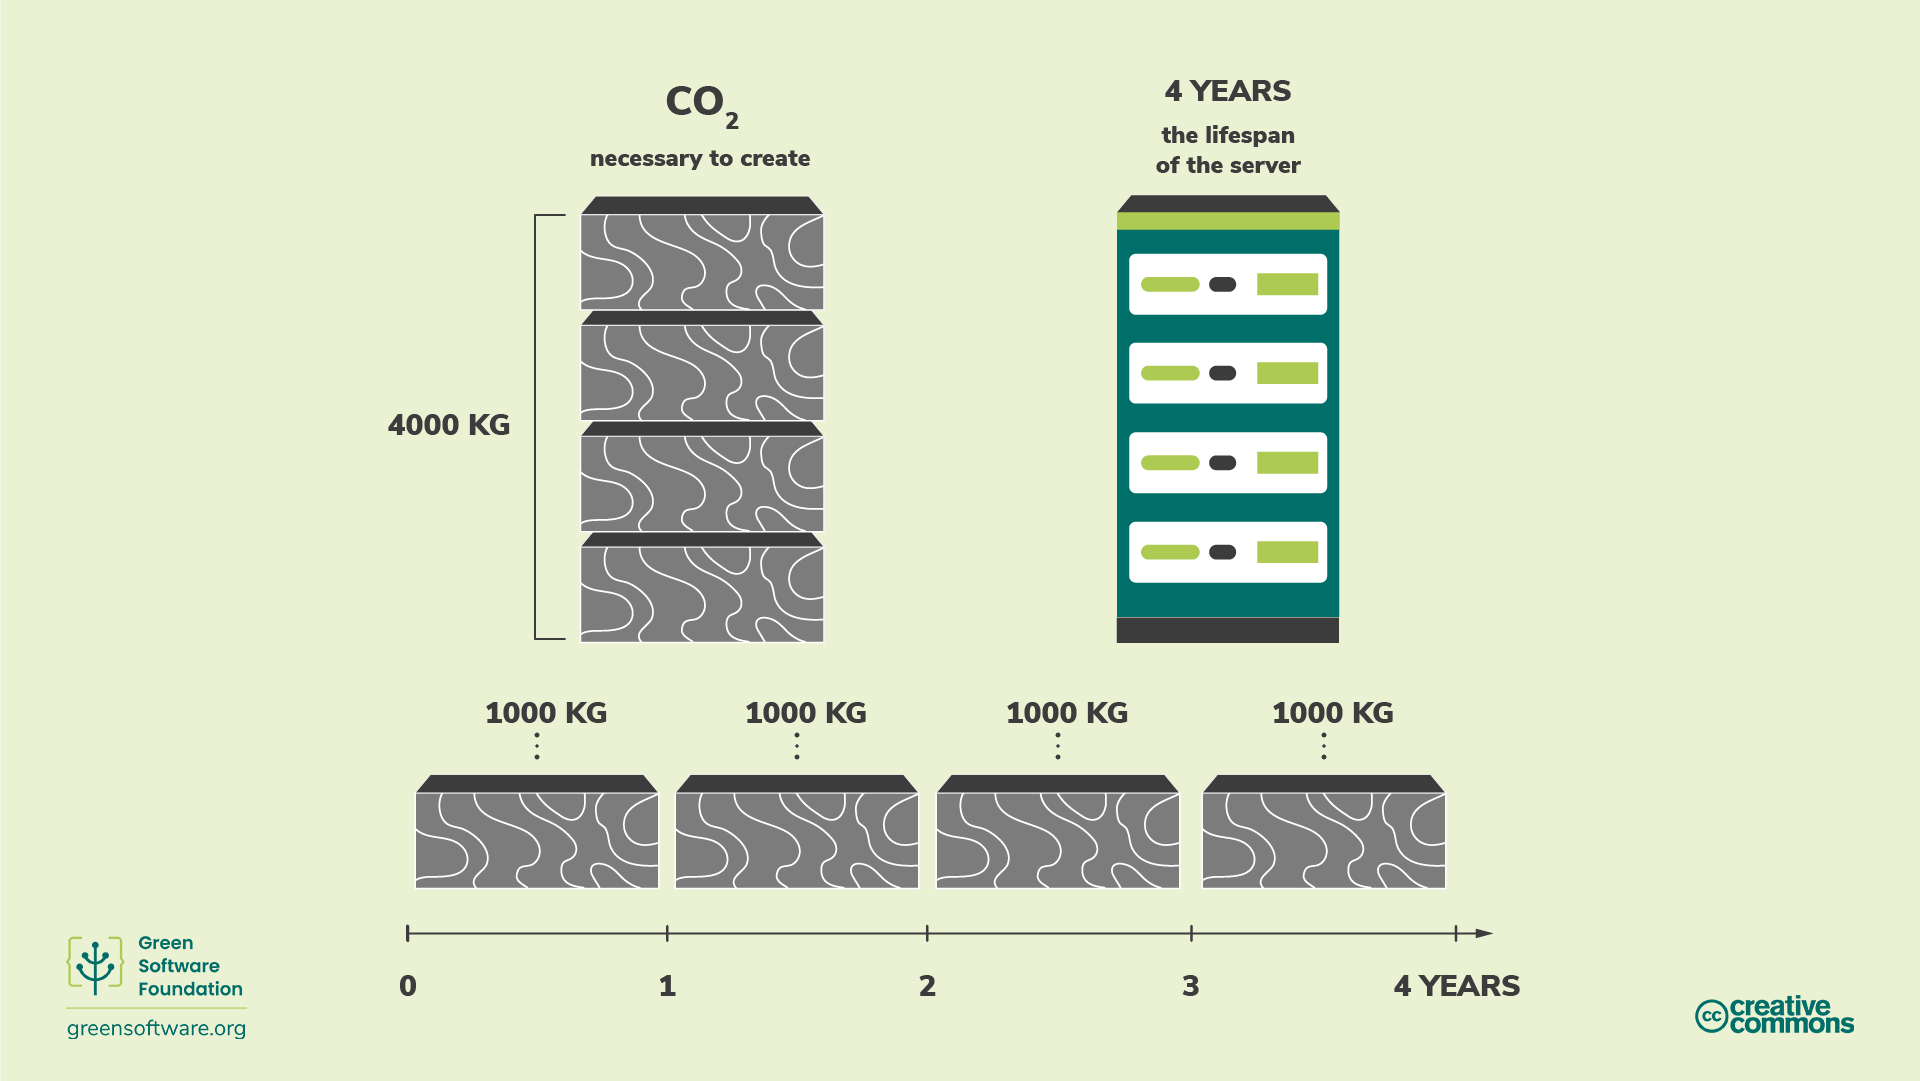
Diagram illustrating amortisation
Figure 3
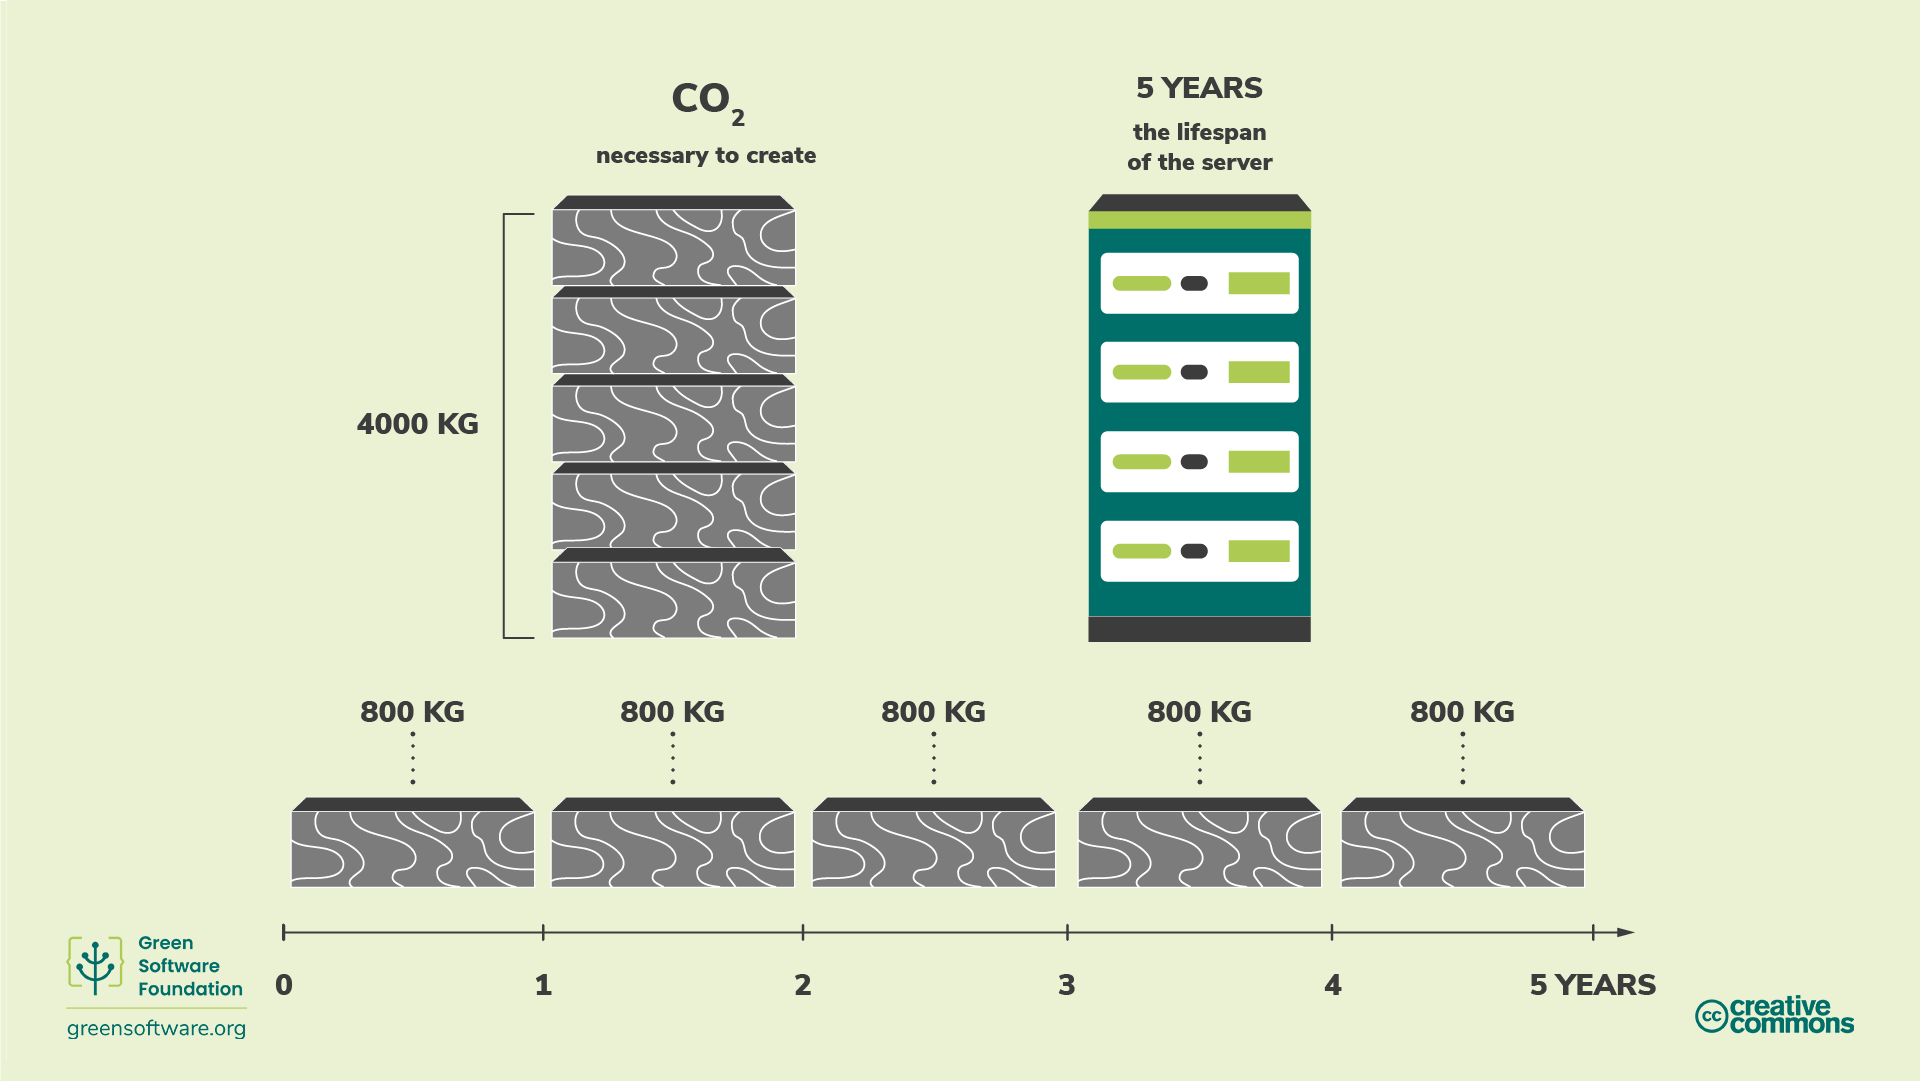
Diagram illustrating amortisation
Measurement
Reducing Emissions
Figure 1
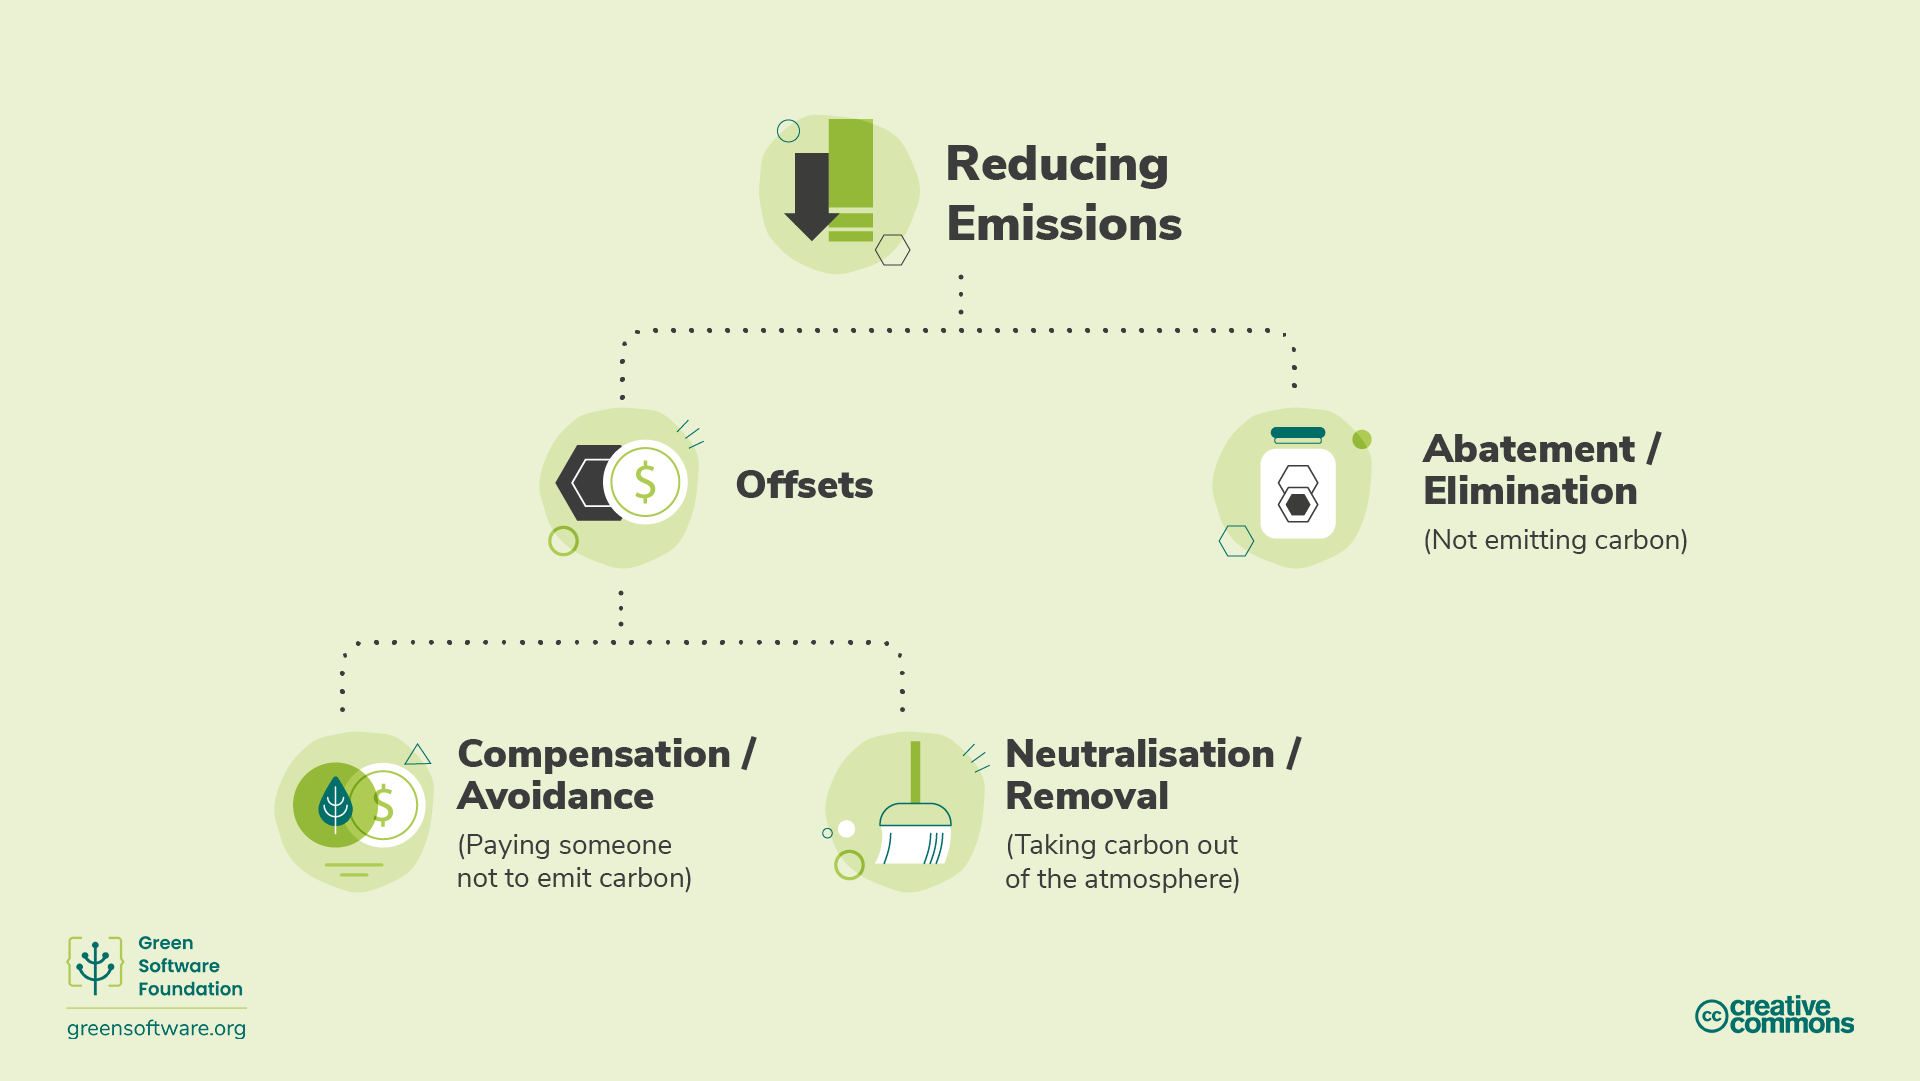
Diagram illustrating carbon reduction
strategies
Figure 2
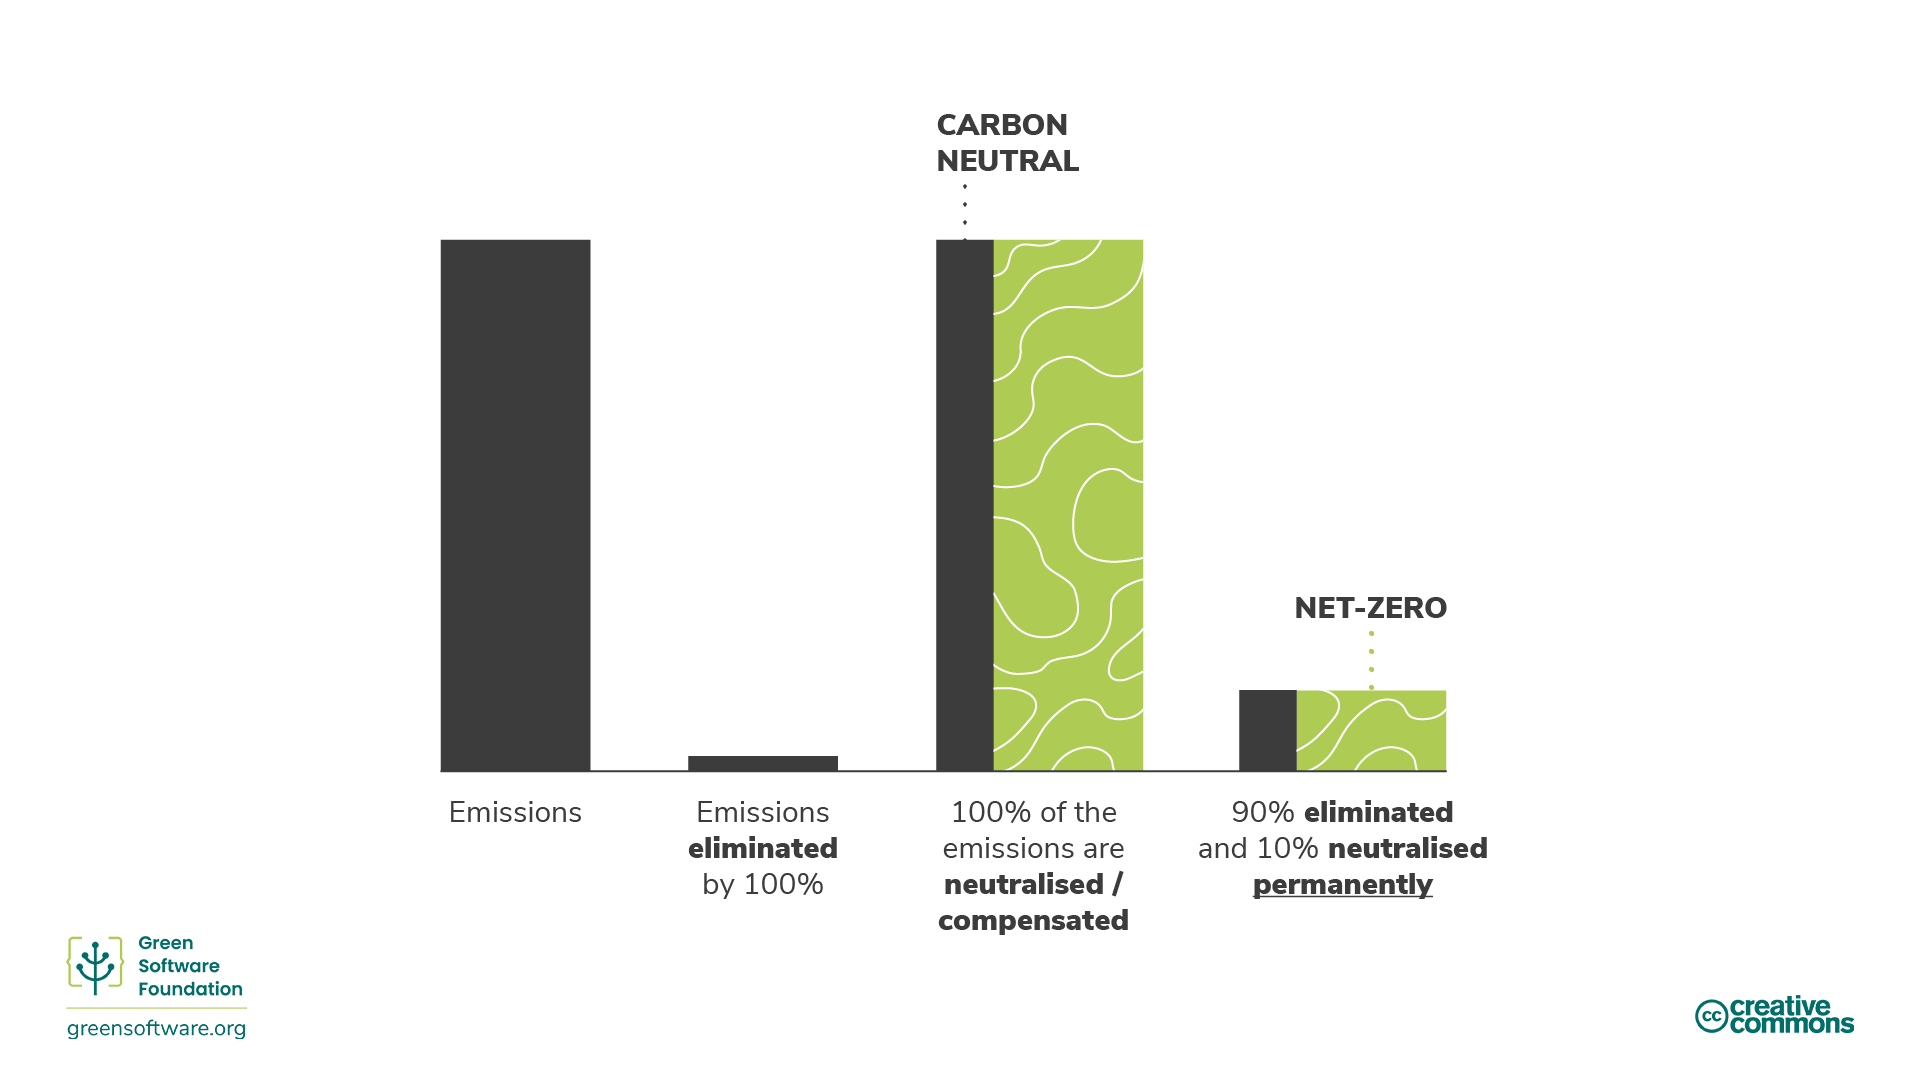
Diagram illustrating different emissions
reduction strategies
