Content from Introduction
Last updated on 2025-09-15 | Edit this page
Overview
Questions
- What is green HPC system use and how can we approach it?
- What research activities produce carbon emissions?
Objectives
- Define green HPC system use.
- Appreciate emissions from HPC in the wider context of other research activities.
What is green HPC system use?
Green HPC system use is carbon-efficient HPC system use, meaning it emits the least carbon possible. Only three activities reduce the carbon emissions associated with HPC system use: energy efficiency, carbon awareness, and hardware efficiency.
This workshop will explain all of these concepts, how to apply them to use cases on high-performance computing (HPC) systems and how to measure them, as well as some of the international guidelines and organisations that guide and monitor this space.
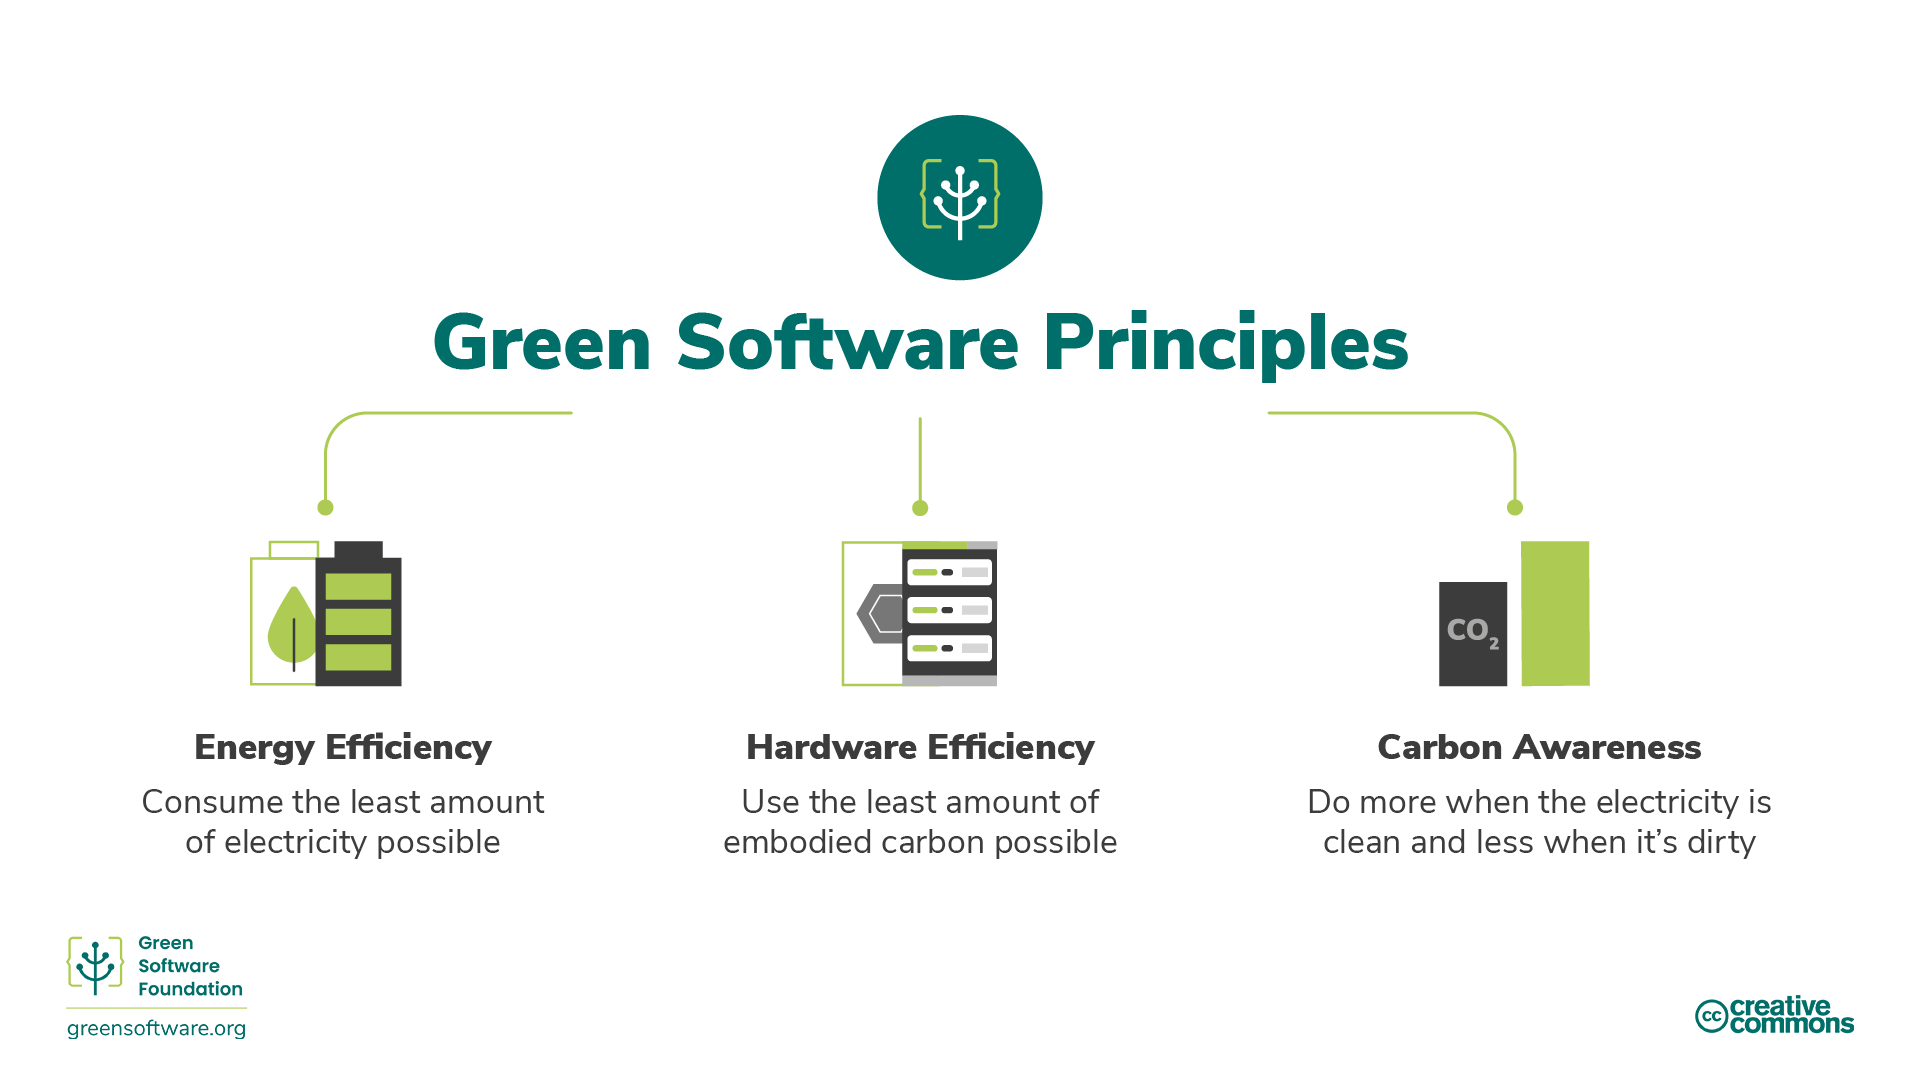
How to understand green HPC system use
In this workshop, we cover the covers 6 key areas of green use of HPC systems (based on the principles of green software engineering):
- Carbon Efficiency: Emit the least amount of carbon possible.
- Energy Efficiency: Use the least amount of energy possible.
- Carbon Awareness: Do more when the electricity is cleaner and do less when the electricity is dirtier.
- Hardware Efficiency: Use the least amount of embodied carbon possible.
- Measurement: What you cannot measure, you cannot improve.
- Reducing Emissions: Understand mechanisms of carbon reduction.
Each of these episodes will introduce some new concepts and explain in detail why they are important in terms of the climate, and how you can apply them on HPC systems. We will use the ARCHER2 UK National Supercomputing Serivce to provide concrete examples of how the principles can be applied.
Other work activities
Use of HPC will be only one part of your activities associated with your work and may not even be the largest source of carbon emissions (though this does not mean you should not work to make your use of HPC more carbon efficient!). As well as understanding carbon emissions from HPC, which this workshop will help you do, you also need to assess other activities you undertake as part of your work and try to estimate emissions associated with them.
Exercise: What does your work look like?
Write down the activities that you do as part of your work or research that could be a source of carbon emissions other than from HPC systems. Once you have them written down, can you rank them in order of what you think the largest source of emissions will be to the smallest?
You may have come up with activities from the following list:
- Travel to/from place of work
- Travel to/from and accommodation at conferences, training and meetings
- Use of other computing resources (e.g. laptops/workstations, cloud resources and the internet)
- Data storage
- Laboratory work - chemicals, instruments
- Printed materials - books, journal articles
Ranking them in order is more difficult and will differ from person to person. Typically, any sort of flying to conferences or meetings will be the most carbon intensive activity you can undertake through your work. Whether it is the largest contribution depends on how often you fly. If you work in a laboratory, that may well be the next highest source of emissions though if you commute a long way and use a petrol/diesel car that may also be one of the highest sources of emissions.
In fact, all activities that we undertake as part of our work (and personal life) produce carbon emissions. While, in an ideal world, we would be able to reduce emissions from all our activities we have finite time and effort so need to prioritise based on which reduction strategies will have the largest impact. This means that the first step is to estimate the emissions from different activities we are involved in as part of our work, even if the estimate is very rough. The links below can help to calculate your emissions:
- Travel emissions calculator (Deloitte UK)
- Emissions from laptops (Circular Computing)
- Transparent reporting of research-related greenhouse gas emissions through the scientific CO2nduct initiative
- Quantifying the carbon footprint of clinical trials: guidance development and case studies
- Emissions measurement and reporting approaches for the public sector (UK Government)
- Carbon footprint and mitigation strategies of three chemistry laboratories
- This course covers green HPC system use, in particular:
- Carbon Efficiency: Emit the least amount of carbon possible.
- Energy Efficiency: Use the least amount of energy possible.
- Carbon Awareness: Do more when the electricity is cleaner and do less when the electricity is dirtier.
- Hardware Efficiency: Use the least amount of embodied carbon possible.
- Measurement: What you cannot measure, you cannot improve.
- Reducing Emissions: Understand mechanisms of carbon reduction.
Content from Carbon Efficiency
Last updated on 2025-09-15 | Edit this page
Overview
Questions
- What does the term carbon equivalence (CO2e) mean?
- Can we also have positive emissions impacts from HPC systems?
Objectives
- Understand what CO2e means.
- Appreciate positive emissions impacts from HPC systems.
Carbon and CO2e
Carbon is often used as a broad term to refer to the impact of all types of emissions and activities on global warming. CO2e (sometimes: CO2eq/CO2-eq), which stands for carbon equivalence, is a measurement term used to measure this impact. For example, 1 ton of methane has the same warming effect as about 84 tons of CO2 over 20 years, so we normalise it to 84 tons CO2e. We may shorten even further to just carbon, which is a term often used to refer to all greenhouse gases (GHGs).
Carbon efficiency in HPC system use
In the HPC space, the part we can play in the climate solution is using HPC systems in a carbon efficient way. Being carbon efficient is about making sure your use of HPC systems emits the least carbon possible for the work you are doing. Or, for providers of HPC systems, it means procuring and operating the system in such a way as to minimise the carbon emissions. Ideally, you would also be able to quantify the positive carbon impacts from the work (or HPC system itself) to understand the overall net impact on carbon emissions - though doing this is typically quite challenging.
Exercise: Carbon emissions from HPC systems
What do you think the sources of carbon emissions may be from HPC system use? Write down 2-3 ideas of where you think emissions may come from.
You may have come up with sources such as:
- Emissions from electricity generation to power the HPC system
- Embodied emissions from manufacturing the HPC system components such as processors, memory and storage
- Embodied emissions from constructing the data centre and other infrastructure to house the HPC system
- Emissions associated with the people working to procure, run, and support the HPC system
Exercise: Positive emissions impacts
Write down the outcomes or activities that you do as part of your research or work that could be producing positive carbon emission impacts. Once you have them written down, can you rank them in order of what you think the largest impact on emissions will be to the smallest? Can you think of any way in which you might go about quantifying this positive impact so it could be included in a carbon audit of your work?
You may have come up with outcomes such as:
- The research or work you are engaged in is developing new innovations and technologies to reduce or eliminate emissions
- The research or work you are engaged in is providing data that is critical to efforts to quantify climate change and/or net zero strategies
- You are involved in training, education and/or activities raising awareness of carbon emissions and helping others to reduce their emissions
- You are developing resources and tools that help others to quantify and reduce their emissions
Quantifying positive emissions impacts are often even more difficult than quantifying the emissions we produce through our work but are critical to understanding how we are helping to meet climate commitments (which we will discuss later in this workshop).
For example, attending this workshop may empower you to go away and take some action to reduce the emissions associated with your work. Maybe each person who takes action following this workshop reduces their overall emissions by 2% this year but only 50% of people who come on the workshop manage to have this impact. This means that overall, we would see a 1% reduction in emissions for this year per person attending the workshop. If we assume that the work emissions per person per year are around 6,000 kgCO2e then this workshop would be estimated to save 60 kgCO2e per person attending the workshop.
Positive emissions impacts
As well as reducing emissions from our use of HPC systems there are typically other sources of positive carbon emissions impact associated with HPC.
The main source of reduced emissions from HPC system use is in the research that leads to new technology, policies and approaches to reducing emissions. Some examples include:
- HPC services run the climate models that are used to provide evidence for setting emissions reductions policies and targets across the world. Research and modelling on HPC services leads to development of improved zero emission energy generation by, for example, modelling new wind turbine and wind farm designs.
- Modelling to support the development of new energy storage technologies such as improved batteries.
The emissions reductions from such activities are extremely difficult to quantify for a number of reasons so, at the moment, these are not factored in to the emissions estimates for HPC systems and research more broadly but you should be aware of them and think about how they might apply to your research in particular.
As well as the research activities on HPC systems leading to reductions in emissions, there are other activities that HPC services can potentially take to have positive emissions impacts, for example:
- Using the waste heat generated by large scale HPC services as a heat source for homes, businesses or farming. For example, the LUMI HPC system in Finland is connected to the district heat network for the local city of Kaajani and helps heat homes and businesses.
- Incorporating environmental and biodiversity improvements into the service. For example, for the ACF data centre (which is in a rural location) that hosts ARCHER2, EPCC have been working to improve the site’s biodiversity and improve habitats.
- Responsible carbon offset schemes could also potentially be used to reduce emissions if they are undertaken as part of providing an HPC service.
- CO2e is a measurement term used to measure the impact of all greenhouse gases.
- Some activities we undertake on HPC systems can potentially have positive carbon impacts but these can be very difficult to quantify.
- Everything we do emits carbon into the atmosphere, and our goal is to emit the least amount of carbon possible. This constitutes the first principle of green HPC system use: carbon efficiency, emitting the least amount of carbon possible per unit of work.
Content from Energy Efficiency
Last updated on 2025-09-15 | Edit this page
Overview
Questions
- What are low carbon sources of electricity generation?
- How do we quantify energy efficiency?
- What aspects should we consider when looking at energy efficiency of HPC system use?
Objectives
- Understand how different ways of generating electricity lead to different carbon emission rates.
- Understand key concepts in improving energy efficiency of HPC system use.
- Appreciate how the different bounds on HPC application performance impact energy efficiency.
Introduction
Energy is the ability to do work. There are many different forms of energy, such as heat, electrical and chemical, and one type of energy can be converted to another. For example, we convert chemical energy in coal to heat energy, which drives a turbine to generate electrical energy. In other words, electricity is secondary energy converted from another energy type. In this way, we can think of energy as a measure of the electricity used.
All software - from large scale modelling and simulation on HPC systems, to the training of AI models, to the applications running on mobile phones - consumes electricity. One of the best ways to reduce electricity consumption and the subsequent carbon emissions made by software is to make our use of HPC facilities more energy efficient.
The reduction of energy consumed by work on an HPC system depends on a lot of things, including:
- the design and algorithm choices of the software engineers who wrote the software;
- the technology of the HPC system itself;
- how the source code is interpreted by compilers to produce machine-executable code (including compiler optimisations);
- the input and setup of the software given by the user themselves.
All of the people involved at different stages can impact the energy efficiency of use of the HPC system. Some people will only be able to impact one aspect but many people are involved in more than one of these aspects. For example, most researchers using HPC systems make use of software (specifying inputs and specifying the parallel distribution of work) and also design and write their own software (even if this is analysis scripts in a language such as Python).
Collectively, we must all take responsibility for the energy consumed by HPC systems. We should design both them and the software that runs on them, and then use the software on them to consume as little energy as possible. We should make sure that, at every step in the process, there is as little wasted energy as possible.
Let us take a look at some of these concepts and some ways that you can become more energy efficient at every stage.
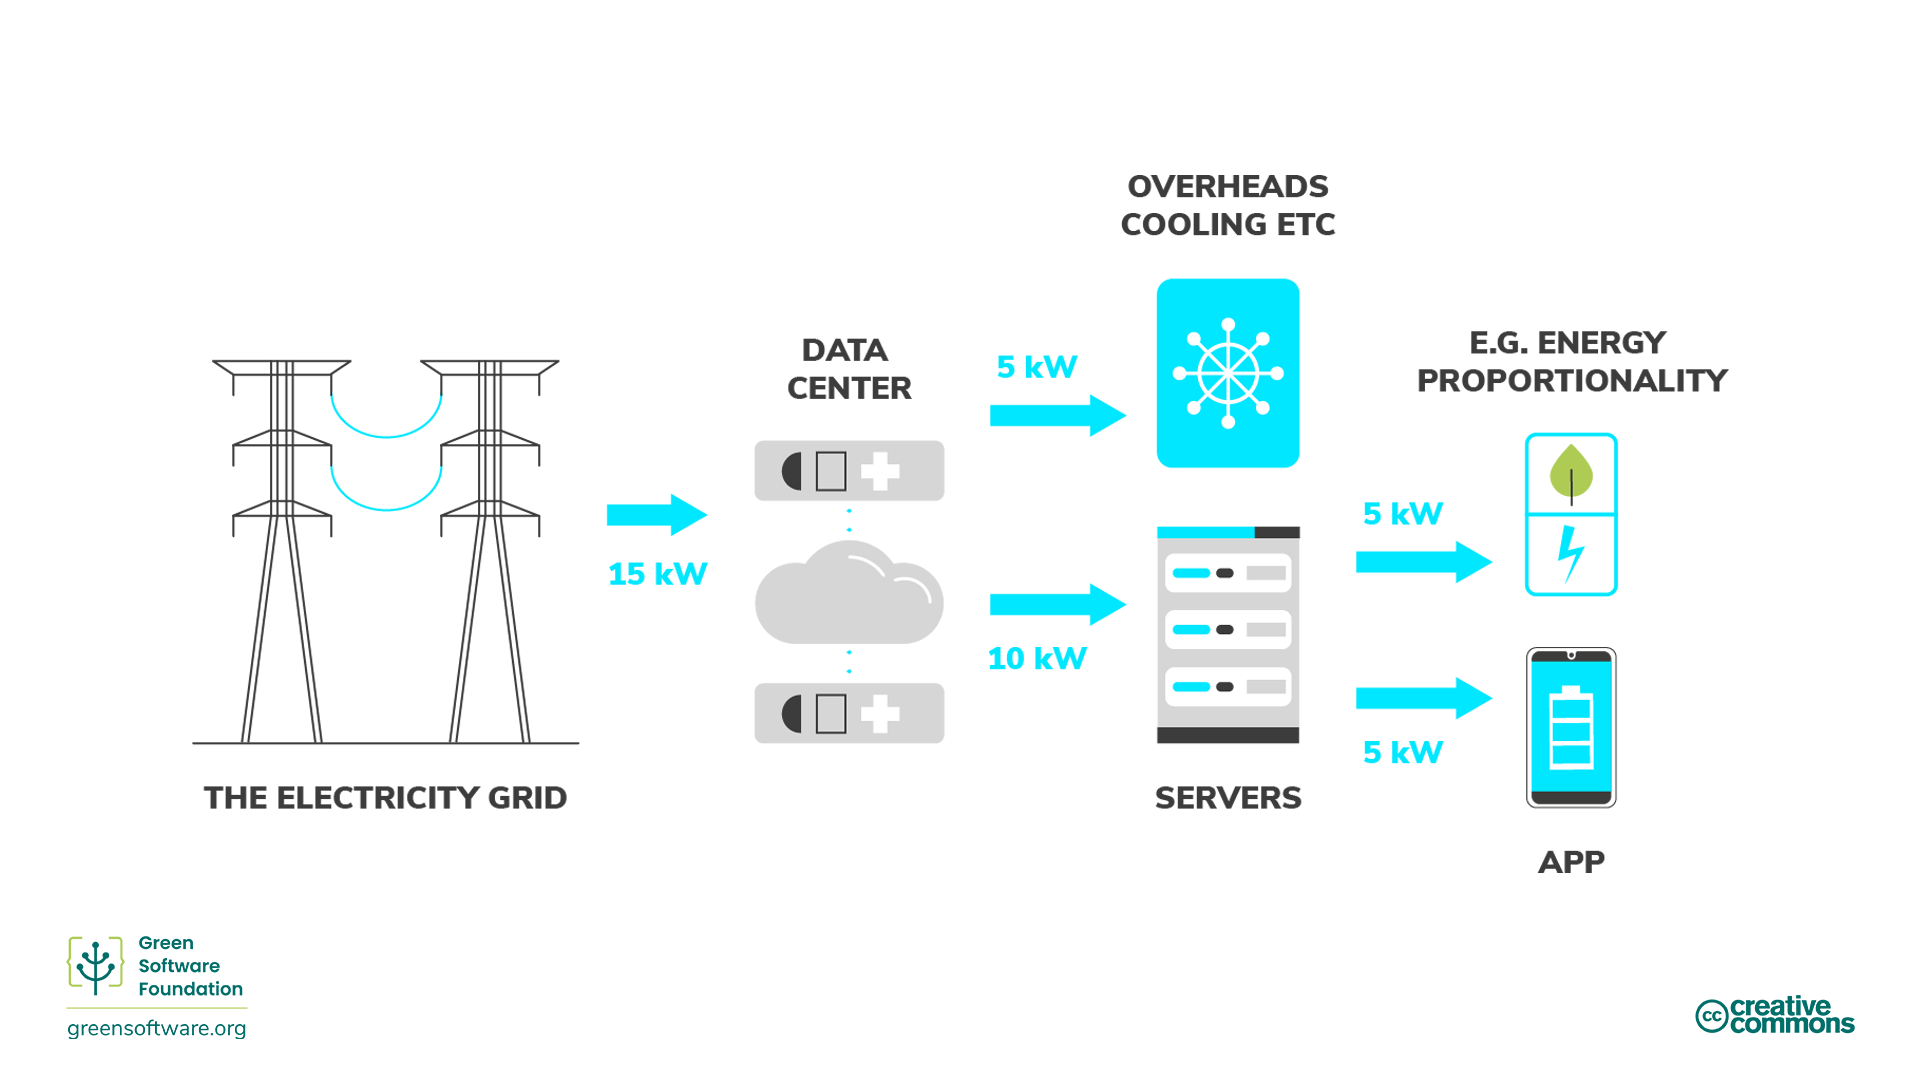
Key concepts
Fossil fuels and high-carbon sources of energy
Across the world, a lot of electricity is produced through burning fossil fuels, usually coal or gas. Fossil fuels are made from decomposing plants and animals. These fuels are found in the Earth’s crust and contain carbon and hydrogen, which can be burned for energy. Coal, oil, and natural gas are examples of fossil fuels.
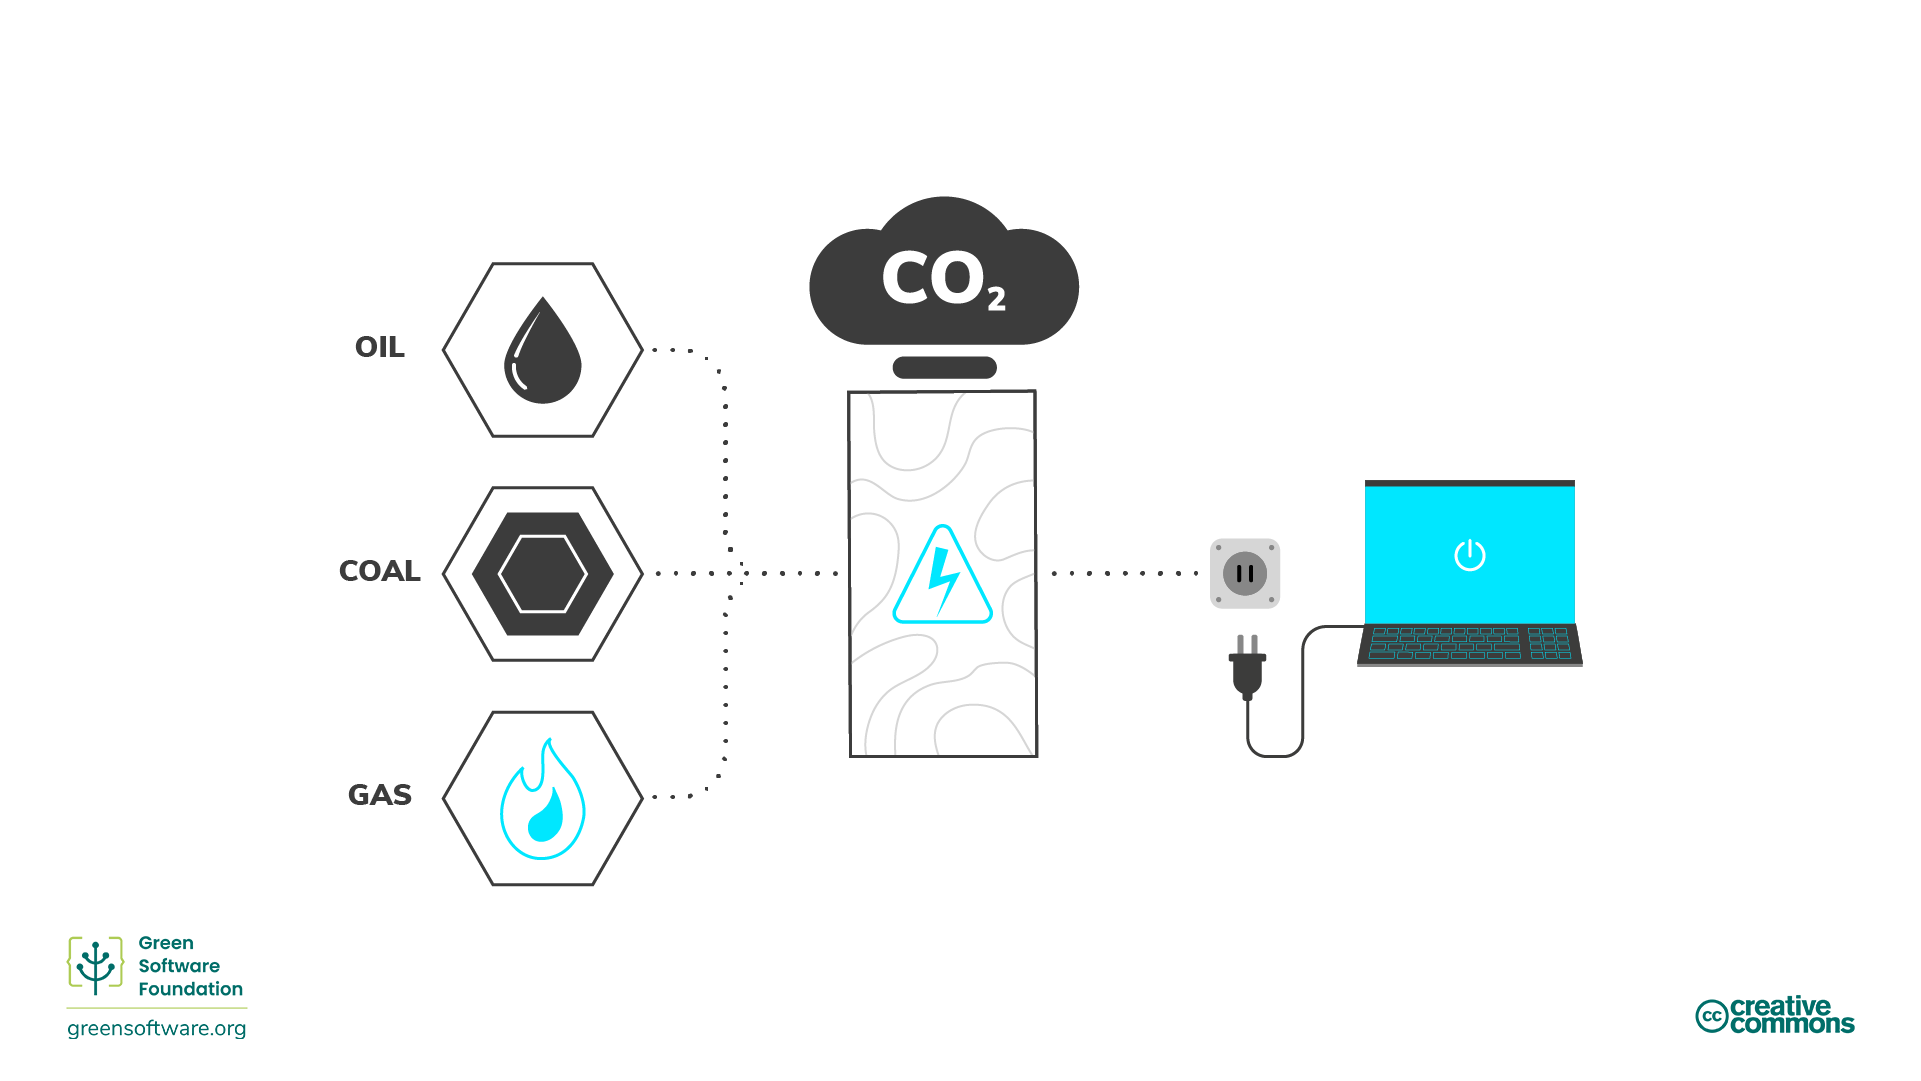
Most people think electricity is clean. Our hands do not get dirty when we plug something into a wall, and our laptops do not need exhaust pipes. However, in some geographical regions most electricity comes from burning fossil fuels and energy supply is the single most significant cause of carbon emissions. For HPC services hosted in such locations, we can draw a direct line from electricity to carbon emissions and, hence, electricity can be considered a proxy for carbon. If our goal is to be carbon efficient in our use of HPC hosted in these regions, then it means our goal is also to be energy efficient since energy is a proxy for carbon. This means using the least amount of energy possible per unit of work.
In the UK (where ARCHER2 is housed), GHG emissions from energy generation make up a much smaller proportion of emissions - 11.5% of total UK emissions in 2023. This is the 5th largest component of UK emissions that year, behind domestic transport (29%), buildings and product use (20%), industry (15%) and agriculture (12%). The emissions from electricity generation have dropped by over 78% from 1990 to 2023. (Data from UK Government: 2023 UK greenhouse gas emissions, provisional figures.) In locations where electricity generation is decarbonising so quickly, measuring electricity use from our use of HPC and using it as a proxy for carbon does not make as much sense as for regions where electricity generation has a large component generated by burning fossil fuels. Reducing electricity use is still part of the goal of greener use of HPC but other (embodied) sources of emissions become more important. We will discuss this later in this workshop.
UK reduced emissions driven by electricity generation changes
“Between 1990 and 2023, UK territorial carbon dioxide emissions decreased by 49.8%, and total greenhouse gas emissions by 52.7%. The largest factor behind this long-term decrease was the change in the mix of fuels being used for electricity generation, with a shift away first from coal to gas in the 1990s, and more recently to renewable energy sources. This was combined with lower electricity demand, owing to greater efficiency resulting from improvements in technology and a decline in the relative importance of energy intensive industries. Overall inland energy consumption is provisionally estimated to have decreased by 24.1% since 1990…”
From: 2023 UK greenhouse gas emissions, provisional figures
While there is still a lot of work to be done on decarbonising the UK electricity grid it is clear that further reductions in UK carbon emissions increasingly need to focus on other sources of carbon emissions.
Low-carbon sources of energy
Clean energy comes from renewable, zero-emission sources that do not pollute the atmosphere when used and save energy through energy-efficient practices. There are overlaps between clean, green, and renewable energy. Here is how we can differentiate between them:
- Clean energy - does not produce carbon emissions e.g. nuclear
- Green energy - sources from nature
- Renewable energy - sources will not expire e.g. solar, wind
Energy measurement
- Energy is measured in joules (J), the SI unit of energy.
- Power is measured in watts, where 1 watt (W) is a rate corresponding to one joule per second.
- A kilowatt (kW) is, therefore, also a rate corresponding to 1000 joules per second.
- A kilowatt-hour (kWh) is an alternative measure of energy (that is commonly used instead of J) corresponding to one kilowatt of power sustained for one hour.
Factors that impact energy efficiency
Now that we know how energy is produced and the associated cost in terms of emissions, based on whether low- or high-carbon energy sources are used. There are other concepts associated with operating HPC services that impact how much energy is used and so our energy efficiency. In particular, power usage effectiveness (PUE) and energy proportionality.
Power usage effectiveness
The data centre industry uses the power usage effectiveness (PUE) metric, developed by Green Grid in 2006, to measure data centre energy efficiency. Specifically, this relates to how much energy the computing equipment uses as compared to cooling and other overheads supporting the equipment. When a data center’s PUE is close to 1.0, computing is using nearly all energy. When the PUE is 2.0, this means an additional watt of power is required to cool and distribute power to the HPC equipment for every watt of computing power it uses.
Another way to think of PUE is as a multiplier to your energy consumption when using HPC. So, for example, if your use consumed 10 kWh and the PUE of the data center where it is running is 1.5, then the actual consumption from the grid is 15 kWh: 5kWh goes towards the operational overhead of the data center, and 10 kWh goes to the servers that are running your application.
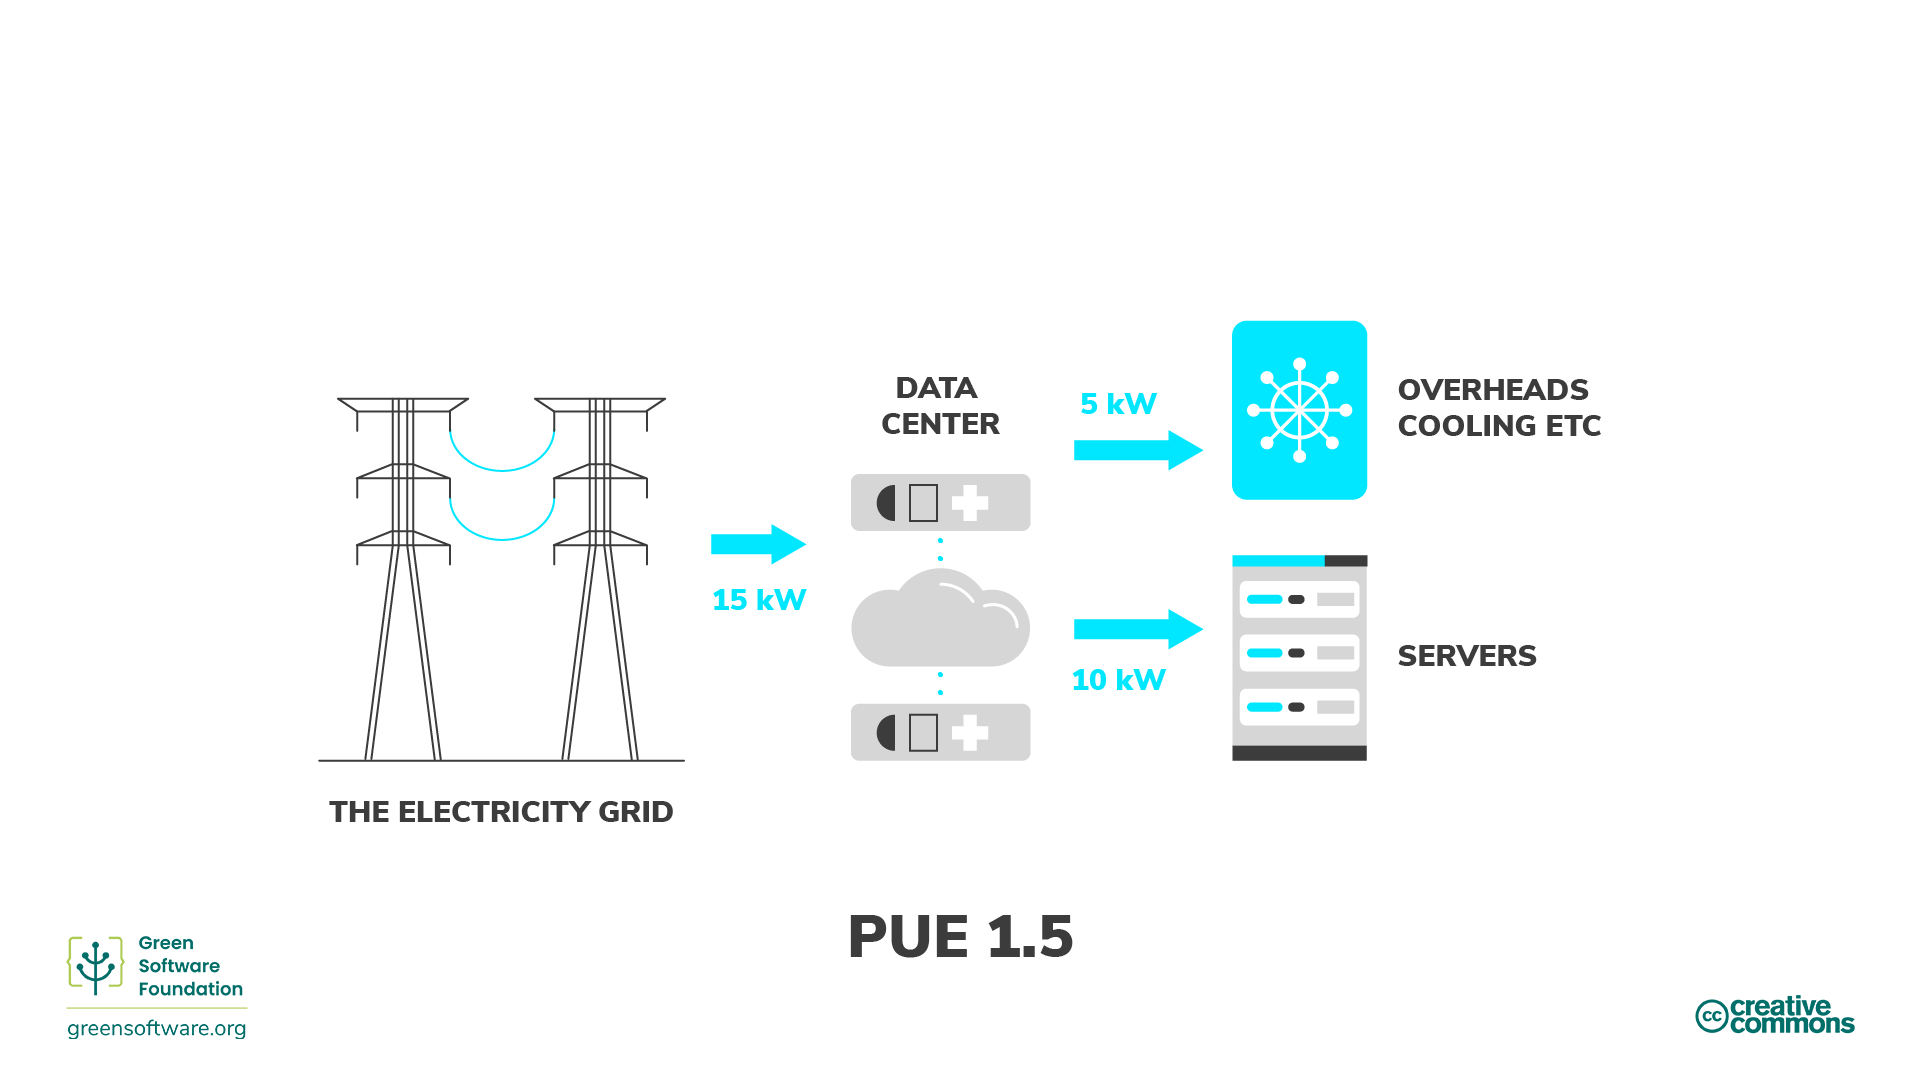
In many cases, PUE is not constant over time for the data centres that host HPC systems. The PUE value often depends on how much energy is required to cool the system. This obviously varies with load (as the more work a system is doing, the more power it is drawing and the more cooling it requires) but it often also varies with atmospheric conditions - the cooler the air temperature is, the less additional power you need to draw to cool the HPC system. HPC systems hosted in cooler locations can often make use of “free cooling” where refrigeration technology is not required to cool the system, the outside air (or water) temperature is cool enough to do this without the need for mechanical cooling.
ARCHER2 PUE
The PUE of the Advanced Data Centre (ACF) facility that hosts the ARCHER2 system in Edinburgh typically has a PUE of 1.1 as measured over a calendar year. As the ACF is situated in Scotland where air temperatures are cool, it benefits from free cooling for a large proportion of the year.
Energy proportionality
Energy proportionality, first proposed in 2007 by engineers at Google, measures the relationship between power consumed by a computer and the rate at which useful work is done (its utilisation).
Utilisation measures how much of a computer’s resources are used, usually given as a percentage. A fully utilised computer running at its maximum capacity has a high percentage, while an idle computer with no utilisation has a lower percentage.
The relationship between power and utilisation is not linearly proportional. Mathematically speaking, linear proportionality between two variables means their ratios are equivalent. As an example of the nonlinear relationship between utilisation and power draw, at 0% utilisation, a computer may draw 100 W; at 50%, it draws 180 W; and at 100%, it draws 200 W. The relationship between power consumption and utilisation is not linear and does not cross the origin.
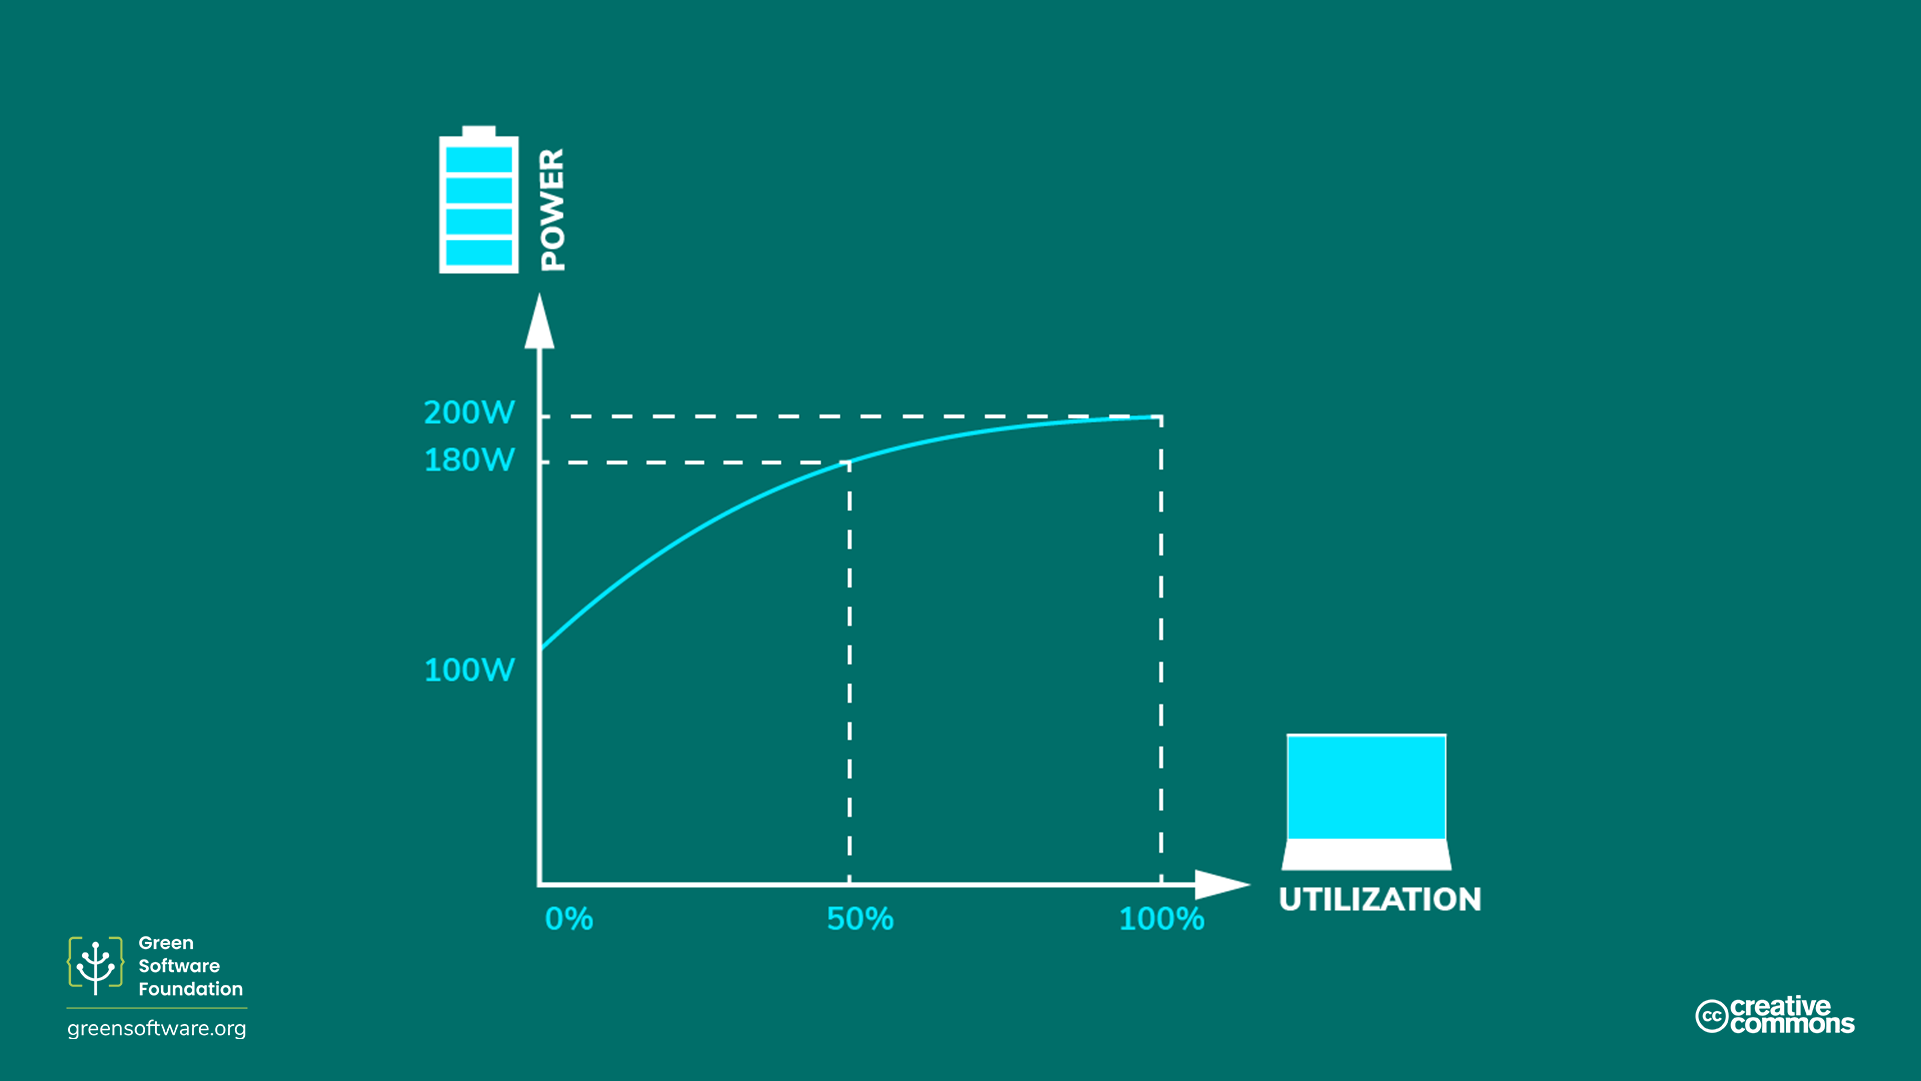
Because of this, the more we utilise a computer, the more efficient it becomes at converting electricity to practical computing operations. One way to improve hardware efficiency is to run the workload on as few servers as possible, with the servers running at the highest utilisation rate, maximising energy efficiency.
Usage efficiency in HPC systems
However, the story for HPC use is actually less straightforward than this description. The energy proportionality argument holds when the performance of an application is compute-bound - that is, when the output from the application you are running is strongly correlated with the performance of the processors. The performance of many HPC applications is actually memory-bound so the performance is dependent on the performance of data moving from memory to be processed. In these cases, once you are above a certain performance threshold for the floating point units any additional power draw does not lead to increased utilisation (i.e. useful performance for the application); the more you you utilise the processor, the more power you draw but you do not get any additional useful performance so this is just wasted electricity, reducing the energy efficiency of your use. It becomes even more complex as you run parallel applications (as typically happens on HPC resources) as the change in parallel distribution can change the balance between compute-bound and memory-bound performance for your application; meaning that you may need to choose different strategies to maximise energy efficiency at different parallelisations even for the same problem and software.
HPC application performance
Performance of HPC applications can be compute-bound, memory-bound, IO-bound, or communications-bound; and the utilisation argument made above only really applies to applications where performance is strongly compute-bound. In reality, the performance of most HPC applications is bound by different limits at different stages in their execution (e.g. IO-bound while reading in large datasets, compute-bound while calculating) and so a theoretical analysis of how the energy consumption changes as a function of processor utilisation is difficult to perform.
Static power draw
The static power draw of a computer is how much electricity is drawn when in an idle state. The static power draw varies by configuration and hardware components, but all parts have some static power draw. This is one of the reasons that PCs, laptops, and end-user devices have power-saving modes. If the device is idle, it will eventually trigger a hibernation mode and put the disk and screen to sleep or even change the CPU’s frequency. These power-saving modes save on electricity, but they have other trade-offs, such as a slower restart when the device wakes up.
HPC systems are usually not configured for aggressive or even minimal power saving when idle. Many use cases running on servers demand total capacity as quickly as possible because the server needs to respond to rapidly changing demands, which leads to many servers in idle modes during low-demand periods. An idle server has a carbon cost from both the embedded carbon as well as its inefficient utilisation. This is one reason why the goal of many HPC systems is to maximise utilisation.
Practical advice
Given this complexity, what practical steps can you take to decide on how to run in an energy-efficient manner on HPC systems? The answer is to run some test cases and measure the energy consumption and performance, then change parameters (such as processor power cap, or number of parallel processes) and measure again to see what the impact is on both performance and energy consumption. Using a benchmarking approach such as this, you can practically improve the energy efficiency of your use of HPC.
If you happen to be a developer of the software you are using then you may also be able to change the algorithms, data layout and other aspects of the software to improve energy efficiency. Such approaches are beyond the scope of this workshop but benchmarking energy consumption also form a core component of this work.
Exercise: Energy efficiency on HPC systems
An application (GROMACS) running on ARCHER2 has the following performance characteristics and energy use at different node counts and different CPU frequency settings. What are the most energy efficient combinations in kWh/ns of node count and CPU frequency for these types of calculations? Which is the worst, and how large is the percentage difference between the best and worst cases?
| 2.0 GHz | 2.25 GHz + boost | ||||
|---|---|---|---|---|---|
| Node count | ns simulated | Runtime (s) | kWh | Runtime (s) | kWh |
| 1 | 0.020 | 369 | 0.0464 | 288 | 0.0464 |
| 2 | 0.020 | 198 | 0.0450 | 156 | 0.0465 |
| 3 | 0.020 | 155 | 0.0438 | 109 | 0.0465 |
| 4 | 0.020 | 117 | 0.0471 | 93 | 0.0513 |
We can compute the energy efficiency in kWh/ns by dividing the energy used by the number of ns simulated:
| 2.0 GHz | 2.25 GHz + boost | ||||
|---|---|---|---|---|---|
| Node count | ns simulated | Runtime (s) | kWh/ns | Runtime (s) | kWh/ns |
| 1 | 0.020 | 369 | 2.32 | 288 | 2.32 |
| 2 | 0.020 | 198 | 2.25 | 156 | 2.32 |
| 3 | 0.020 | 155 | 2.19 | 109 | 2.32 |
| 4 | 0.020 | 117 | 2.36 | 93 | 2.56 |
So, the most energy efficient combination is 3 nodes at 2 GHz CPU clock frequency and the worst is 4 nodes with 2.25 GHz + boost CPU clock frequency. The worst case is around 17% less energy efficient than the best case. While this difference may not amount to much energy for a single run, if hundreds or thousands of simulations are run as part of a project this can lead to a significant reduction in consumed energy.
- In regions where electricity production is dominated by burning fossil fuels, electricity is a good proxy for carbon, so using HPC in an energy efficient way is equivalent to using HPC in a way that is carbon efficient.
- In regions of where electricity production is dominated by low carbon energy sources, electricity is not a good proxy for carbon.
- Green HPC use takes responsibility for its electricity consumption and considers how this relates to carbon emissions.
- Quantifying the energy consumption of your HPC use is a step in the right direction to start thinking about how you can operate more efficiently. However, understanding the energy consumption of your use of HPC is not the only story. The hardware your software is running on uses some of the electricity for operational overhead. This can be estimated through the power usage efficiency (PUE) metric for HPC systems (and for computing resources hosted in data centres more generally).
- How you go about improving the energy efficiency of use of an HPC system depends on the software you are using and the input parameters as well as the hardware.
- Often, the only practical way forward in the face of this complexity is to perform some benchmarking to assess how energy efficiency can be improved.
Content from Carbon Awareness
Last updated on 2025-09-16 | Edit this page
Overview
Questions
- How does electricity generation affect GHG emissions?
- What is carbon intensity of electricity generation and how does it vary geographically and temporally?
- What techniques can I use to make my use of HPC greener and influence transition to low-carbon electricity generation?
Objectives
- Understand the concept of carbon intensity in electricity generation.
- Appreciate the level of variation in carbon intensity across the UK and the world.
- Understand techniques for greener use of HPC: demand shifting and demand shaping.
Introduction
Not all electricity is produced in the same way. In different locations and times, electricity is generated using a variety of sources with varying carbon emissions. Some sources (such as wind, solar, or hydroelectric) are clean, renewable sources that emit little carbon. On the other hand, fossil fuel sources emit carbon at varying degrees to produce electricity. For example, both gas and coal emit more carbon than renewable sources, but gas-burning power plants emit less carbon than coal-burning power plants.
Carbon awareness is the idea of doing more when more energy comes from low carbon sources and doing less when more energy comes from high carbon sources.
Key concepts
Carbon intensity
Carbon Intensity (CI) measures how much carbon (CO2e) is emitted per kilowatt-hour (kWh) of electricity consumed. The standard unit of carbon intensity is gCO2e/kWh, or grams of carbon per kilowatt hour.
If your computer is plugged directly into a wind farm, its electricity would have a carbon intensity of 0 gCO2e/kWh since a wind farm emits no carbon to produce that electricity. However, most people cannot plug directly into wind farms; instead, they plug into power grids supplied with electricity from various sources.
Embodied carbon of renewable sources
In reality, the carbon intensity of renewable sources still have some GHG emissions associated with them from the emissions used to build, operate and decommission them. As we will see in a later episode, these emissions are usually amortised across the lifetime of the facility (in this case, the lifetime of the generation facility). By convention, these embodied emissions are not usually included in carbon intensity values for generated energy as they are complex to calculate and the emissions saved by replacing non-renewable sources with renewable sources have vastly outweighed the embodied emissions of renewable sources. These emissions sources will become a more important component of energy generation as electricity grids continue to decarbonise.
Once on a grid, you can not control which sources supply the electricity you are using; you simply get a mix of everything. So, your carbon intensity will be a mix of all the current power sources in a grid, both the lower- and the higher-carbon sources.
Variability of carbon intensity
Carbon intensity varies by location since some regions have an energy mix containing more clean energy sources than others. This table shows the average carbon intensity for UK regions over 2024 (ref: electricityinfo.org regional carbon intensity history):
| Type | Regions | Carbon Intensity (gCO2e/kWh) |
|---|---|---|
| Low | N. Scotland, S. Scotland, N.E. England, N.W. England | 22 - 48 |
| Low Medium | N. Wales | 77 |
| Medium | E. England, London, W. Midlands, S.E. England, Yorkshire | 108 - 135 |
| High Medium | S. England, E. Midlands | 186 - 203 |
| High | S.W. England, S. Wales, | 242 - 255 |
Similarly, this table compares values across the world in 2023 (ref: Our World In Data):
| Country | Carbon Intensity (gCO2e/kWh) |
|---|---|
| France | 56 |
| UK | 238 |
| USA | 369 |
| Germany | 381 |
| Russia | 441 |
| Japan | 485 |
| Australia | 549 |
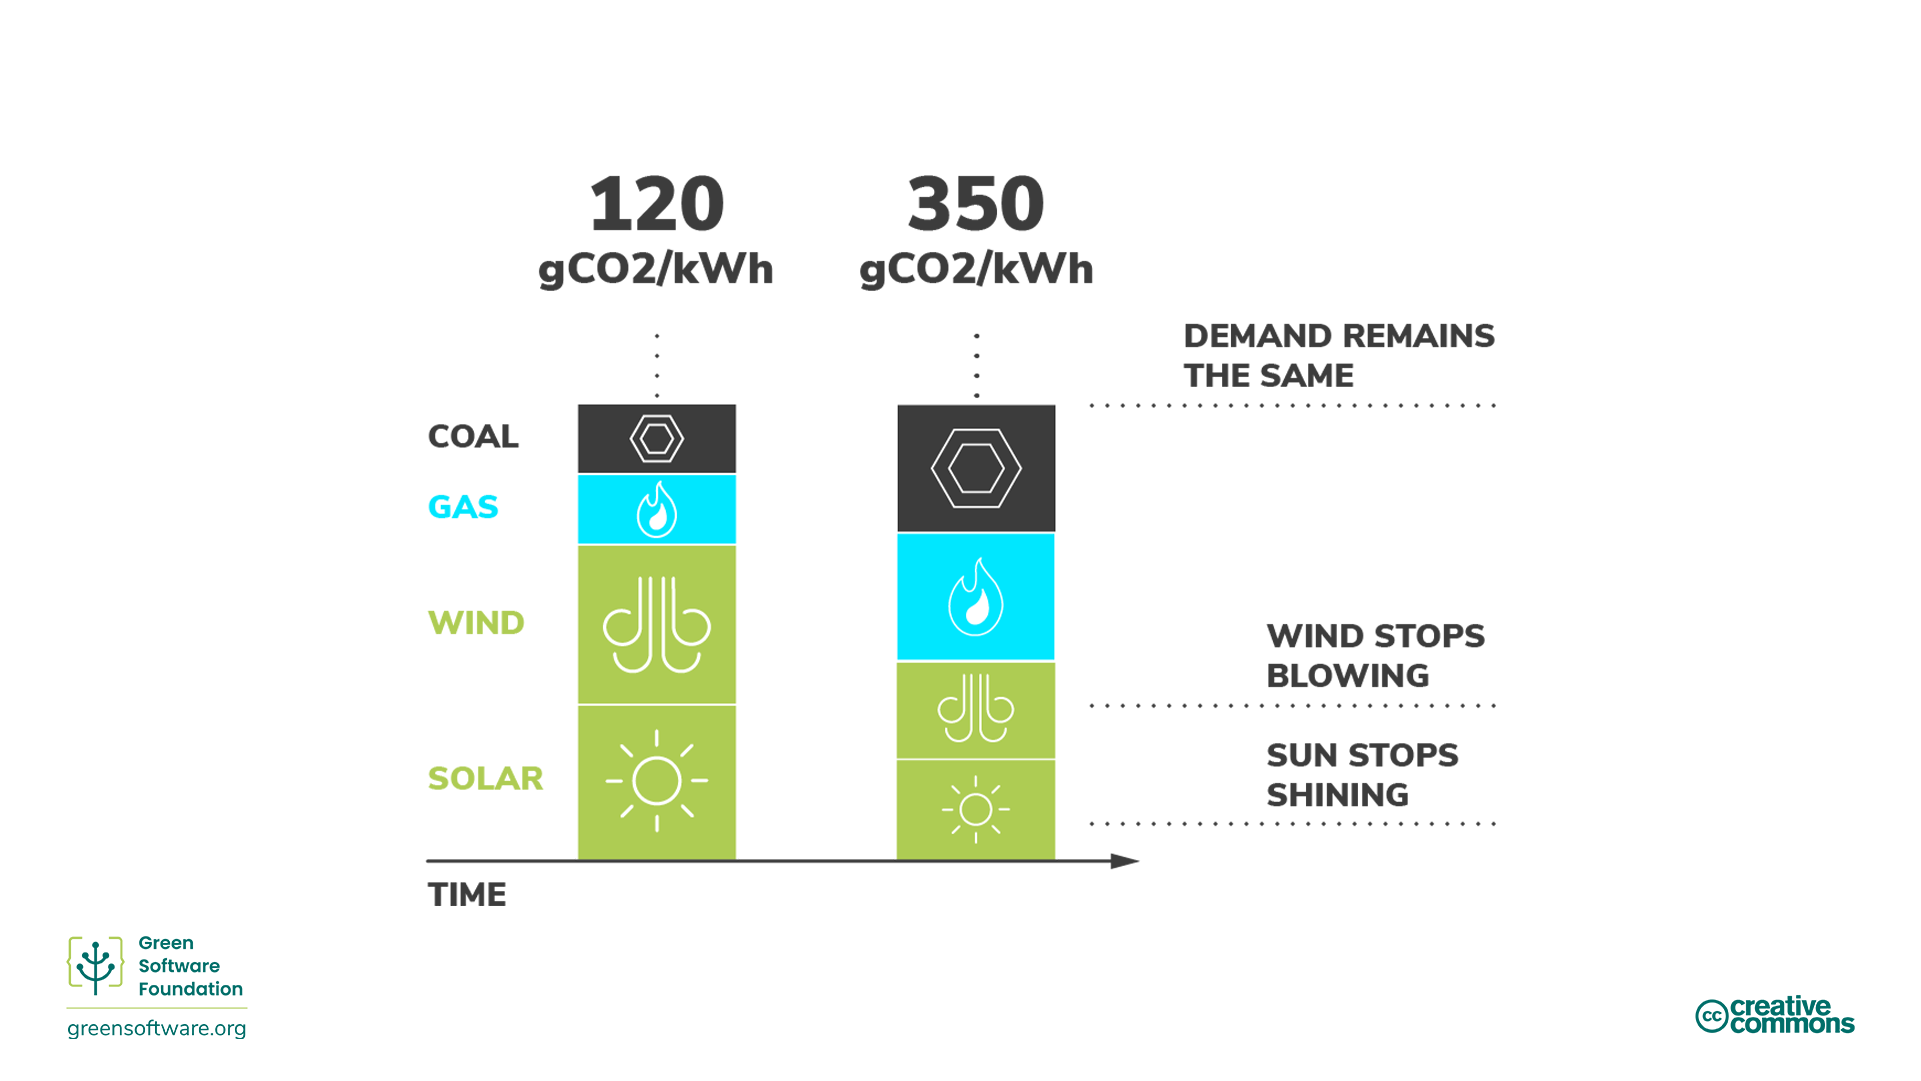
Carbon intensity also changes over time due to the inherent variability of renewable energy caused by the unpredictability of weather conditions. For example, when it is cloudy or the wind is not blowing, carbon intensity increases since more of the electricity in your mix comes from sources that emit carbon.
Exercise: Carbon emissions from HPC systems
One estimate of the power draw of the ARCHER2 HPC system is 3.1 MW (including overheads from the power/cooling plant). Mean carbon intensities from different UK regions in 2024 give low emissions regions as ~30 gCO2e/kWh, medium emissions regions as ~120 gCO2e/kWh and high emissions regions as ~250 gCO2e/kWh. What would the carbon emissions be from electricity use in 1 year of ARCHER2 operations in the three different emissions regimes?
First we need to estimate the amount of energy consumed by ARCHER2 in kWh for 1 year from the power draw estimate, this is given by:
3,100 kW x 365 days x 24 hours = 27,156,000 kWhNow, we can multiply this energy use by the carbon intensity values to get the estimated emissions from a year of ARCHER2 operation in the three different locations. e.g. for the low emissions location:
27,156,000 kWh x 0.030 kgCO2e/kWh = 815,000 kgCO2e- Low CI (30 gCO2e/kWh) = 815,000 kgCO2e
- Medium CI (120 gCO2e/kWh) = 3,260,720.0 kgCO2e
- High CI (250 gCO2e/kWh) = 6,790,000.0 kgCO2e
Hosting ARCHER2 in a high CI region instead of a low CI region would lead to an additional 5,980,000 kgCO2e emissions per year.
Dispatchability & curtailment
Electricity demand varies during the day and supply always needs to be able to meet that demand. A brownout (a dip in the voltage level of the power line) occurs if a utility does not produce enough electricity to meet demand. Conversely, if a utility produces more electricity than is required, then to stop infrastructure burning out, breakers trip and we have blackouts.
There needs to be a balance between the demand and supply of electricity at all times and the responsibility for this usually falls to the utility provider.
In the case of fossil fuels such as coal, it is easier to control the power produced for this supply; this is called dispatchability. However, in the case of renewable power sources such as wind farms, the power produced cannot easily be controlled (we cannot control how much the wind blows). If the power source produces more electricity than is needed, that electricity is thrown away; this is called curtailment.
Marginal carbon intensity
If you suddenly need to access more power - for example, you need to turn on a light - that energy comes from the marginal power plant. The marginal power plant is dispatchable, which means marginal power plants are often powered by fossil fuels.
Marginal carbon intensity is the carbon intensity of the power plant that would have to be employed to meet any new demand.
Fossil-fueled power plants rarely scale down to 0. They have a minimum functioning threshold, and some do not scale; they are considered a consistent, always-on baseload. Because of this, we sometimes have the scenario where we curtail (throw away) renewable energy while still consuming energy from fossil fuel power plants.
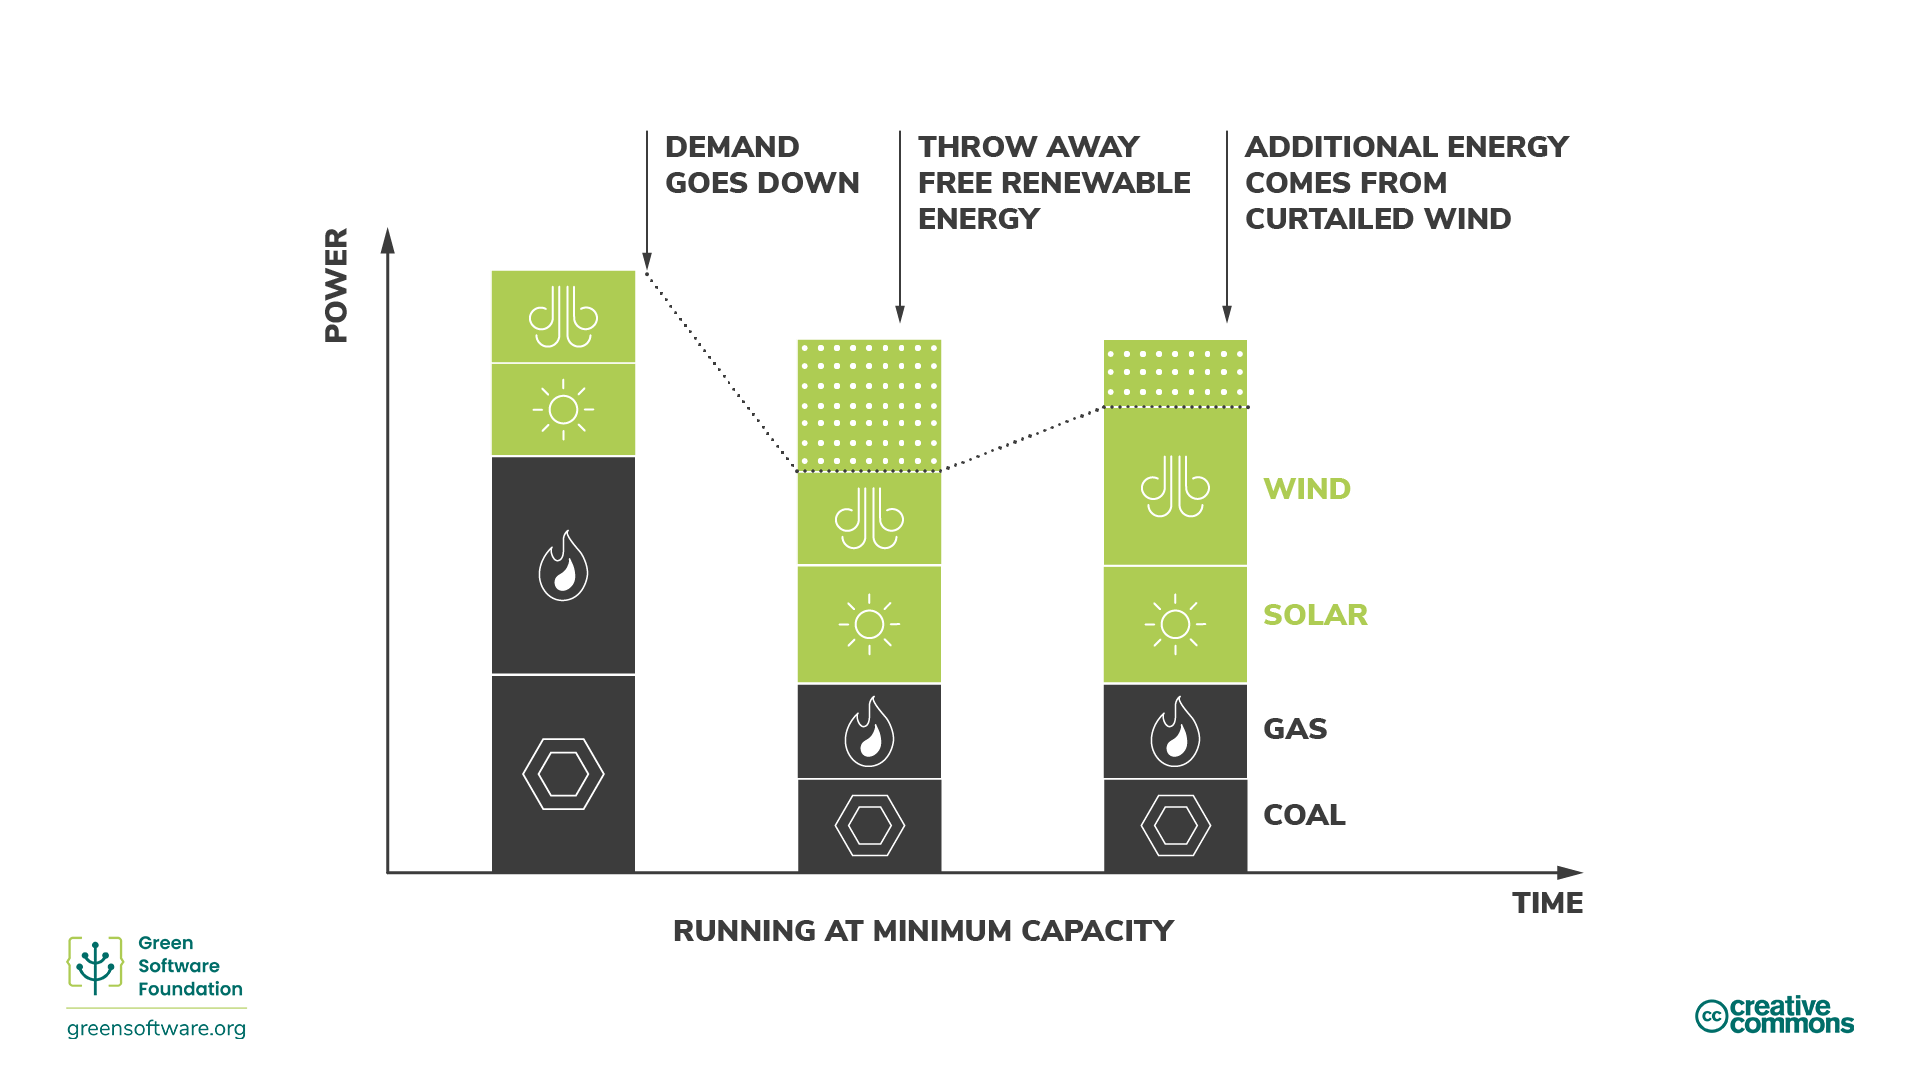
In these situations, the marginal carbon intensity will be 0 gCO2e/kWh since we know that any new demand will match the renewable energy we are curtailing.
Energy markets
The exact market model varies around the world but broadly follows the same model.
When the demand for electricity goes down, utilities need to reduce the supply to balance supply and demand. They can do this in one of two ways:
- Buy less energy from fossil fuel plants.
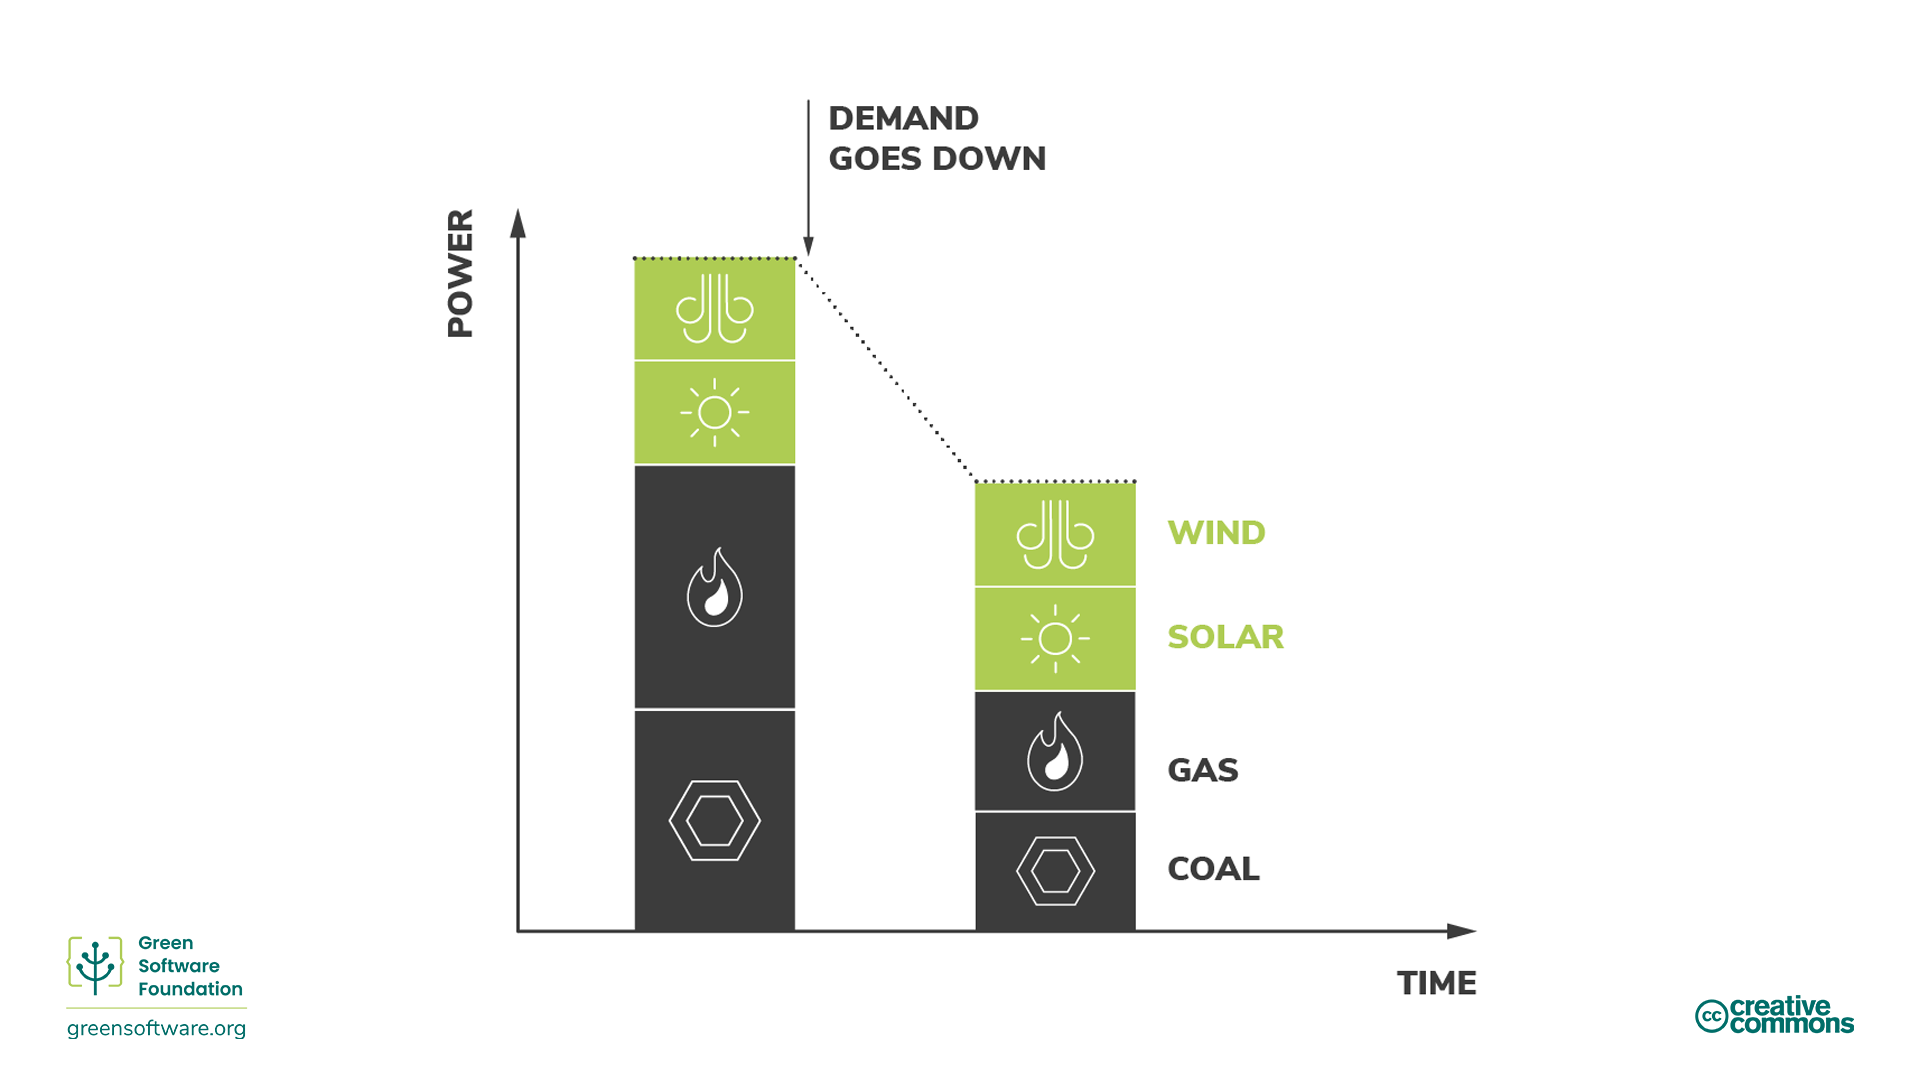
Energy from fossil fuel plants is usually the most expensive so this is the preferred method. This directly translates to burning fewer fossil fuels.
- Buy less energy from renewable sources.
Renewable sources are the cheapest, so they prefer not to do this. If a renewable source does not manage to sell all of its electricity, it has to throw the rest away.
Reducing the amount of electricity consumed by your use of HPC can help decrease the carbon intensity of the energy required as the first thing to be scaled back are fossil fuels.
When the demand for electricity goes up, utilities need to increase the supply to balance supply and demand. They can do this in one of two ways:
- Buy more energy from renewable sources that are currently being curtailed
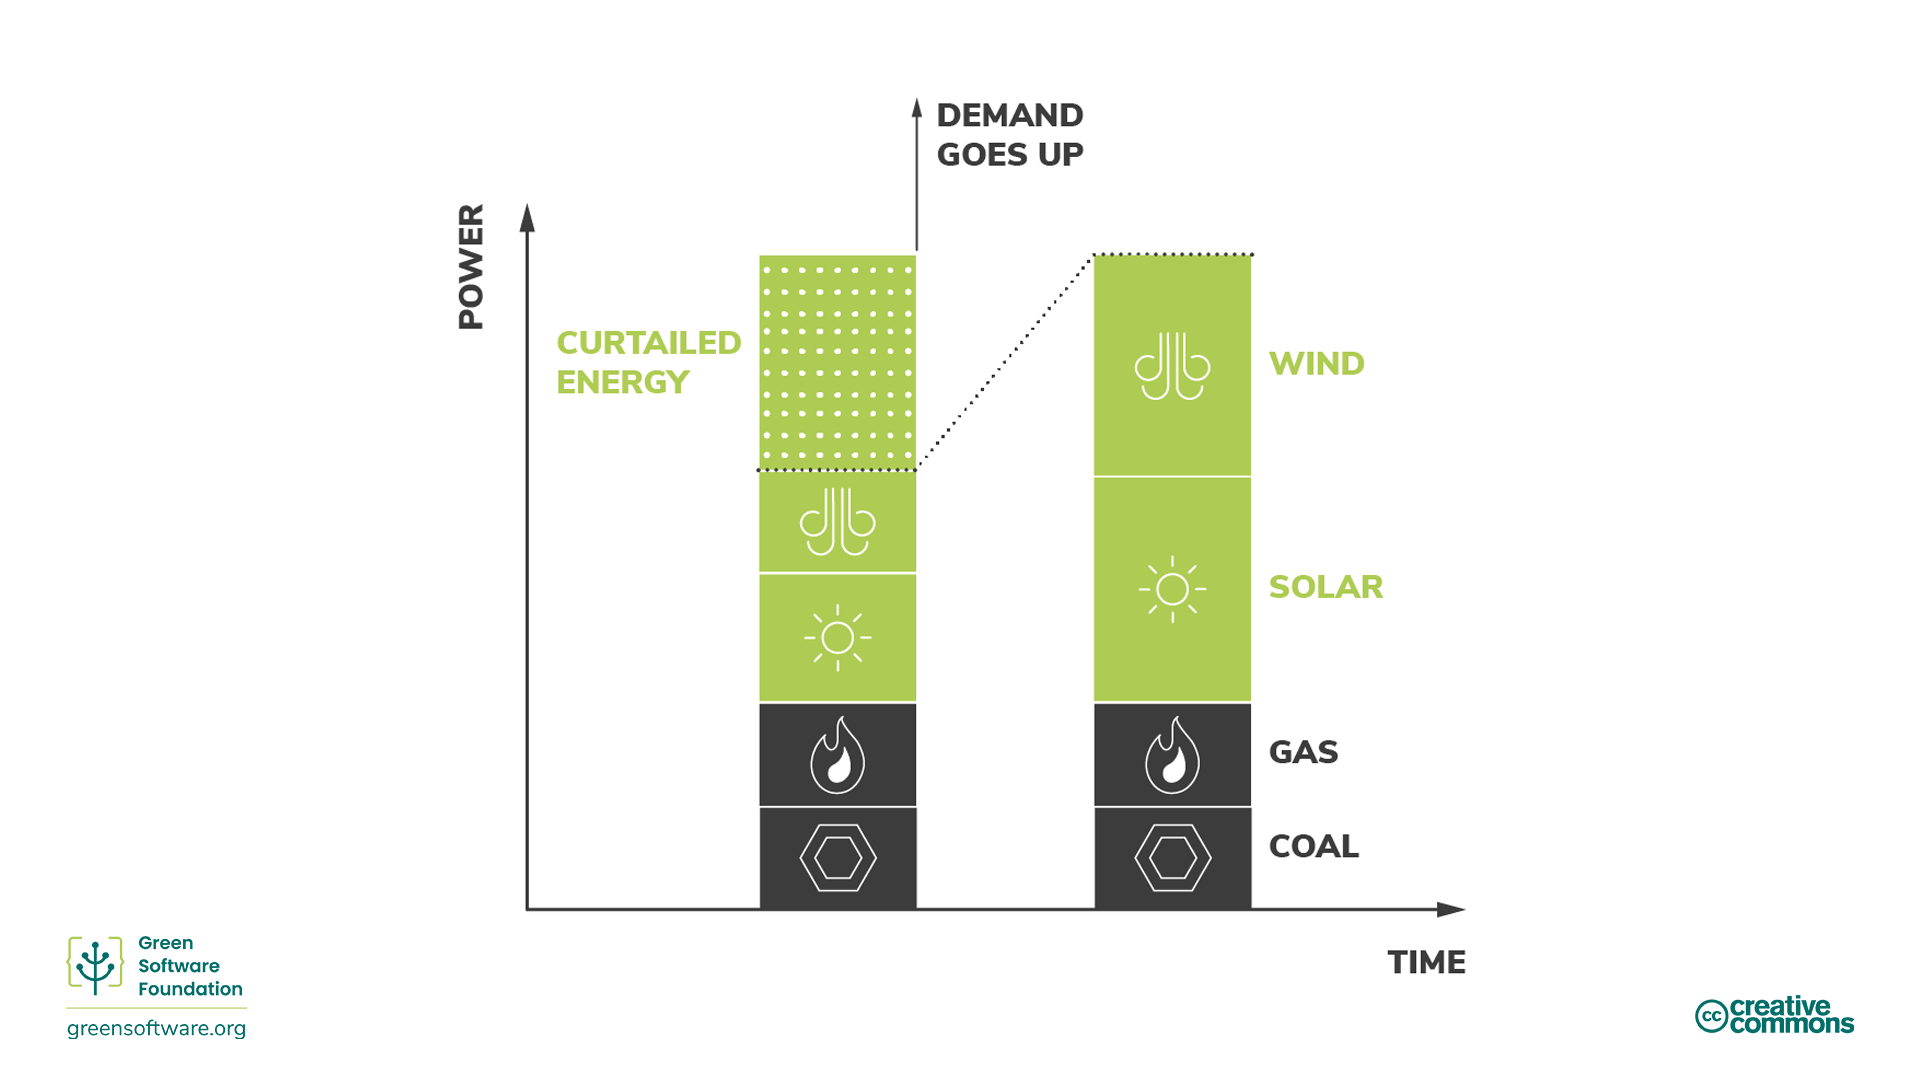
If you are curtailing, it means you have excess energy you could dispatch. Renewable energy is already the cheapest, so curtailed renewable energy will be the cheapest dispatchable energy source. Renewable plants will then sell the energy they would have had to curtail.
- Buy more energy from fossil fuel plants.
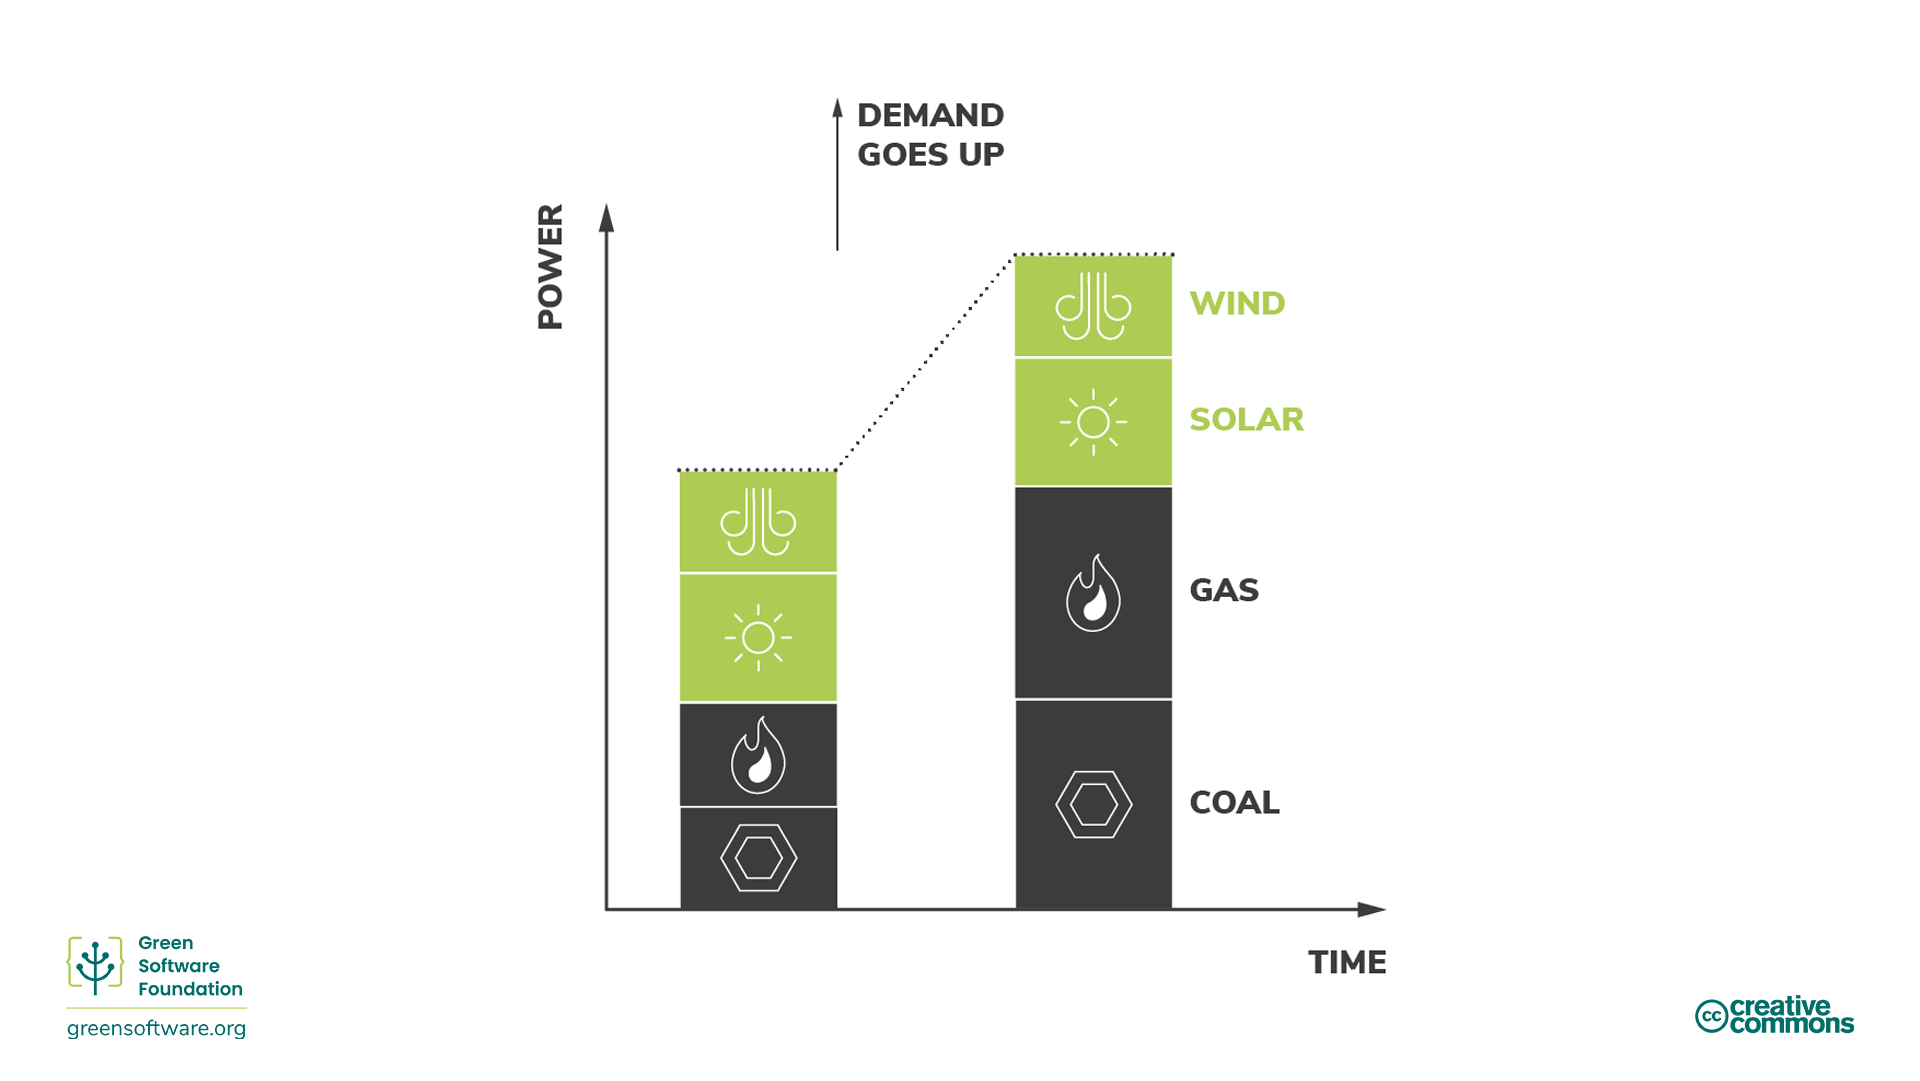
Fossil fuels are inherently dispatchable; they can quickly increase energy production by burning more. However, coal costs money, so this is the least preferred solution.
Energy markets are some of the most complex markets in the world so the above explanation is a simplification. But what is important to understand is that our goal is to increase investment into lower carbon energy sources, like renewables, and decrease investment into higher carbon sources, like coal. The best way to ensure money flows in the right direction is to make sure you use electricity with the least carbon intensity.
How to be more carbon aware
Using electricity when the carbon intensity is low is the best way to ensure investment flows towards low-carbon emitting plants and away from high-carbon emitting plants.

There is a global transformation happening right now. All around the world, electricity grids are changing from primarily burning fossil fuels to sourcing energy from lower carbon sources like wind and solar. This is one of our best hopes for meeting our global reduction targets. As green users of HPC systems, let’s see some of the ways we can help accelerate that transition.
The primary driver for the transition is economic rather than any sustainability target. Renewables are winning because they are cheaper and getting even more affordable over time. So, to help accelerate the transition, we need to make renewable plants more profitable and fossil fuel plants less profitable. The best way to do that is to use more electricity when it’s coming from lower-carbon sources like renewables and less electricity when it’s coming from higher-carbon sources.
Carbon intensity is lower when more energy comes from lower-carbon sources and higher when it comes from higher-carbon sources.
Demand shifting
Being carbon aware means responding to shifts in carbon intensity by increasing or decreasing your demand. If your work allows you to be flexible with when and where you run workloads, you can shift accordingly - consuming electricity when the carbon intensity is lower and pausing production when it is higher. For example, running a simulation or model at a different time or in a different region with much lower carbon intensity.
Studies show these actions can result in 45% to 99% carbon reductions depending on the number of renewables powering the grid.
Demand shifting can be further broken down into spatial and temporal shifting.
Spatial shifting
Spatial shifting means moving your computation to another physical location where the current carbon intensity is lower. It might be a region that naturally has lower carbon sources of energy. For example, using an HPC facility sited in a location that is currently windy and so has a high proportion of wind power.
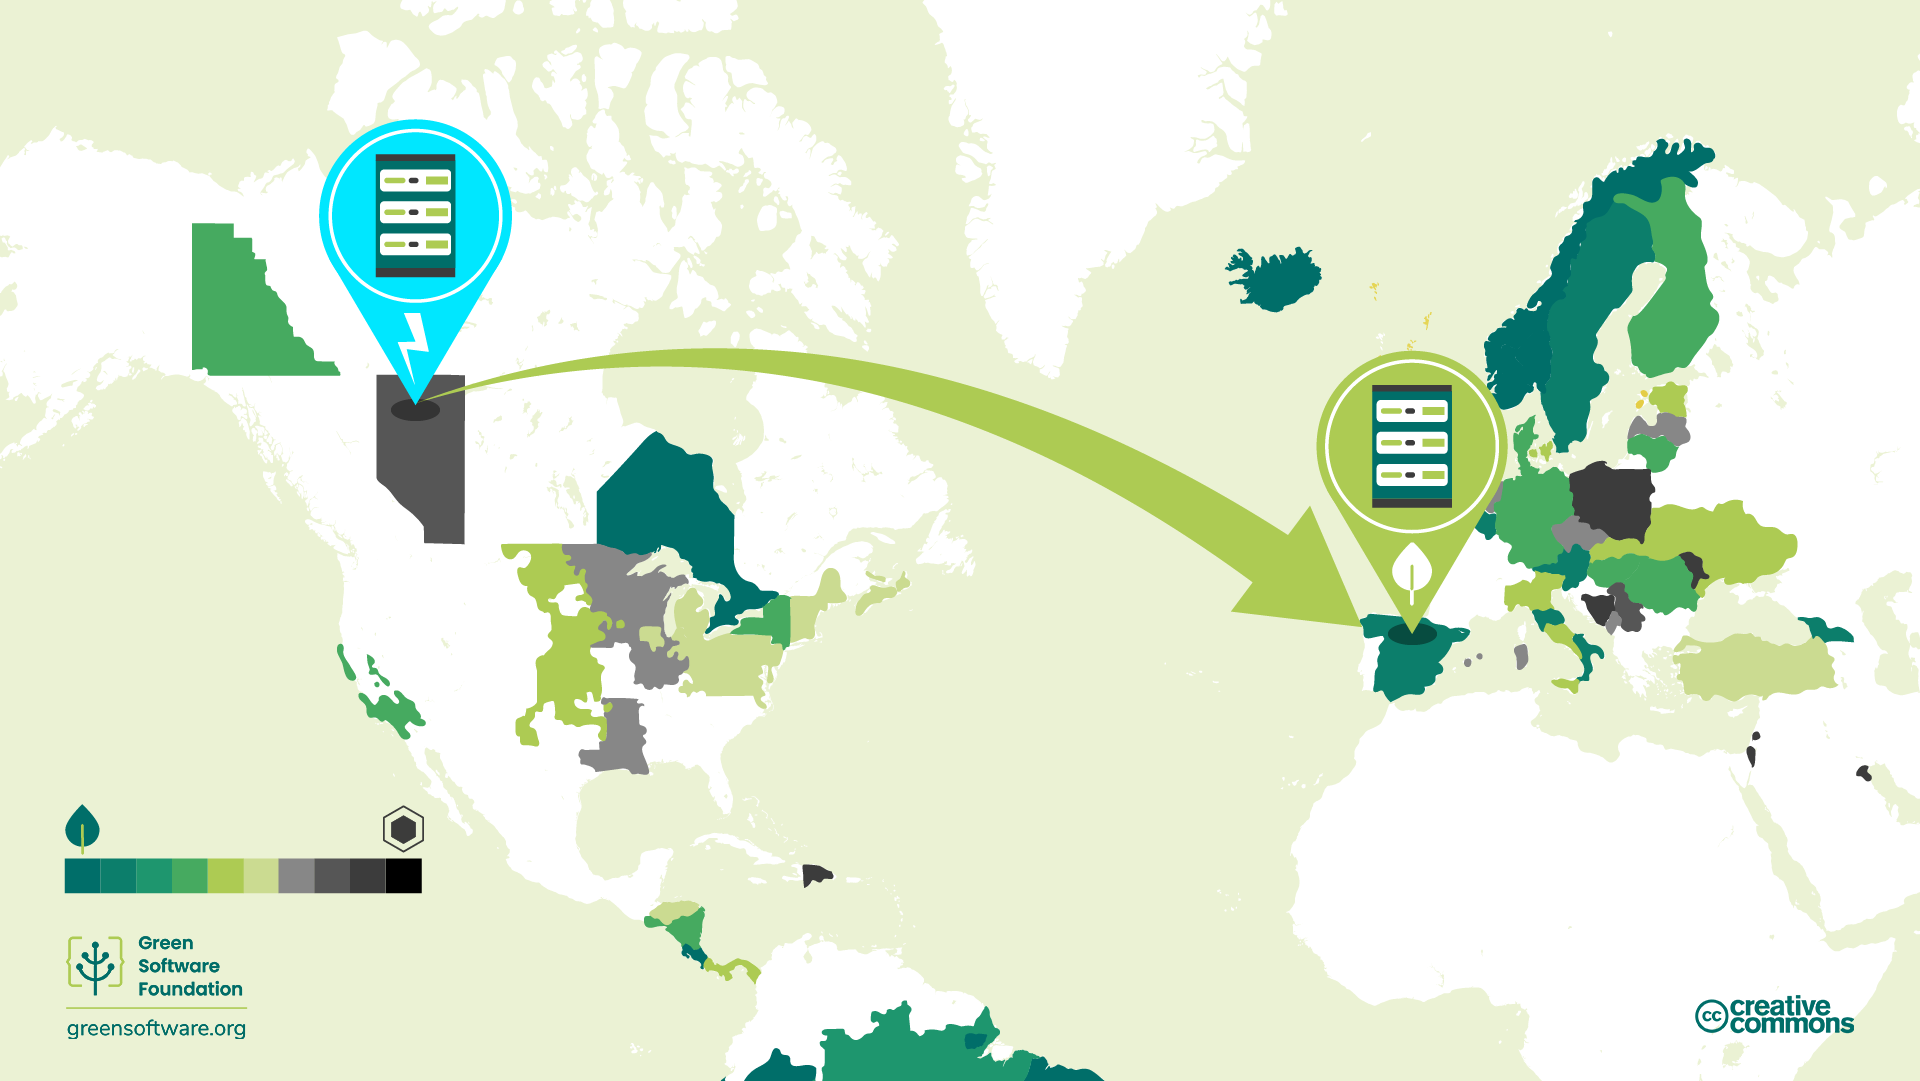
This requires you to have the ability to run on different HPC resources in different locations - for example, you could chose between running on a local HPC resource or a national HPC resource located elsewhere.
Temporal shifting
If you cannot shift your computation spatially to another region, another option you have is to shift to another time. Perhaps later in the day or night when it’s sunnier or windier and, therefore, the carbon intensity is lower. This is called temporal demand shifting. We can predict future carbon intensity reasonably well through advances in weather forecasting.
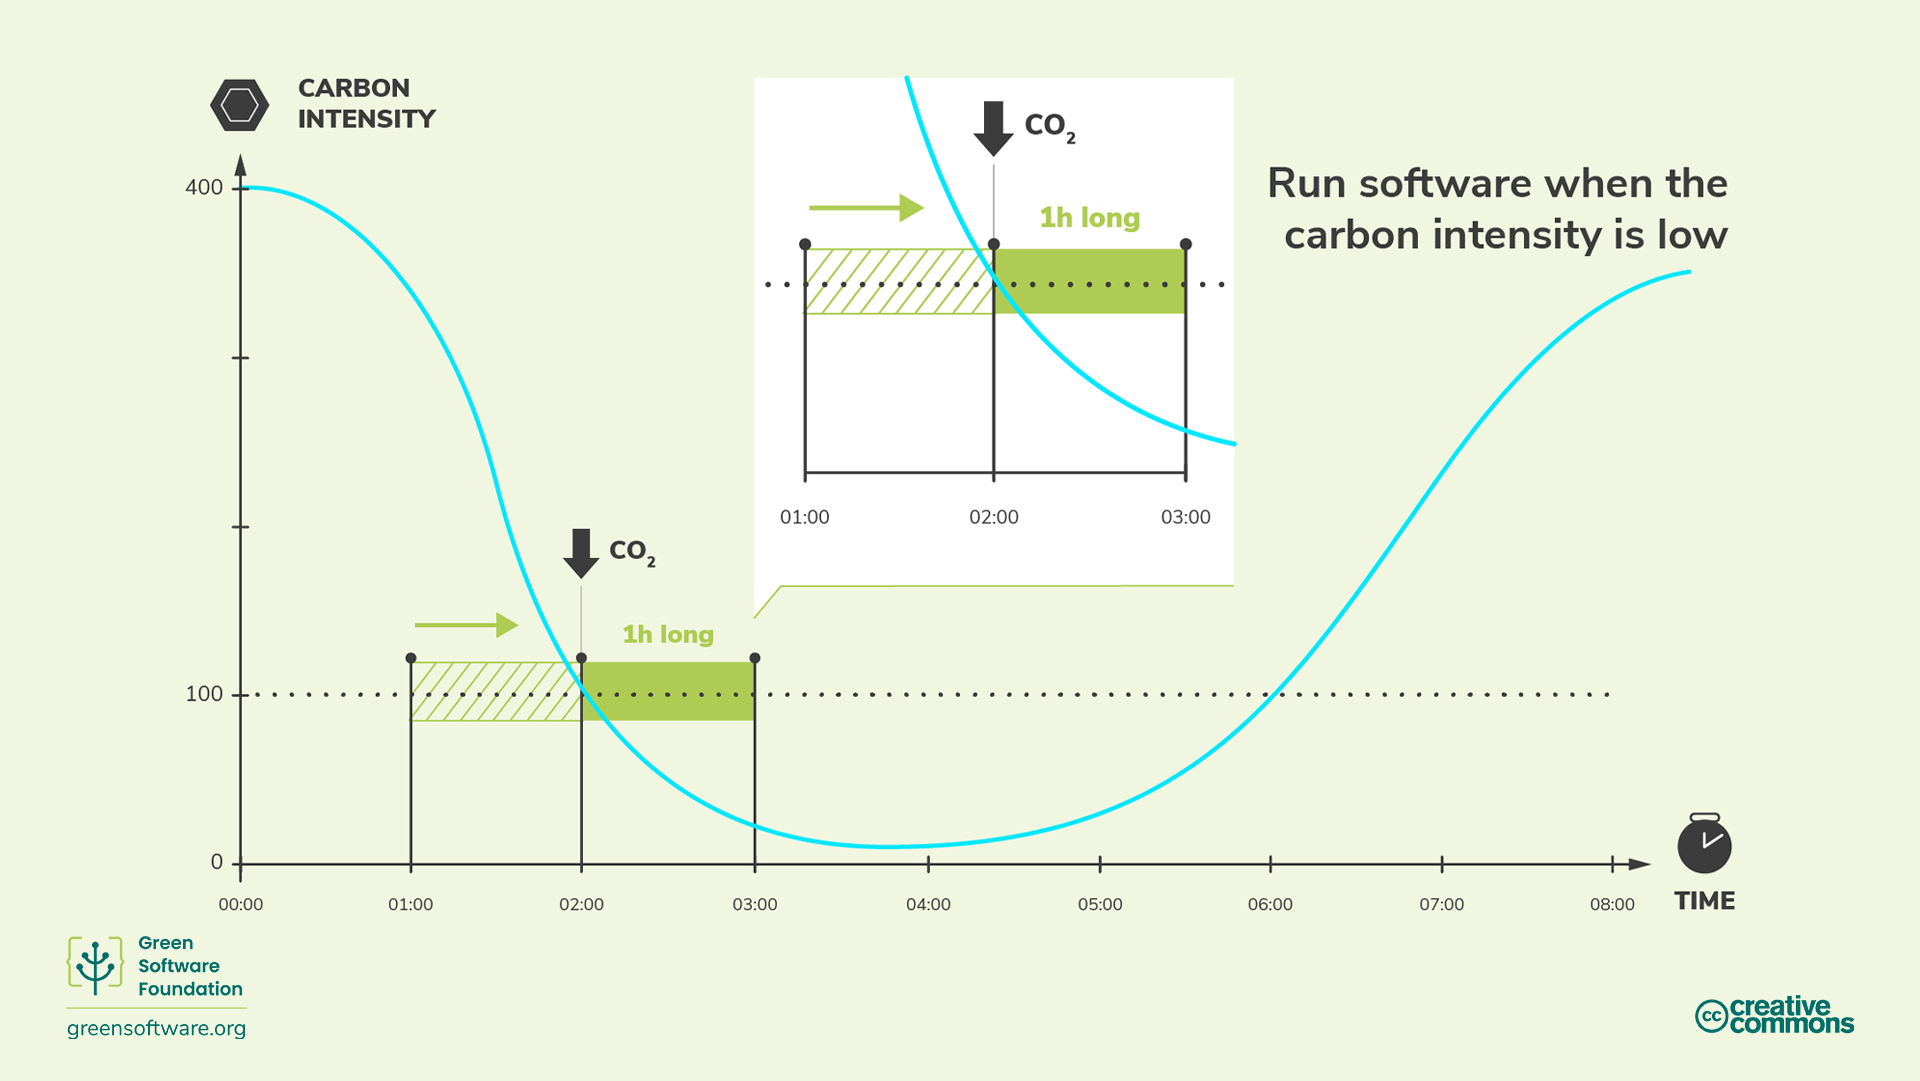
An example of a service that can predict carbon intensity to enable temporal demand shifting is the carbonintensity.org.uk website and API.
Some of the large technology companies have recognised the importance of carbon awareness and are using advanced modeling techniques to implement demand shifting.
- Google Carbon Aware Data Centers - Google launched a project to make some of the cloud workloads carbon aware. They created models to predict tomorrow’s carbon intensity and workload. They then shaped large-scale workloads so more would happen when and where the carbon intensity is lowest, but in such a way that they could still handle the expected load.
- Microsoft Carbon Aware Windows - Microsoft announced a project to make Windows 11 more sustainable. Initially, this means running Windows updates when the carbon intensity is lower.
To be able to take advantage of temporal shifting on HPC systems typically requires support for such approaches in the configuration of the job scheduling system and or policies of the service you are using. While this is not widespread at the moment, more and more services are looking at ways to enable this. We will think about and mention concrete actions and approaches to this below.
Demand shaping
Demand shifting (as described above) is the strategy of moving computation to regions or times when the carbon intensity is lowest. Demand shaping is a similar strategy. However, instead of moving demand to a different region or time, we shape our computation to match the existing supply.
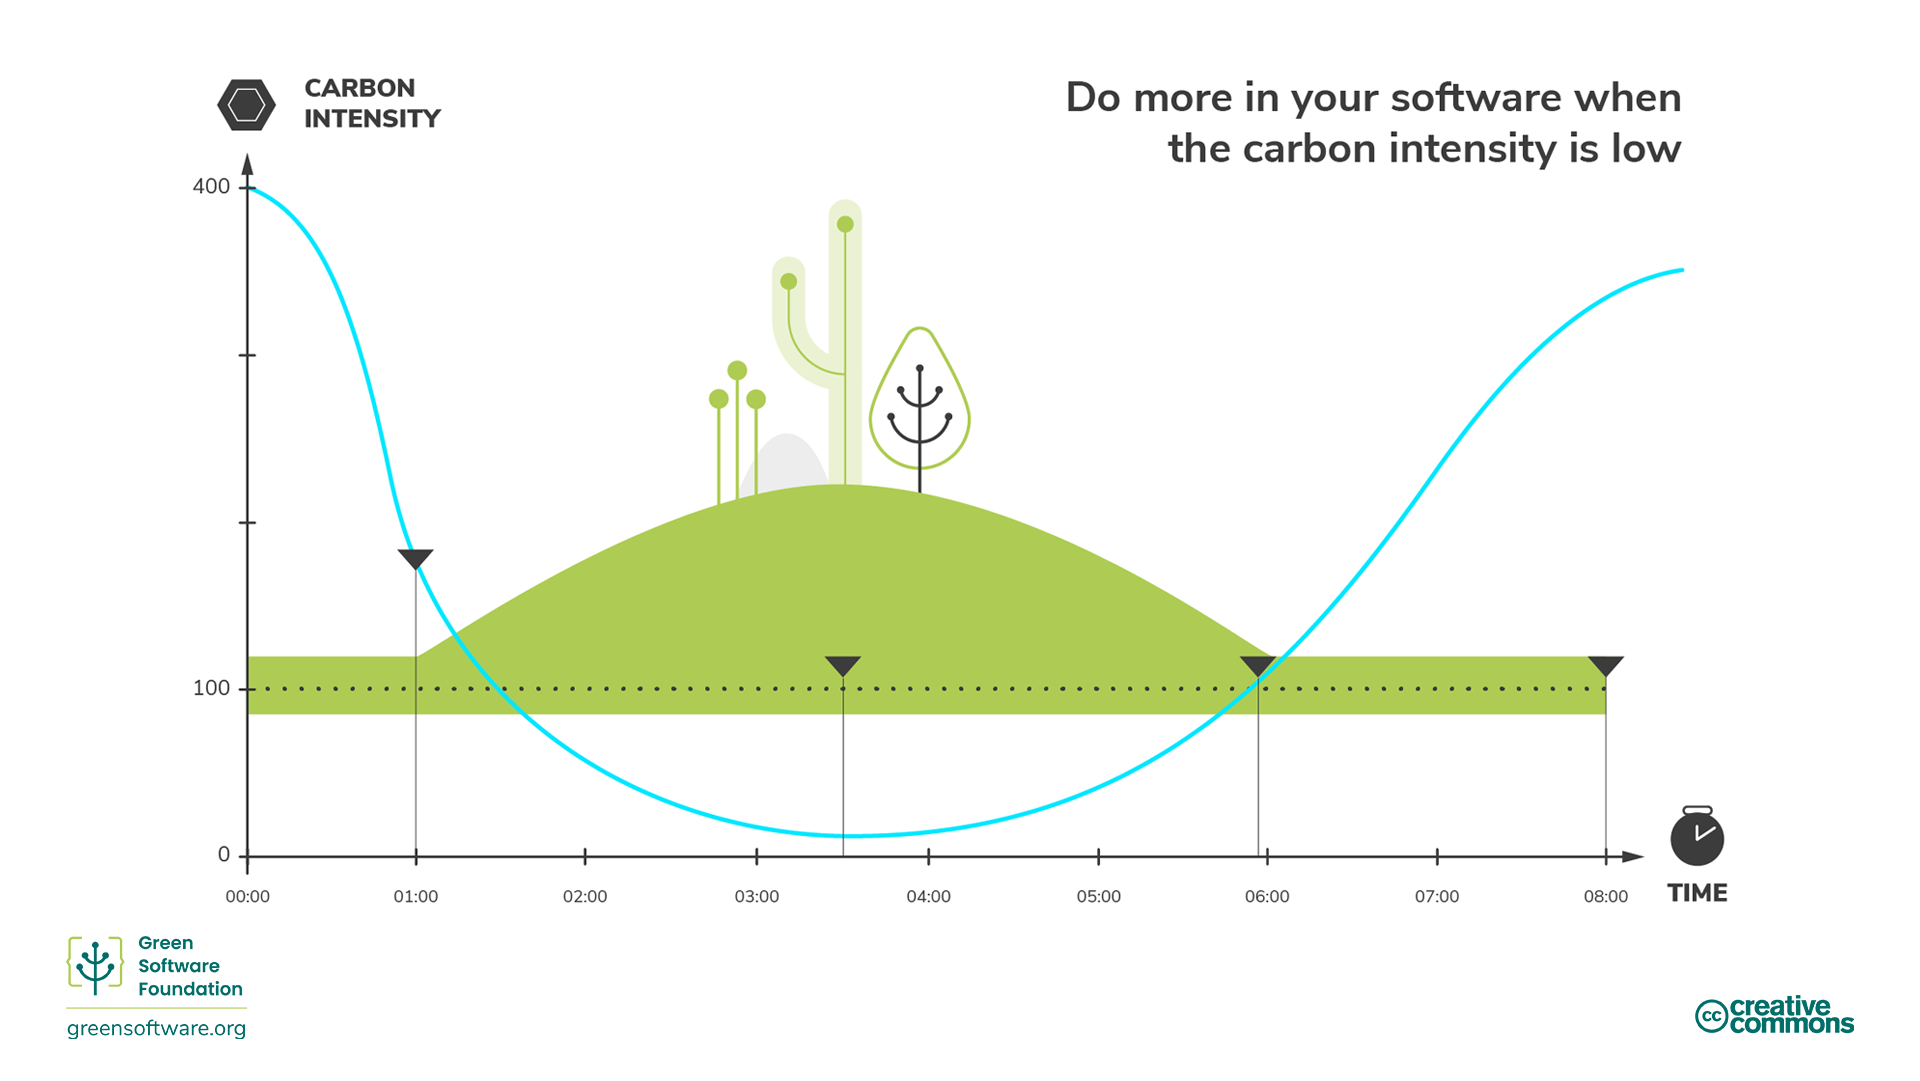
- If carbon intensity is low, increase the demand; do more (or faster) calculations.
- If carbon intensity is high, decrease demand; do fewer (or slower) calculations.
Demand shaping for carbon-aware HPC use is all about the supply of carbon. When the carbon cost of running your simulation or model becomes high, shape the demand to match the supply of carbon. This can happen automatically, or the user can make a choice.
Eco mode is an example of demand shaping. Eco modes are found in everyday appliances like cars or washing machines. When activated, some amount of performance is sacrificed in order to consume fewer resources (gas or electricity). Because there is this trade-off with performance, eco modes are always presented to a user as a choice.
Software or HPC services can also have eco modes that can - either automatically or with user consent - make decisions to reduce carbon emissions.
One example of this is video conferencing software that adjusts streaming quality automatically. Rather than streaming at the highest quality possible at all times, it reduces the video quality to prioritise audio when the bandwidth is low.
Another example is TCP/IP: the transfer speed increases in response to how much data is broadcast over the wire.
A third example is progressive enhancement with the web. The web experience improves depending on the resources and bandwidth available on the end user’s device.
Demand shaping is related to a broader concept in sustainability, which is to reduce consumption. We can achieve a lot by becoming more efficient with resources, but we also need to consume less at some point.
As green users of HPC systems, we could consider cancelling or reducing the power intensity of our workflow when the carbon intensity is high instead of demand shifting - reducing the energy demands of our work.
Exercise: Demand shaping and temporal shifting in HPC
A typical HPC system has a wide variety of jobs to schedule and different HPC systems have different scheduling and charging policies for jobs that run on them. Write down some ideas on how you could potentially modify the scheduling and charging of jobs to enable demand shaping and/or temporal shifting on an HPC system?
- Scheduling based on power intensity
- Manual: users place jobs into different queues based on predicted power intensity; charging discounts for users who use this facility
- Automatic: system detects/predicts power intensity of jobs and schedules accordingly
- Credit based system:
- Earning and spending periods: during earning period, users start with a number of tokens and subtract based on efficiency (to stop more tokens for more use). During spend period, users with most efficiency from earning period get priority on system
- This type of approach has been piloted on the Fugaku HPC system in Japan
- Power capping approaches:
- System power cap fluctuates with grid carbon intensity
- Need a tool to distribute power cap amongst jobs
- For example HPE’s PowerSched tool
- Carbon awareness means understanding that the energy you consume does not always have the same impact in terms of carbon intensity.
- Carbon intensity varies depending on the time and place it is consumed.
- The nature of fossil fuels and renewable energy sources means that consuming energy when carbon intensity is low increases the demand for renewable energy sources and increases the percentage of renewable energy in the supply.
- Demand shifting means moving your energy consumption to different locations or times of days where the carbon intensity is lower.
- Demand shaping means adapting your energy consumption around carbon intensity variability in order to consume more in periods of low intensity and less in periods of high intensity.
Content from Hardware Efficiency
Last updated on 2025-09-16 | Edit this page
Overview
Questions
- What is embodied carbon on HPC systems?
- How can embodied carbon efficiency be improved on HPC systems?
- What can I do to improve the embodied carbon efficiency during my use of HPC systems?
Objectives
- Understand what is meant by “embodied carbon” in the context of HPC systems.
- Learn how embodied carbon efficiency can be bettered by extending the lifespan of HPC systems and improving performance of applications on HPC systems.
Introduction
The hardware that makes up the HPC systems you are using is an important element to consider when looking to be a greener user of HPC. Indeed, for HPC systems located where carbon intensity of electricity generation is low, the hardware may be the dominant component of emissions associated with HPC system use.
You will see how embodied carbon is a hidden cost when it comes to hardware and the different measures you can take to reduce the impact that the creation, destruction, and running of this hardware involves. More specifically, extending hardware lifetime and improving the efficiency of your hardware use are the main ways of reducing this impact.
Key concepts
Embodied carbon
The manufacturing of the device you are using to participate in this workshop produced carbon and disposing of it at the end of its life may release more. Embodied (or embedded) carbon is the amount of carbon emissions due to the creation and disposal of a device.
When calculating the total carbon emissions for HPC services, both the carbon emissions associated with running the system as well as the embodied carbon of the system must be accounted for.
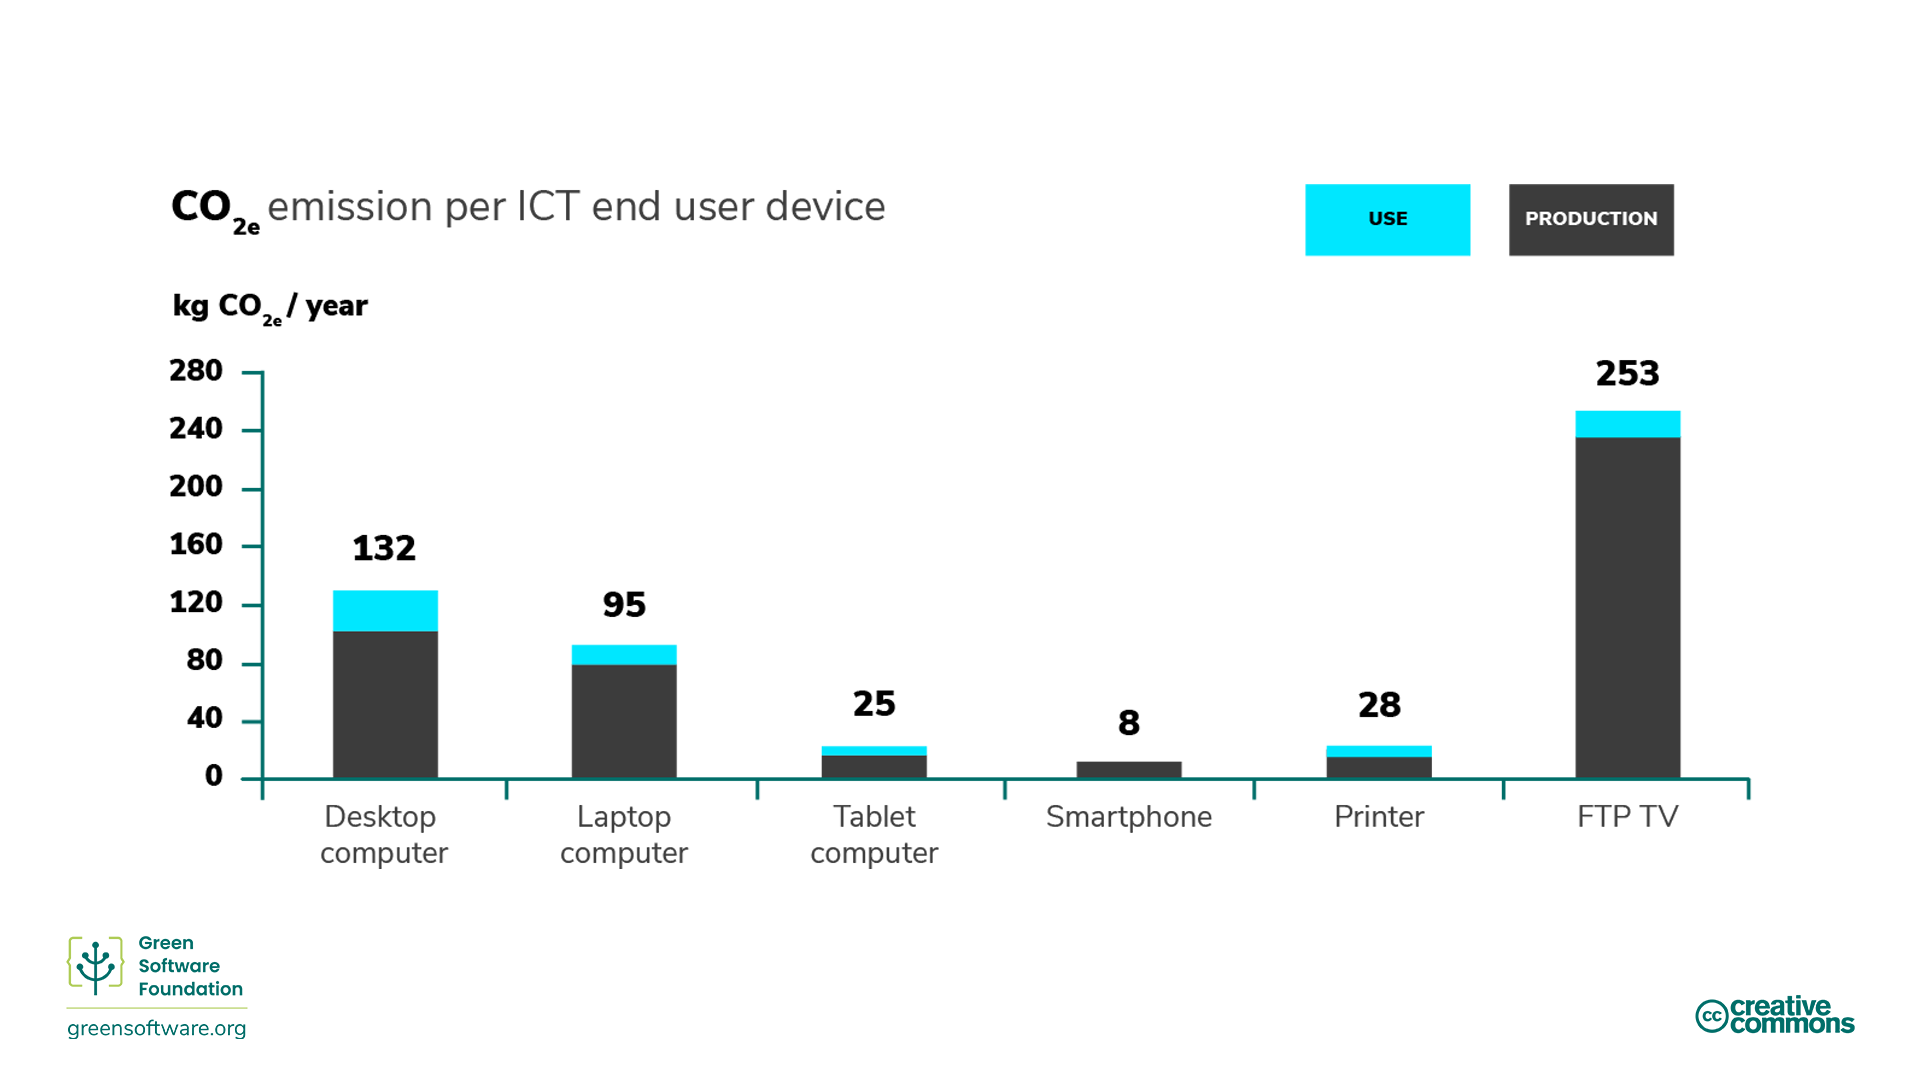
Embodied carbon varies significantly between different hardware. For some devices, the carbon emitted during manufacturing is much higher than that emitted during usage, as illustrated by a study from University of Zurich. As a result, the embodied carbon cost can sometimes be much higher than the carbon cost of the electricity powering it.
By thinking in terms of embodied carbon, any device, even one not consuming electricity, is responsible for the release of carbon over its lifetime.
Amortisation
A way to account for embodied carbon is to amortise the carbon over the expected lifespan of a device. For example, suppose it took 4000 kgCO2e to build an HPC system, and we expect it to last four years. Amortisation means that we can say the HPC system emits 1000 kgCO2e/year in embodied carbon alone.
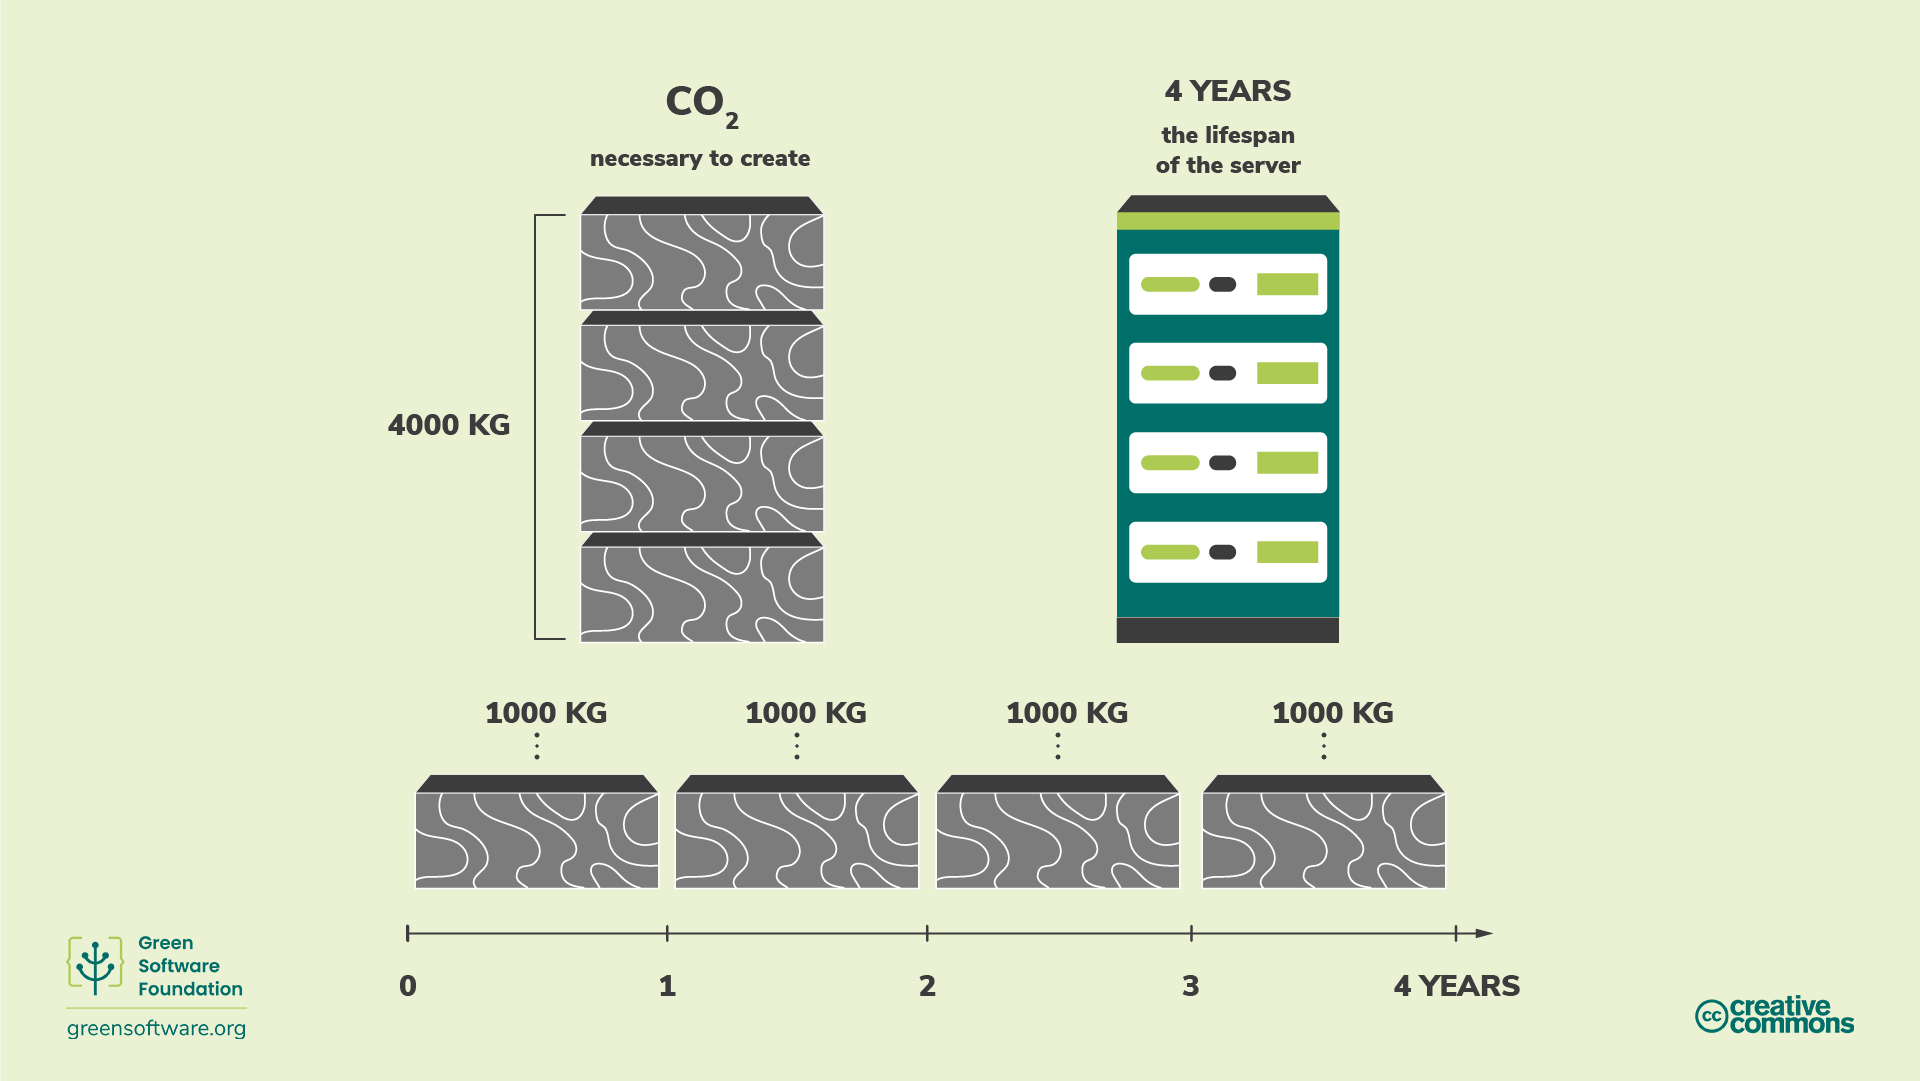
Rather than years, we typically amortise the embodied emissions over the total amount of resource available on the HPC system over its lifetime. For example, if the resource use of an HPC system is measured in GPUh then we would amortise the embodied emissions over the total GPUh available on the service over its whole lifetime (to give an emissions rate in kgCO2e/GPUh).
How to improve hardware efficiency
By taking into account the embodied carbon, it is clear that by the time we come to install an HPC system, it has already emitted a large amount of carbon. Computers also have a limited lifespan, which means they are eventually unable to handle modern workloads, or they suffer failures and need to be replaced. In these terms, hardware consumption is a proxy for carbon, and since our goal is to be carbon efficient, we must also be hardware efficient.
There are two main approaches to improving hardware carbon efficiency:
- Extending the lifespan of the hardware - which reduces the carbon emission rate per unit of resource due to amortisation.
- Increasing the utilisation and performance of the hardware - getting more useful work out of the hardware per unit of resource.
Extending the lifespan of hardware
In the example we saw previously, if we can add just one more year to the lifespan of our HPC system, then the amortised carbon emissions rate drops from 1000 kgCO2e/year to 800 kgCO2e/year.
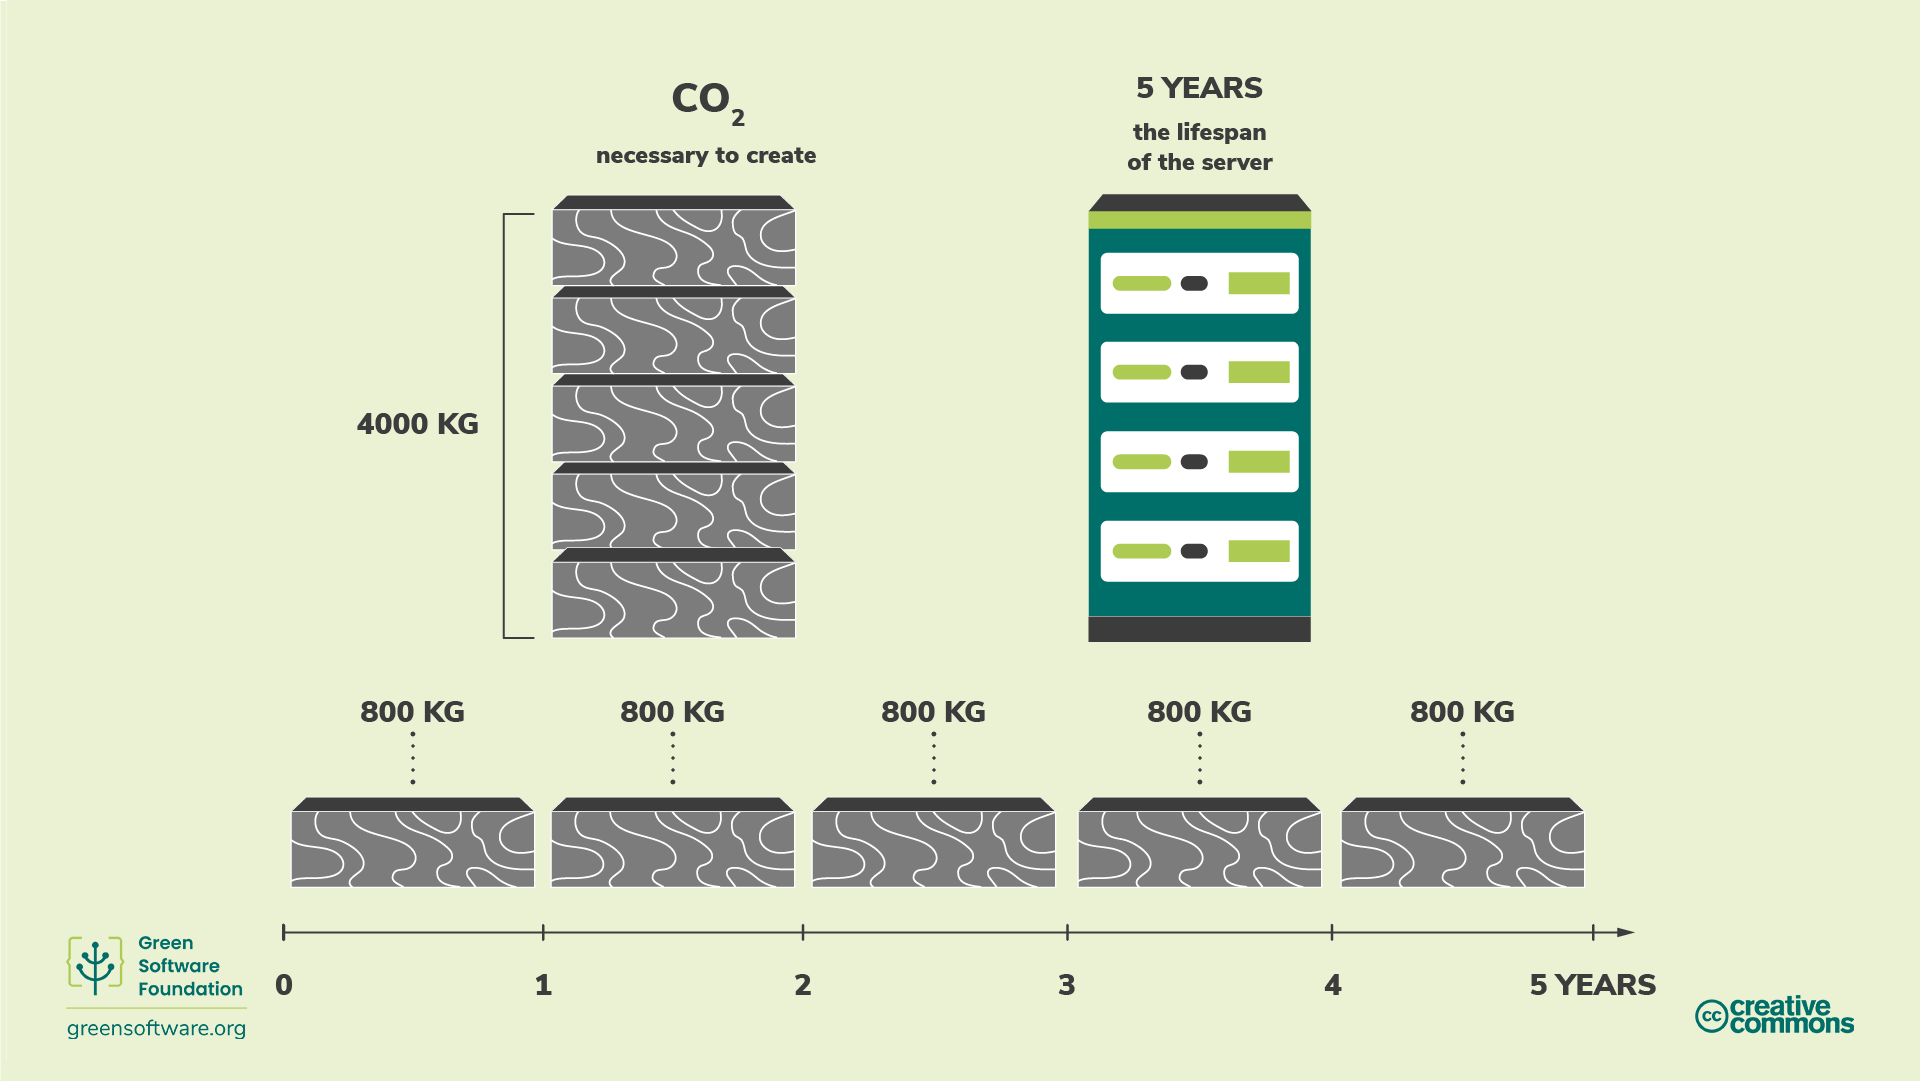
HPC systems have historically had lifetimes of around 5-7 years at which point they are replaced by newer systems that provide improved performance and functionality and that are typically more energy efficient. However, extending the lifetime of HPC systems may lead to improved carbon efficiency through the amortisation of embodied carbon, and using older HPC systems for our research may actually lead to a more carbon efficient use of HPC.
Increasing utilisation and performance
As well as increasing the lifespan to improve the embodied carbon efficiency, we can also work to make sure we get the most out of the HPC hardware during its lifetime.
At a service/system level this often corresponds to maximising the usage of the service - it’s better to have 100% utilisation than 20% utilisation because of the cost of embodied carbon (and also because of the fact that even idle components in HPC systems consume some electricity).
For individual users and groups, improving the carbon efficiency with respect to embodied carbon typically corresponds to increasing the performance of their use of the HPC system so they get more output per unit of time. Of course, increasing the performance of your use may lead to higher power draw and higher electricity use which increases the emissions from the use of electricity. This means that you need to know what the balance between embodied emissions and emissions from electricity use are for the HPC system you are using to make useful choices about improving your carbon efficiency. There are three potential scenarios to maximise carbon efficiency:
- Embodied carbon dominates - run as high performance as possible irrespective of electricity use
- Embodied carbon and carbon from electricity use are evenly balanced - you need to find a balance of performance and energy efficiency
- Carbon from electricity use dominates - run in as energy efficient a manner as possible
We will look at a specific example of this balance in a later episode of this workshop.
Carbon efficiency can be complex - flexibility is key
Understanding the most carbon efficient way to make use of HPC systems (and the most carbon efficient way to operate them, including choosing their lifetime) can be complex as it depends on many factors. These can include the embodied carbon of the hardware, the lifetime of the system, the carbon intensity of the electricity supply and how that changes over the service lifetime, and the efficiency of the workload you are running on the type of hardware provided by the system. However, one key aspect of being able to use HPC in a carbon efficient way is for your workflow to have the flexibility to run on different system types efficiently.
- Embodied carbon of an HPC system is the amount of carbon pollution emitted during the creation and disposal of the HPC system.
- When calculating your total carbon pollution, you must consider both that which is emitted when running on the HPC system as well as the embodied carbon associated with its creation and disposal.
- Extending the lifetime of an HPC system has the effect of amortising the carbon emitted so that its embodied CO2e/year is reduced.
- Increasing utilisation and performance also improve the embodied carbon efficiency from HPC system use.
Content from Measurement
Last updated on 2025-09-16 | Edit this page
Overview
Questions
- How are emissions measured and classified under the GHG protocol?
- How do I use the GHG protocol to estimate emissions from my use of HPC?
Objectives
- Understand how emissions are classified in the widely-used GHG protocol.
- Know which GHG protocol classifications are relevant to use of HPC systems.
- Learn a methodology to use GHG protocol to estimate the emissions associated with our use of HPC systems.
- Understand how emission rates from HPC can be calculated.
Introduction
The Greenhouse Gas (GHG) protocol is the most commonly-used method for organisations to measure their total carbon emissions. Understanding GHG scopes and how to measure your software against industry standards will help you see to what extent you are reducing carbon emissions and how that fits with wider activities to reduce emissions.
To complement the GHG protocol, and if you develop software that is used by others, you can also use the Software Carbon Intensity (SCI) specification. While the GHG is a more generic measurement suitable for all types of organisations, the SCI is specifically for measuring a rate of software emissions and designed to incentivise the elimination of those emissions.
The GHG protocol
The Greenhouse Gas protocol is the most widely used and internationally recognized greenhouse gas accounting standard. 92% of Fortune 500 companies use the GHG protocol when calculating and disclosing their carbon emissions and it provides the basis of emissions reporting for most countries (including the UK). Using the GHG protocol allows us to compare our emissions from use of HPC systems to other sources of emissions in a quantitative way.
The GHG protocol divides emissions into three scopes:
- Scope 1: Direct emissions from operations owned or controlled by the reporting organisation, such as on-site fuel combustion or fleet vehicles.
- Scope 2: Indirect emissions related to emission generation of purchased energy, such as heat and electricity.
-
Scope 3: Other indirect emissions from all the
other activities you are engaged in. Scope 3 emissions are typically
split into two further categories: upstream emissions and
downstream emissions:
- Upstream scope 3 emissions: Includes all emissions from an organisation’s supply chain, e.g. emissions from manufacturing and shipping a product
- Downstream scope 3 emissions: Emissions resulting from the use of a product, e.g. the electricity customers may consume when using your product or waste output from the product
Scope 3, sometimes referred to as value chain emissions, is often the most significant source of emissions and the most complex to calculate for many organisations. These encompass the full range of activities needed to create a product or service, from conception to distribution. In the case of a laptop, for example, every raw material used in its production emits carbon when being extracted and processed (part of the upstream scope 3 emissions). Value chain emissions also include emissions from the use of the laptop, meaning the emissions from the energy used to power the laptop after it has been sold to a customer (part of downstream scope 3 emissions).
Through this approach, it’s theoretically possible to sum up all the GHG emissions from every organisation and person in the world and reach a global total.
What scope does my application fall into?
We have already seen how the GHG protocol asks us to bucket emissions from HPC system use according to scopes 1-3. But how do we actually do this?
Exercise: What scope for HPC emissions?
Throughout this lesson we have spoken about emissions from two different sources associated with our use of HPC: emissions from the electricity used to run our models/simulations on HPC systems and embodied emissions from the HPC system hardware. Given the definitions of scope 1-3 emissions given above, which scopes do you think these two different sources of HPC system use emissions fall into?
- Emissions from electricity used: these would be classified as scope 2 emissions
- Embodied emissions from HPC system hardware: these would be classified as upstream scope 3 emissions
HPC electricity: Scope 2 or Downstream Scope 3?
Whether the emissions from electricity use on HPC systems are downstream scope 3 or scope 2 really depends on who is computing the emissions and for what purpose. From the viewpoint of the hardware vendor who sells and manufactures the HPC system, the electricity use falls into downstream scope 3 emissions but for operators and users of the HPC system they would classified as scope 2 emissions. As we are approaching this subject as buyers, operators and users of HPC systems we will always classify the emissions from our electricity use on HPC systems as scope 2.
How to calculate your HPC emissions
Quantifying the emissions from your work (and generating an emissions
rate, as described below) are critical steps on the path to reducing and
potentially eliminating emissions from your use of HPC systems. The
formula for calculating your emissions from use of HPC systems
(HPC-E) is straightforward:
HPC-E = (E * CI) + M-
E= Energy consumed by HPC use (in kWh) -
CI= Location-based carbon intensity (in kgCO2e/kWh) -
M= Embodied emissions (in kgCO2e)
You can calculate this on a per job basis or for a larger grouping of HPC use - even for a full lifetime of an HPC service.
Include failed jobs and jobs that did not produce useful output
While it can be tempting to only include the use of HPC that produced useful output in our emissions calculations, this should be avoided. The true amount of emissions includes all of our HPC system use to get us to the results we use and so failed jobs (due to errors) or calculations that did not produce useful output must be included. On the positive side, one of the ways we can reduce our emissions from use of HPC systems is to be more careful and eliminate emissions arising from these types of non-productive jobs.
Instead of bucketing the carbon emissions of HPC use into scopes 1-3,
this calculation buckets them into operational
emissions (carbon emissions from the electricity required for
your HPC use, represented by E * CI) and embodied
emissions (carbon emissions from the physical HPC system
components, represented by M).
Follow these steps to calculate your HPC emissions.
- Gather your energy use - this can be measured or estimated and is often a combination of measured and estimated data
- Determine the carbon intensity at the location of the HPC system you are using
- Determine the embodied emissions associated with your use of HPC
- Compute your total HPC emissions
1. Gather energy use
Many HPC systems now provide energy use data for jobs run on the system. If this is the case, you can use these as the starting point for calculating your energy use of HPC resources. If this is not available, then you may need to estimate the energy use of your use of resources from component power draw. Even if you have energy use data available this may only cover energy use of compute nodes (or even processors on compute nodes) so you do typically have to do some estimation of power draw of other components to know how much extra energy to add on to include them in your calculation.
If you are really lucky, the HPC system staff will have done this calculation for you. This has been done for the UK National Supercomputing Service, ARCHER2: Estimating emissions from ARCHER2.
We will cover two different ways to estimate the power draw of HPC systems which can then be used to compute energy use.
- Use the total power draw of the system
- Use the per-component power draw of the system
Heterogeneous systems
The methodologies outlined below all assume the compute nodes are homogeneous. What do you do if this is not the case and some nodes on the system have GPUs and others do not, for example? In this case, you should try, as much as possible, to treat each homogeneous partition as its own smaller HPC system to help calculate energy use.
a. Using total power draw
One of the simplest ways to estimate your energy use is to use the
total power draw of the HPC system and divide it by the number of
components to get a mean power draw per component that can be used to
estimate energy use. For example, if the total power draw of the system
is 250 kW and it contains 512 GPUs, then the mean power draw per GPU is
250 kW / 512 GPU = 0.488 kW/GPU. This, in turn, means the
energy used for 12 hours use of 2 GPUs is estimated by
12 hours * 2 GPU * 0.488 kW/GPU = 11.7 kWh.
You should use the component that you measure resource use in to compute the mean power draw. For example, if your usage is measured in GPUh, then compute the power draw per GPU; if your usage is measured in nodeh, compute the power draw per node.
b. Using per-component power draws
This approach requires more detailed information being available on the power draw of different components through measurement or from information from the vendors of the components. If you are getting your energy use from counters on the compute nodes (as is sometimes possible on HPC systems) then this approach allows you to estimate additional energy overheads that need to be added on in addition to the measured power draw.
We illustrate this approach using the estimates for the ARCHER2 HPC system:
| Component | Count | Loaded power draw per unit (kW) | Loaded power draw (kW) | % Total | Notes |
|---|---|---|---|---|---|
| Compute nodes | 5,860 nodes | 0.41 | 2,400 | 85% | Measured by on system counters |
| Interconnect switches | 768 switches | 0.24 | 240 | 9% | Measured by on system counters |
| Lustre storage | 5 file systems | 8 | 40 | 1% | Estimate from vendor |
| NFS storage | 4 file systems | 8 | 32 | 1% | Estimate from vendor |
| Coolant distribution units | 6 CDU | 16 | 96 | 3% | Estimate from vendor |
| Total | 2,808 | 99% |
In this case, we have a mix of data measured on the system (power
draw of the compute nodes and power draw of the interconnect switches)
and estimates from the vendor (storage systems and CDU). Here, the total
power draw is estimated at 2,808 kW, there are 5,860 compute nodes and
the unit of resource is nodeh so we can calculate the mean per node
power draw (including all the components in the table) in the same way
as we did for method (a) with
2,808 kW / 5,860 nodes = 0.480 kW/node and use this to
compute energy consumption based on how many nodeh we use.
However, on ARCHER2 we also have the total compute node energy use available per job to users from the Slurm scheduler. The table above shows that the compute nodes contribute around 85% of the total power draw of ARCHER2 (of the components included) so an alternative method to compute the energy use is to use the measurement from the scheduler and add an additional 15% to cover the energy used by other components. This is, in fact, the methodology used for computing per job energy use on ARCHER2.
Add in energy from plant overheads
As well as the energy used by the system itself, there is also the energy used by the plant that supplies power and cooling to the HPC system. Different data centres have different sizes of overheads and this is given by PUE (power use efficiency) which we met earlier in an earlier episode. For example, a PUE of 1.25 indicates that an additional 25% energy use is added on top of the system energy use to account for the plant.
The PUE will vary with outside weather conditions at the data centre. For the ARCHER2 example, PUE is typically less than 10% so, as a conservative estimate, they add an additional 10% energy use to the total to account for plant overheads.
So, for the ARCHER2 example, the process for computing your total energy use becomes:
- Measure total compute node energy use from all jobs run via node counters
- Add 15% extra energy to cover energy use from other components
- Add another 10% energy use on top of this new total to cover plant overheads
2. Determine local carbon intensity
Once you have your energy use then you need to convert this to emissions using the carbon intensity for the electricity supply for the HPC system. In most cases, HPC systems are powered by the energy grid and many energy grids provide details on the carbon intensity as a function of time.
As we saw earlier, for the UK, the carbon intensity is dependent on location and time. You can access the values through different web services but one that is commonly used is the Carbon Intensity API. Carbon intensity is reported for every region every 30 minute interval. To estimate your emissions you can either use the fine-grained intensity matched to the run times of your HPC system use or use an aggregate value over a longer period. The aggregate value is a simpler choice for a first estimate. The table below shows the approximate average carbon intensities for the different regions of the UK national grid for 2024 ordered from lowest to highest.
| Type | Regions | Carbon Intensity (gCO2e/kWh) |
|---|---|---|
| Low | N. Scotland, S. Scotland, N.E. England, N.W. England | 22 - 48 |
| Low Medium | N. Wales | 77 |
| Medium | E. England, London, W. Midlands, S.E. England, Yorkshire | 108 - 135 |
| High Medium | S. England, E. Midlands | 186 - 203 |
| High | S.W. England, S. Wales, | 242 - 255 |
3. Determine embodied emissions
Upstream Scope 3 emissions
Remember that we are considering only upstream scope 3 emissions here. The emissions from electricity use are captured in the scope 2 emissions estimates.
Calculating the embodied emissions can be more difficult than the operational emissions from energy consumption as it can be more difficult to get information on embodied emissions associated with HPC system hardware. You may, of course, be lucky and the HPC system you are using could already provide estimates of the embodied emissions which you can use!
If you need to estimate this yourself, the major contributors to embodied emissions are likely to be:
- Compute nodes
- Interconnect switches
- Storage
so these are the best place to start. Bear in mind that each HPC system is different so other components may need to be taken into account. As a rule of thumb, you should look at the HPC system to see which components there are lots of and use that as the starting place. Complex components (such as nodes, storage and switches) are likely to have much higher embodied emissions than simpler components (pumps, fans, cables etc.).
As an example, here is how the embodied emissions for ARCHER2 have been estimated:
| Component | Count | Estimated kgCO2e per unit | Estimated kgCO2e | % Total Scope 3 | References |
|---|---|---|---|---|---|
| Compute nodes | 5,860 nodes | 1,100 | 6,400,000 | 84% | (1) |
| Interconnect switches | 768 switches | 280 | 150,000 | 2% | (2) |
| Lustre HDD | 19,759,200 GB | 0.02 | 400,000 | 6% | (3) |
| Lustre SSD | 1,900,800 GB | 0.16 | 300,000 | 4% | (3) |
| NFS HDD | 3,240,000 GB | 0.02 | 70,000 | 1% | (3) |
| Total | 7,320,000 | 100% |
References:
- IRISCAST Final Report
- Estimate taken from IBM z16(TM) multi frame 24-port Ethernet Switch Product Carbon Footprint
- Tannu and Nair, 2023
Note that there is a large amount of uncertainty for scope 3 emissions due to lack of high quality embodied emissions data. The number used for the compute node emissions is at the high end of estimated values for a CPU-only compute node and the actual value could be as much as 15% lower at around 900 kgCO2e/node. If the lower value is used, it reduces the overall estimated embodied emissions but does not significantly change the fraction of emissions attributed to the compute nodes.
Other embodied emissions sources
We have not included embodied emissions associated with the data centre buildings and plant in the analysis above. The IRISCAST report provides an evaluation of these values. While the total embodied emissions can be high for these items, their long lifespan means that their contribution to the embodied emissions during the lifespan of a particular HPC system are generally much less significant than the embodied emissions from the HPC system hardware itself.
4. Compute your total HPC emissions
Now we should have all the data we need to compute our total emissions from HPC system use:
-
E= Energy consumed by HPC use (in kWh) -
CI= Location-based carbon intensity (in kgCO2e/kWh) -
M= Embodied emissions (in kgCO2e)
Remember the equation for computing total emissions from HPC system
use (HPC-E):
HPC-E = (E * CI) + Mwe can plug the numbers in and come up with a value for the total emissions arising from our use of HPC.
E * CI on a per job basis
Rather than computing total energy use and then using an aggregate
value for the carbon intensity, it may make more sense to compute
E * CI on a per-job basis using the carbon intensity value
at the job time. This is the approach used in the tools available on
ARCHER2 for estimating emissions.
Exercise: Computing total emissions from HPC system use
You are using (or running) a GPU-based HPC service and a particular project has used the following amounts of resource over 3 months
- 1,100 GPUh
- 3,542,000 kWh
The total embodied emissions for the service are 6,500,000 kgCO2e, the service lifetime is 7 years and there are 1000 compute nodes each with 8 GPUs. The service is hosted in a location with a carbon intensity of 40 gCO2e/kWh.
- Compute the scope 2 emissions for the project use
- Compute the scope 3 emissions rate in kgCO2e/GPUh
- Compute the scope 3 emissions for the project use
- Compute the total emissions for the project use
- Do scope 2 or scope 3 emissions dominate or are they evenly matched?
The scope 2 emissions from energy use by the project are given by
E * CI, the energy used multiplied by the carbon intensity of the electricity supply. In this case, this is given by3,542,000 kWh x 0.040 kgCO<sub>2</sub>e/kWh = 141,700 kgCO<sub>2</sub>e.-
The scope 3 emissions rate per GPUh is the total scope 3 emissions for the service divided by number of GPUh available over the lifetime of the service.
- The total GPUh over the service lifetime is estimated by
7 years x 365 days x 24 hours x 1000 nodes x 8 GPU per node = 490,560,000 GPUh. - The scope 3 emissions rate is given by
6,500,000 kgCO<sub>2</sub>e / 490,560,000 GPUh = 0.013 kgCO<sub>2</sub>e/GPUh
- The total GPUh over the service lifetime is estimated by
The scope 3 emissions for the project use is the number of GPUh used multiplied by the scope 3 emissions per GPUh:
1,100 GPUh * 0.013 kgCO<sub>2</sub>e/GPUh = 14.3 kgCO<sub>2</sub>eTotal emissions are scope 2 + scope 3 emissions:
141,700 kgCO<sub>2</sub>e + 14.3 kgCO<sub>2</sub>e = 141,714 kgCO<sub>2</sub>eScope 2 emissions (from electricity use) heavily dominate the emissions in this example.
HPC Carbon Intensity (HPC-CI) specification
Software Carbon Intensity (SCI)
The definition, application and calculation of the HPC-CI is heavily inspired by the Software Carbon Intensity (SCI) from the Green Software Foundation.
We now describe a methodology (the HPC Carbon Intensity specification, HPC-CI) to calculate your emissions from HPC system use and to encourage action towards eliminating emissions.
It is not a replacement for the GHG protocol, but an additional metric that helps you understand how your HPC system use can be measured in terms of carbon emissions so you can make more informed decisions. While the GHG protocol (or HPC-E) calculates the total emissions, the HPC-CI is about calculating the rate of emissions. In automotive terms, HPC-CI is more like a miles per gallon measurement and the GHG protocol/HPC-E is more like the total carbon footprint of a car manufacturer and all their cars they produce every year.
An important thing to note is that it is not possible to reduce your HPC-CI rate by purchasing offsets in the form of neutralisations, compensations, or by offsetting electricity in the form of renewable energy credits (we will cover this in more detail in the next section of the workshop). This means that HPC system use that makes no effort toward reducing emissions but spends money on carbon credits cannot reduce the associated HPC-CI rate.
Offsets are an essential component of any climate strategy; however, offsets are not eliminations and therefore are not included in the HPC-CI metric.
If you make your HPC use more energy efficient, hardware efficient, or carbon aware, your HPC-CI rate will decrease. The only way to reduce your rate is to invest time or resources into one of those three principles. As such, adopting the HPC-CI metric for your HPC use, will drive investment into one of the three pillars of green HPC use.
The HPC-CI equation
The equation to calculate an HPC-CI rate is simple and very closely related to the calculation of total emissions (HPC-E) presented above:
HPC-CI = [(E * CI) + M] per R-
E= Energy consumed by HPC use (in kWh) -
CI= Location-based carbon intensity (in kgCO2e/kWh) -
M= Embodied emissions (in kgCO2e) -
R= Functional unit (e.g. iterations, simulated time, calculation cycles, research papers published, cost)
This yields an emissions rate in carbon emissions per functional unit
(HPC-E per R), e.g. kgCO2e/iteration.
The steps to calculate your HPC-CI score are the same as calculating your total emissions (HPC-E) described above with additional steps to produce the rate. Steps 1-4 are identical to the HPC-E methodology described above:
- Gather your energy use
- Determine the carbon intensity at the location of the HPC system you are using
- Determine the embodied emissions associated with your use of HPC
- Compute your total HPC emissions
- Select your functional unit (
R) - Calculate your HPC-CI rate
5. Select your functional unit (R)
As we have seen, the HPC-CI is a rate rather than a total and measures the intensity of emissions according to the chosen functional unit. The specification currently does not prescribe the functional unit and you are free to pick whichever best describes the output from your use of HPC systems. For example, this could be a metric from the software you use (ns simulated, number of years simulated, iterations) or a metric tied to research progress (number of compounds modelled, data points analysed, papers published). There may also be ideas in literature related to your work area of what a good choice may be. You may want to trial different functional units to see which one works best for your work.
As a concrete example, imagine that you are simulating the dynamics of a biomolecular system (using software such as GROMACS, Amber, or NAMD) then you could well choose the number of ns simulated as your functional unit.
You can use multiple functional units simultaneously to have multiple HPC-CI values for your use of HPC systems. Different HPC-CI units may be more or less useful in different contexts.
6. Calculate HPC-CI rate
Now you have both the total emissions for your use of HPC systems and the number of functional units arising from the same use of HPC systems you can calculate the HPC-CI by dividing the total emissions by the total number of functional units.
To continue our example of biomolecular simulation that we mentioned above, we would take the total emissions from our HPC system use - let us say this came out to be 1500 kgCO2e - and the total number of functional units - say 950 ns simulated - and combine them:
HPC-CI = 1500 kgCO<sub>2</sub>e / 950 ns = 1.58 kgCO<sub>2</sub>e/nsExercise: HPC-CI rate
In the previous exercise we computed the total HPC system emissions for 3 months of project use to be 14,184 kgCO2e. The project was modelling the climate and managed to simulate 3,680 years of Earth’s climate during that 3 month period using 1,100 GPUh of resource.
- What is the HPC-CI in kgCO2e per simulated year?
- What is the HPC-CI in kgCO2e per GPUh?
Given by:
14,184 kgCO<sub>2</sub>e / 3,680 simulated years = 3.85 kgCO<sub>2</sub>e/simulated yearGiven by:
14,184 kgCO<sub>2</sub>e / 1,100 GPUh = 12.89 kgCO<sub>2</sub>e/GPUh
Estimating emissions associated with future use of HPC systems
As well as using the HPC-CI metric as a tool to help quantify and reduce your emissions from HPC system use it can also be used to project the emissions from HPC system use from future or planned projects. Many funding bodies are starting to ask for emissions estimates as part of the submission process. Calculating HPC-CI values can help you to provide these estimates.
Now we understand how to estimate our emissions (HPC-E) and how to define a useful metric to understand our emissions rate linked to some concrete output from our use of HPC systems (HPC-CI). The next section looks at how emissions can be reduced and, ideally, eliminated.
- The GHG protocol is a metric for measuring an organisation’s total carbon emissions and is used by organisations all over the world.
- The GHG protocol puts carbon emissions into three scopes. Scope 3, also known as value chain emissions, refers to the emissions from organisations that supply others in a chain. In this way, one organisation’s scope 1 and 2 will sum up into another organization’s scope 3.
- You can use the GHG protocol to estimate your emissions from HPC system use but it requires access to reasonable quality information from the HPC systems you are using.
- The HPC-CI is a metric designed specifically to calculate emissions from HPC systems and is a rate rather than a total. This can be used to measure improvements in emissions efficiency and drive reductions in emissions.
Content from Reducing Emissions
Last updated on 2025-09-19 | Edit this page
Overview
Questions
- What methodologies are available to reduce carbon emissions and how do they differ?
- What is the difference between “net zero” and “carbon neutral” climate commitments?
- How can I reduce the emissions from my use of HPC systems?
Objectives
- Understand different carbon reduction methodologies and their role in meeting climate commitments.
- Appreciate the difference between “net zero” and “carbon neutral” climate commitments.
- Understand matching strategies for energy from renewable sources.
- Introduce potential strategies for reducing emissions from HPC system use.
Introduction
In recent years, many economic actors have sought to reach different climate goals by making various commitments to reducing carbon emissions.
The terms “net zero”, “carbon neutral”, “carbon negative”, and “climate neutral” have been used interchangeably when discussing goals to remove, reduce and prevent carbon emissions. As interest in these targets grows, it is essential to have a common understanding of what these terms mean and how to achieve them through the strategies and measurement procedures we have learnt.
Carbon reduction methodologies
There are many ways to reduce emissions but it’s important to understand the exact mechanism of the reduction when thinking about reduction targets.
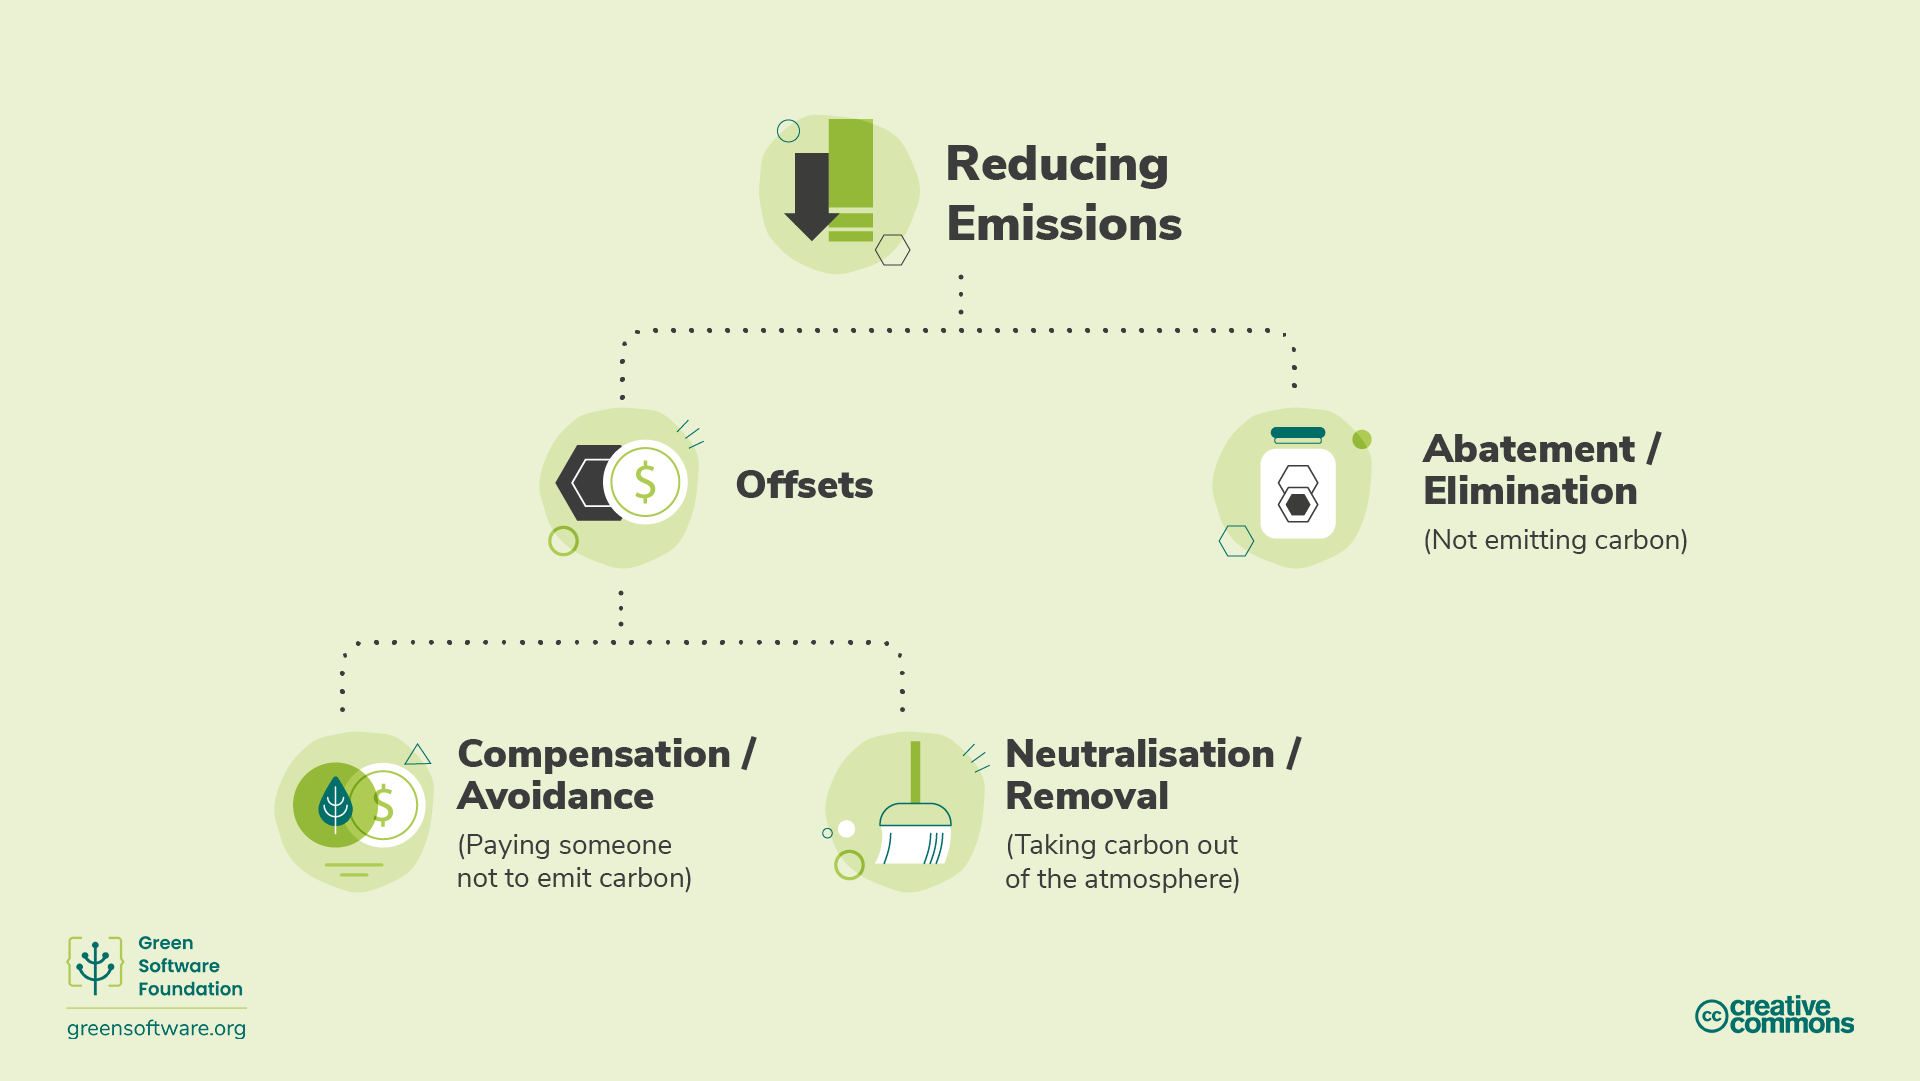
Abatement / Carbon Elimination
The Science Based Targets Initiative refers to a mechanism called abatement, which means eliminating sources of CO2 emissions associated with an organisation’s operations and value chain so that they do not enter the atmosphere. The value chain describes the full range of activities needed to create a product or service, from conception to distribution.
Abatement is not enough on its own as there will always be some emissions that cannot be eliminated due to technological or economic constraints, but it must form the core of every emissions reduction strategy.
To balance those residual emissions, we need to look at other mechanisms such as offsets, compensations or neutralisations.
Exercise: Strategies for abatement
Abatement is the critical component of carbon emissions reduction strategies. Pick one of the questions below (the one that is most relevant for your role) and write down some answers:
- Can you think of actions that individual users/researchers could take to implement abatement in their use of HPC systems?
- Can you think of actions that a service operator could take to implement abatement in the operation of HPC systems?
- Can you think of actions that a organisation procuring HPC systems could take to implement abatement when buying HPC systems?
- Individual users:
- Run fewer jobs!
- Reduce wasted resources by having fewer job failures
- Run on systems that minimise emissions (spatial shifting)
- Run when emissions from electricity are lower (temporal shifting)
- Service operators:
- Build scheduler policies to eliminate emissions
- Provide tools and information that allow users to quantify their emissions and measure reductions
- Provide training on carbon emissions and abatement strategies
- Service procurement:
- Purchase the minimum amount of hardware possible for the service
- Build scoring on amount of embodied and operational emissions into procurement process
- Site HPC systems at locations that have low carbon intensities
- Run services for as long as possible
Offsets
Offsets are direct investments in emission-reduction projects through the purchase of carbon credits on the voluntary carbon market (VCM). The VCM is a decentralised market where private actors voluntarily buy and sell carbon credits that represent certified removals or reductions of GHGs from the atmosphere.
To offset emissions, you need to purchase the equivalent volume of carbon credits to compensate for those emitted, where 1 carbon credit corresponds to 1 tonne of CO2 absorbed or reduced.
Various positive benefits can stem from these projects, from ecosystem protection to empowering local communities. However, to ensure these programs are implemented correctly and have the desired effect on the environment and the aim to reach world net zero, there are global standards that they must meet such as Verified Carbon Standard (VCS) and Gold Standard (GS).
HPC-CI and Offsets
There are some limitations to carbon offsets and that is why they are not considered in an HPC-CI metric. For example, imagine two projects, both running on a HPC service that is 100% carbon offset and matched 100% by renewable energy. Project A has invested significant time and resources into making sure it is using resources efficiently, whereas project B uses resources very inefficiently. For the HPC-CI to be a helpful metric, project A needs to score better than project B.
If the HPC-CI considered offsets, both projects would score 0. This would not tell us anything about how efficiently they are using resources. Although project B is emitting more carbon molecules into the atmosphere per unit of output, its score is still 0 and the lowest score is 0, therefore why would it make further investments into improving its carbon efficiency?
HPC services and users need to have plans for how to both eliminate as well as neutralise emissions and the HPC-CI helps them to drive the elimination of emissions due to their use of HPC systems. This makes the HPC-CI a useful tool to help a research project or HPC service reach net zero.
Compensating / Carbon Avoidance
Compensations are actions that organisations or individuals can take to help society avoid or reduce emissions. This is essentially investing in other organisations’ abatement projects.
This includes actions such as:
- Conservation - Credits are created based on carbon not released through protecting old trees.
- Community projects - These projects help communities worldwide, mainly developing ones, by introducing sustainable living methods.
- Waste to energy - These projects capture methane/landfill gas from smaller villages, or human/agriculture waste, and convert it into electricity.
Neutralising / Carbon Removal
Neutralisations are actions that organisations or individuals take to remove carbon from the atmosphere. Neutralisations refer to the removal and permanent storage of atmospheric carbon to counterbalance the effect of releasing CO2 into the atmosphere. This includes actions such as:
- Enhancing natural carbon sinks that remove CO2 from the atmosphere. For example, forest restoration, since photosynthesis removes CO2 naturally. Forest expansion comes with challenges as it is essential not to impact the dynamics of farmland and food supply elsewhere. Modern farming methods can also prolong the time carbon remains stored in soil.
- Direct air capture is the process of capturing CO2 from the air and storing it permanently, either underground or in long-lived products like concrete.
The effectiveness of these methods is typically measured based on whether they can deliver carbon removal at the scale and speed needed.
When it comes to carbon removal projects, durability is a critical consideration. The durability of a project describes how long the carbon dioxide will be kept from the atmosphere.
Short-term durability is up to 100 years, medium-term is 100 to 1,000 years, and long-term is more than 1,000 years.
- Solutions that rely on Earth’s natural carbon cycle have short-term durability measured in decades. For example, forestry projects have a durability of 40 to 100 years.
- Engineered solutions such as direct air capture often have long-term durability measured in millennia. For example, direct air capture has a durability of 10,000 years.
- Long-term projects are typically orders of magnitude more expensive than short-term projects. Once emitted, carbon remains in the atmosphere for 5,000 years. To be considered net zero, carbon that has been emitted needs to be permanently removed.
A short-term carbon removal project will only remove carbon for 100 years, after which it is back in the atmosphere warming up our planet. This is one of the reasons why abatement is preferred to neutralisation. Never releasing carbon is far better than releasing carbon and then trying to keep it out of the atmosphere for 5,000 years.
Climate commitments
There are many different emissions reduction strategies that an organisation can commit to, from carbon neutral to net zero. Understanding the different meanings and implications of each one and finding out which are used by the facilities you use helps you understand how your use of HPC fits within wider climate goals.
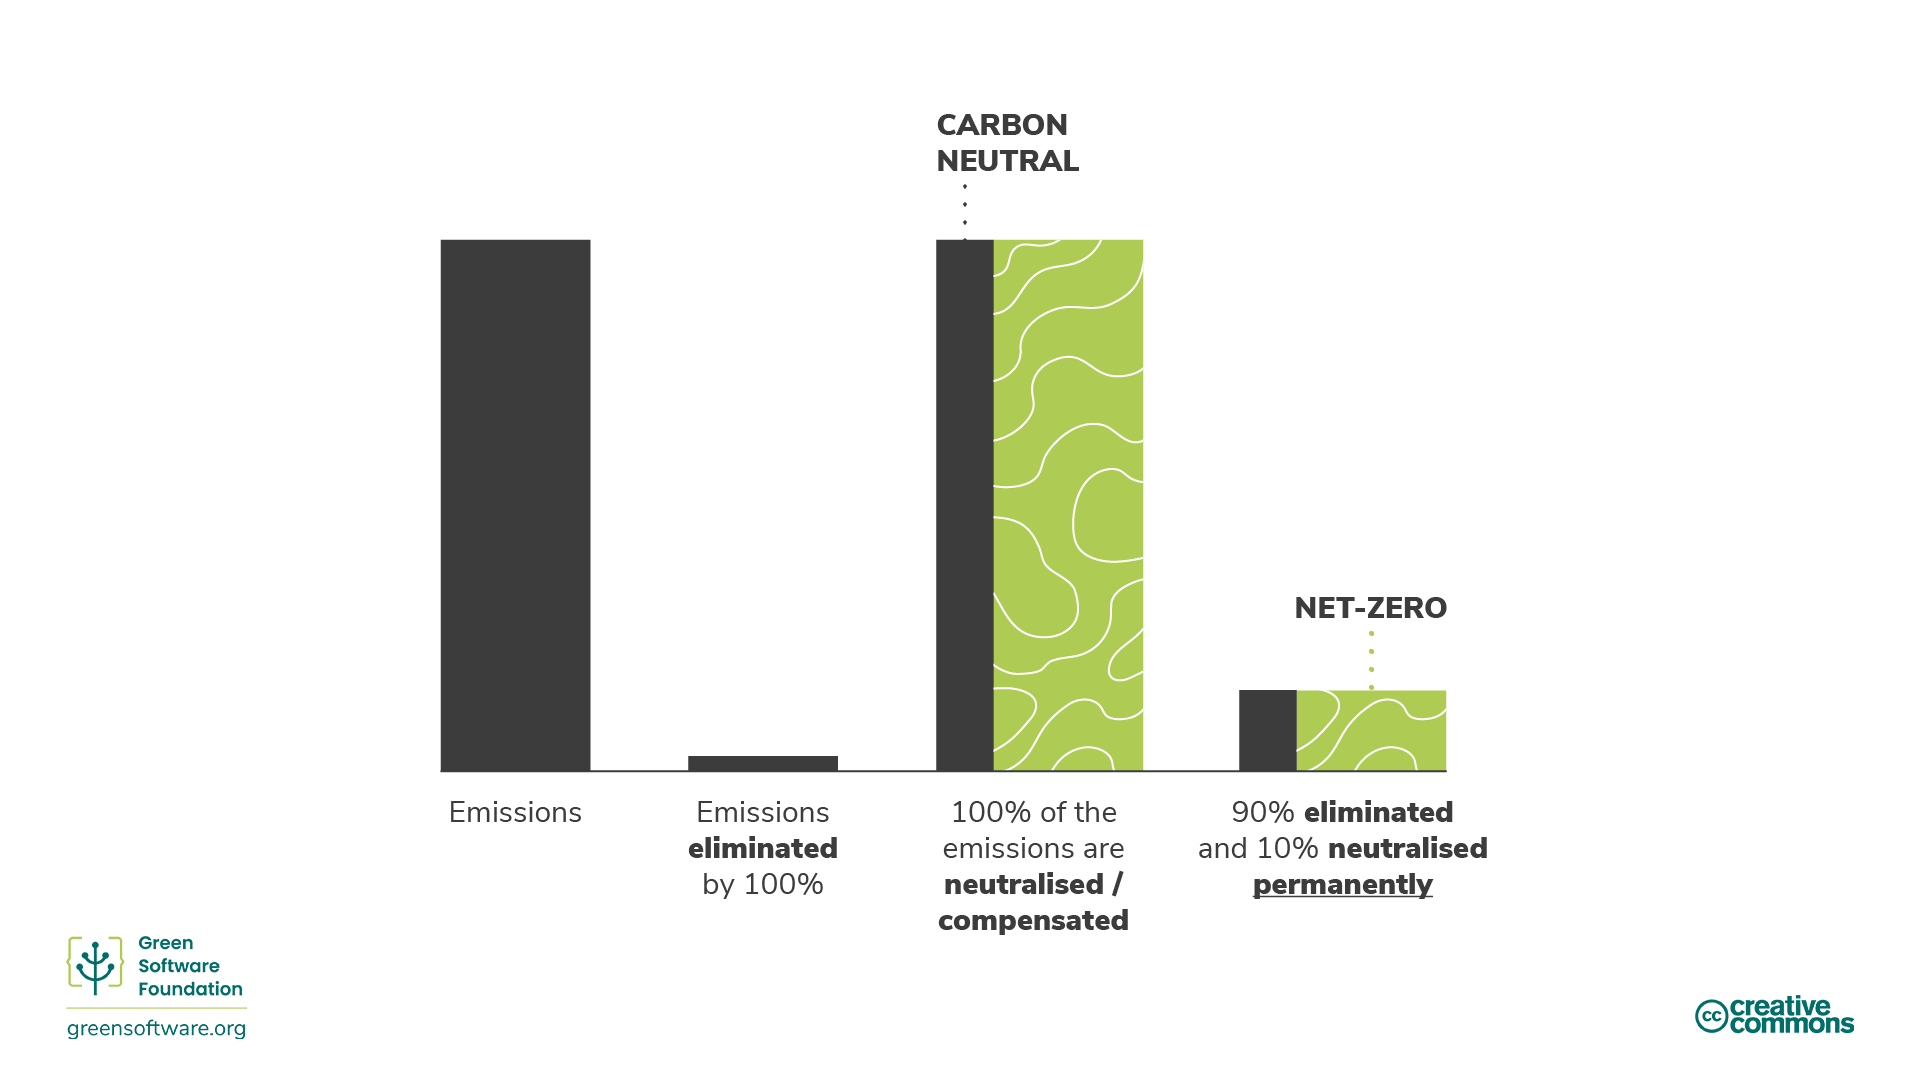
Carbon Neutral
To achieve carbon neutrality, an organisation must measure its emissions, then match the total to its emissions offsets through carbon reduction projects. This can include carbon removal projects (neutralisations) and carbon avoidance projects (compensations).
Carbon neutrality is defined by an internationally recognized standard: PAS 2060. Although this does recommend an organisation sets abatement targets, it does not demand they reduce their emissions. So to be considered carbon neutral, an organisation can just measure and offset without investing resources in eliminating their carbon emissions.
To be carbon neutral, you must cover direct emissions (scope 1 and 2). The general expectation is that organisations measure and offset their scopes 1 and 2, and business travel from scope 3. However, there is no specific requirement to include that.
Carbon neutral is a significant first step for any organisation since it encourages measurement. However, there are not enough carbon offsets in the world to offset the emissions of all the organisations. Therefore, any strategy that does not include abatement will not scale or help the world achieve the 1.5°C target set by the Paris Climate Agreement. This is where net zero comes into play.
Net Zero
Net zero means reducing emissions according to the latest climate science and balancing remaining residual emissions through carbon removals (neutralisations). Net zero, by definition, requires emissions reductions in line with a 1.5°C pathway. All organisations must do this to achieve net-zero global emissions by 2050.
The crucial difference between net zero and carbon neutral is that net zero focuses on abatement rather than neutralisations and compensations. A net-zero target aims to eliminate emissions and only to use offsetting for the residual emissions that you cannot eliminate
The standard for net zero is being developed by the Science Based Targets initiative (SBTi). They calculate that there is a 66% probability of limiting global warming to 1.5°C if we reach a level of abatement of about 90% of all GHG emissions by mid-century. So, to meet a net-zero target, an organisation needs to eliminate 90% of its emissions by 2050. The remaining emissions can only be offset using neutralisations and permanent carbon removals.
A net-zero strategy would mean that the actual amount of carbon in the atmosphere remains constant.
Also, to be a net-zero target, you must cover direct and indirect, i.e. supply chain emissions (scopes 1,2 and 3). This is significant since scope 3 often represents the majority of emissions.
Fo HPC facilities, part of these strategies include educating and putting policies and approaches in place to support users to understand and take action to reduce their emissions and maximise the carbon efficiency of their HPC use.
HPC-CI as part of a Net-Zero strategy
The HPC-CI is a metric specifically designed to drive the elimination of emissions. The only way to reduce your rate is to invest time and resources into actions that eliminate emissions. The only activities the HPC-CI recognises as elimination actions are making your use of HPC systems more energy efficient, more hardware efficient, or consuming lower-carbon energy sources. Offsets are an essential component of any climate strategy; however, offsets are not eliminations and therefore are not included in the HPC-CI metric.
Any net-zero strategy needs to have plans for how to both eliminate as well as neutralise emissions. The HPC-CI helps organisations and users drive the elimination of emissions due to HPC system use. This makes the HPC-CI a useful component of any net-zero strategy for operation and use of HPC systems.
How can the HPC-CI rate be reduced?
We have mentioned above how the HPC-CI metric is designed to drive abatement of emissions but how can users of HPC systems, operators of HPC systems and organisations that procure HPC systems actually improve the HPC-CI metric? We try to answer this question in this section but it is worth nothing that action is required by all of these parties to reduce emissions from HPC systems.
Reduction in consumption of HPC
While we cover strategies for reducing emissions from a roughly constant amount of HPC use or HPC provision it is clear that a key part (possibly the most important part) of reduction of emissions from HPC use is a reduction in the consumption and provision of HPC. At a fundamental level we need to reduce the amount of compute we are using and the amount of compute hardware we are buying.
“We seem to need reminding that computing is not exempt from having to drastically reduce emissions. Instead of assuming computing can innovate the path to a greater future, the bravest and most heroic action the computing sector could take is to show restraint and leadership, …”
Bran Knowles et al. Our House Is On Fire: The climate emergency and computing’s responsibility.
Users of HPC systems
Before we delve into different approaches for different components of
the HPC-CI equation, there is a high level consideration that can reduce
both the E and M terms in the HPC-CI equation
simultaneously:
Ensure any use of HPC is useful - this sounds obvious but most HPC users will have had the experience of running jobs on HPC systems which consume resources but do not produce useful output due to errors in the software, the input parameters or even the script that runs the job. To improve the HPC-CI rate:
- Ensure that the jobs you are running will produce useful/significant output even if they run correctly - do not run calculations and jobs without a clear understanding of what they add to the research project.
- Carefully test input files and job scripts with small or short jobs before running at large scale to reduce the likelihood of wasted emissions.
- Consider if you can achieve the same project goals with fewer jobs or calculations. For example, optimise the sampling choices when exploring parameter spaces.
Similarly, for people involved in operating and procuring HPC systems, they need to work to ensure that users on the system have the best opportunity to do useful work and reduce wastage, for example by high quality documentation and training and a service design that supports users in making the most of their resources.
Other strategies for improving the HPC-CI metric and thus reducing emissions depend on whether the dominant component is operational emissions (i.e. emissions from energy use) or the embodied emissions. If the components are evenly balanced then you should look at options from both sections.
Operational emissions dominate:
- Improve the energy efficiency of your use - this may involve power
or frequency capping of the hardware you are using. (This improves the
ratio of
EtoRin the HPC-CI equation.) - Temporal shifting - run when carbon intensity is lower. (Reduces
CI.) - Spatial shifting - run on a system where carbon intensity is lower,
run on hardware which has better energy efficiency for your use case,
e.g. GPU may be more energy efficient for your use. (Reduces
CI, or improves the ratio ofEtoR.) - Run fewer calculations or jobs. (Reduces
EandM.)
Embodied emissions dominate:
- Improve the performance of your use - more output per unit of time
(even at the expense of energy efficiency through removing any power).
(improves the ratio of
MtoR.) - Spatial shifting - run on a system which has lower embodied
emissions rate for your use. (Reduces
M.) - Run fewer calculations or jobs. (Reduces
EandM.)
Operators and procuring HPC systems
For operators of HPC systems and organisations that are procuring HPC systems, many of the strategies above have equivalents. In all cases, evaluation of the emissions of the system must be taken into account as a core part of HPC system procurement and operations. It is also critical that emissions information is made available to users to allow them to compute metrics such as the HPC-CI rate to allow them to work to reduce emissions from their use of HPC systems.
Operational emissions dominate:
- Improve the energy efficiency of your HPC systems - this may involve
power or frequency capping of the hardware you are providing or
purchasing hardware that is more energy efficient for the system use
cases. (Improves the ratio of
EtoR.) - Ensure that the power and cooling plant are as efficient as possible
to minimise overheads. (Reduces
E.) - Enable temporal shifting (either automatically or user controlled) -
for example, run workloads with higher power intensities at times when
carbon intensity is lower. (Reduces
CI.) - Spatial shifting - site HPC systems in locations that have the
lowest carbon intensities. (Reduces
CI.)
Embodied emissions dominate:
- Work with users to improve the performance of jobs on the service - more output per unit of time (even at the expense of energy efficiency through removing any power).
- Extend the lifetime of the service as long as possible to extract maximum value from the emissions already in the atmosphere from purchase of the HPC system.
- Purchase HPC systems that have the best ratio of embodied emissions to performance for the workloads that will be run.
- There are a number of methodologies commonly applied to help in the overall fight against climate change. These fall into the general categories of carbon elimination (also known as “abatement”), carbon avoidance (a.k.a. “compensating”), or carbon removal (a.k.a. “neutralising”).
- Abatement is the most effective way to fight climate change although complete carbon elimination is not possible.
- Compensating includes the adoption of renewable energy sources, sustainable living practices, recycling, planting trees, etc.
- Neutralisations refer to the removal and permanent storage of atmospheric carbon to counterbalance the effect of releasing CO2 into the atmosphere. Neutralisations tend to remove the carbon from the atmosphere in the short- and medium-term.
- Net zero aims to eliminate emissions and only offset the residual emissions that cannot be eliminated to reach the 1.5°C target set by the Paris Climate Agreement.
- Which strategies users or HPC system operators prioritise to reduce emissions depends on if the operational or embodied emissions dominate.
- A key part of reducing emissions from HPC use is reducing our consumption of HPC resources.
Content from Next Steps
Last updated on 2025-03-21 | Edit this page
Overview
Questions
- What other resources are available to help me be more environmentally sustainable?
Objectives
- Provide links to other useful resources around reducing and eliminating emissions
We have now reached the end of the material for this workshop. In this section we provide links to useful resources around carbon emissions that may help you on your journey towards reducing and eliminating emissions from your work and beyond.
Tools and emissions quantification
- Green Algorithms
- How Bad are Bananas? - Book, Mike Berners-Lee
- Data Carbon Scorecard
- Cloud Carbon Footprint
Communities and groups
Sustainable research
Other training
- There are a lot of useful resources for understanding and reducing emissions.
