Reproducible Reports with Quarto
Last updated on 2026-05-12 | Edit this page
Overview
Questions
- How can we create reproducible reports?
Objectives
- Be able to generate a report using
targets
Copy-paste vs. dynamic documents
Typically, you will want to communicate the results of a data analysis to a broader audience.
You may have done this before by copying and pasting statistics, plots, and other results into a text document or presentation. This may be fine if you only ever do the analysis once. But that is rarely the case—it is much more likely that you will tweak parts of the analysis or add new data and re-run your pipeline. With the copy-paste method, you’d have to remember what results changed and manually make sure everything is up-to-date. This is a perilous exercise!
Fortunately, targets provides functions for keeping a
document in sync with pipeline results, so you can avoid such pitfalls.
The main tool we will use to generate documents is
Quarto. Quarto can be used separately from
targets (and is a large topic on its own), but it also
happens to be an excellent way to dynamically generate reports with
targets.
Quarto allows you to insert the results of R code directly into your documents so that there is no danger of copy-and-paste mistakes. Furthermore, it can generate output from the same underlying script in multiple formats including PDF, HTML, and Microsoft Word.
Installing Quarto
As of v2022.07.1, RStudio comes with Quarto, so you don’t need to install it separately. If you can’t run Quarto from RStudio, we recommend installing the latest version of RStudio.
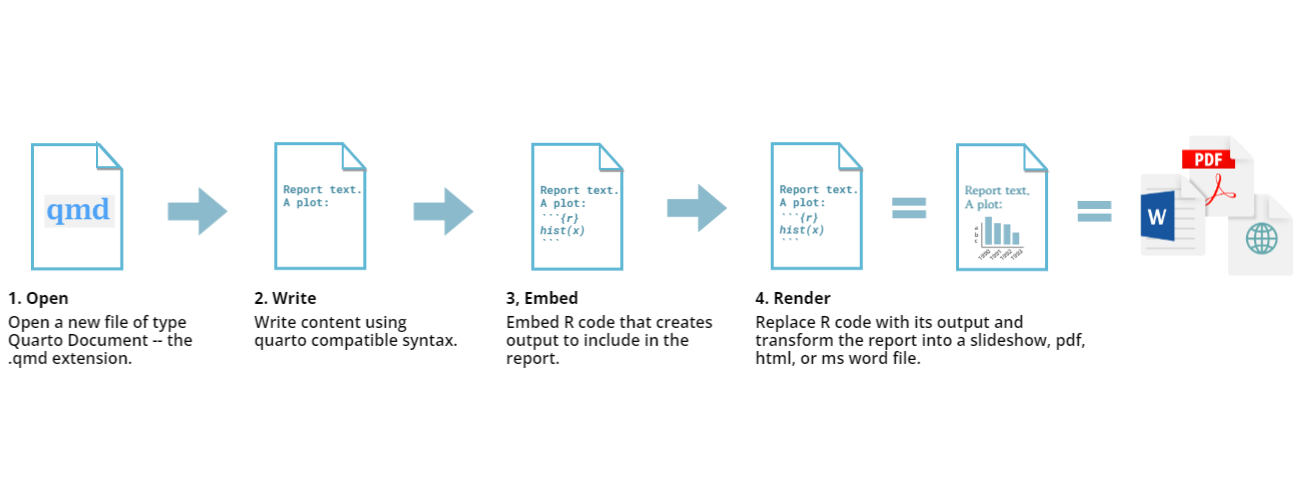
About Quarto files
.qmd or .Qmd is the extension for Quarto
files, and stands for “Quarto markdown”. Quarto files invert the normal
way of writing code and comments: in a typical R script, all text is
assumed to be R code, unless you preface it with a # to
show that it is a comment. In Quarto, all text is assumed to be prose,
and you use special notation to indicate which lines are R code to be
evaluated. Once the code is evaluated, the results get inserted into a
final, rendered document, which could be one of various formats.
We don’t have the time to go into the details of Quarto during this lesson, but recommend the “Introduction to Reproducible Publications with RStudio” incubator (in-development) lesson for more on this topic.
Recommended workflow
Dynamic documents like Quarto (or Rmarkdown, the predecessor to
Quarto) can actually be used to manage data analysis pipelines. But that
is not recommended because it doesn’t scale well and lacks the
sophisticated dependency tracking offered by targets.
Our suggested approach is to conduct the vast majority of data
analysis (in other words, the “heavy lifting”) in the
targets pipeline, then use the Quarto document to
summarize and plot the results.
Report on bill size in penguins
Continuing our penguin bill size analysis, let’s write a report evaluating each model.
To save time, the report is already available at https://github.com/joelnitta/penguins-targets.
Copy the raw
code from here and save it as a new file
penguin_report.qmd in your project folder (you may also be
able to right click in your browser and select “Save As”).
Then, add one more target to the pipeline using the
tar_quarto() function like this:
R
source("R/functions.R")
source("R/packages.R")

tar_plan(
  # Load raw data
  tar_file_read(
    penguins_data_raw,
    path_to_file("penguins_raw.csv"),
    read_csv(!!.x, show_col_types = FALSE)
  ),
  # Clean and group data
  tar_group_by(
    penguins_data,
    clean_penguin_data(penguins_data_raw),
    species
  ),
  # Get summary of combined model with all species together
  combined_summary = model_glance(penguins_data),
  # Get summary of one model per species
  tar_target(
    species_summary,
    model_glance(penguins_data),
    pattern = map(penguins_data)
  ),
  # Get predictions of combined model with all species together
  combined_predictions = model_augment(penguins_data),
  # Get predictions of one model per species
  tar_target(
    species_predictions,
    model_augment(penguins_data),
    pattern = map(penguins_data)
  ),
  # Generate report
  tar_quarto(
    penguin_report,
    path = "penguin_report.qmd",
    quiet = FALSE
  )
)
The function to generate the report is tar_quarto(),
from the tarchetypes package.
As you can see, the “heavy” analysis of running the models is done in
the workflow, then there is a single call to render the report at the
end with tar_quarto().
How does targets know when to render the report?
It is not immediately apparent just from this how
targets knows to generate the report at the end of
the workflow (recall that build order is not determined by the
order of how targets are written in the workflow, but rather by their
dependencies). penguin_report does not appear to depend on
any of the other targets, since they do not show up in the
tar_quarto() call.
How does this work?
The answer lies inside the
penguin_report.qmd file. Let’s look at the start of the
file:
MARKDOWN
---
title: "Simpson's Paradox in Palmer Penguins"
format:
  html:
    toc: true
execute:
  echo: false
---

```{r}
#| label: load
#| message: false
targets::tar_load(
  c(combined_summary,
    species_summary,
    combined_predictions,
    species_predictions
  )
)

library(tidyverse)
```

The goal of this analysis is to determine how bill length and depth are related in three species of penguins from Antarctica.
The lines in between --- and --- at the
very beginning are called the “YAML header”, and contain directions
about how to render the document.
The R code to be executed is specified by the lines between
```{r} and ```. This is called a “code chunk”,
since it is a portion of code interspersed within prose text.
Take a closer look at the R code chunk. Notice the use of
targets::tar_load(). Do you remember what that function
does? It loads the targets built during the workflow.
Now things should make a bit more sense: targets knows
that the report depends on the targets built during the workflow like
combined_summary and species_summary
because they are loaded in the report with
tar_load().
Generating dynamic content
The call to tar_load() at the start of
penguin_report.qmd is really the key to generating an
up-to-date report—once those are loaded from the workflow, we know that
they are in sync with the data, and can use them to produce “polished”
text and plots.
Challenge: Spot the dynamic contents
Read through penguin_report.qmd and try to find
instances where the targets built during the workflow
(combined_summary, etc.) are used to dynamically produce
text and plots.
In the code chunk labeled
results-stats, statistics from the models like R squared are extracted, then inserted into the text with in-line code like`r combined_r2`.There are two figures, one for the combined model and one for the separate models (code chunks labeled
fig-combined-plotandfig-separate-plot, respectively). These are built using the points predicted from the model incombined_predictionsandspecies_predictions.
You should also interactively run the code in
penguin_report.qmd to better understand what is going on,
starting with tar_load(). In fact, that is how this report
was written: the code was run in an interactive session, and saved to
the report as it was gradually tweaked to obtain the desired
results.
The best way to learn this approach to generating reports is to try it yourself.
So your final Challenge is to construct a targets
workflow using your own data and generate a report. Good luck!
-
tarchetypes::tar_quarto()is used to render Quarto documents - You should load targets within the Quarto document using
tar_load()andtar_read() - It is recommended to do heavy computations in the main targets workflow, and lighter formatting and plot generation in the Quarto document