Rendering and Customizing Code Outputs
Last updated on 2025-12-08 | Edit this page
Overview
Questions
- How do you render code in Quarto documents?
- How do you apply code chunk options at the document level to customize your code?
- How do you label and caption code chunks?
- What is inline code, and when should it be used?
Objectives
- Learn how to insert and render runnable chunks of code to integrate into your report.
- Apply labels and captions to code chunks.
- Learn the syntax and how to add in-line code.
- Learn how to load libraries and data for use throughout the whole
.qmddocument.
Rendering Code in Quarto Documents
In the previous episode, we saw how to run our code in code chunks to
test that it works and to preview the code output that will render in
our HTML document, but to actually render the final version, we
need to use the Render button. Using the Render button with
code chunks is a two-step process - first, the code is run (all code
chunks will run automatically). Second, (if there are no code errors),
the document of choice will render for our whole Quarto document.
Time to Render!
Now, let’s render the Quarto file and see how our code output looks on the final HTML page.
Wait… what’s all that output in our document? We don’t want that in our paper!
This happens because the output from the running code (messages, results, warnings, etc.) gets added to the Quarto document instead of being printed to the console. Let’s see about adjusting the output to look better using code chunk rendering options.
Code Chunk Options
There are over 50 different code chunk options!!! Obviously, we will not go over all of them, but they fall into several broader categories: code evaluation, text output, code style, cache options, plot output, and animation. We’ll discuss a few options for code evaluation, text output, and plot output.
Code chunk options in Quarto are added within code chunks and always have the following format:
#| option: option-text
Common code chunk options:
include = (logical) whether to include the chunk
output in the output document (defaults to TRUE).
eval = (logical or numeric) TRUE/FALSE to evaluate (or
not) or a numeric value like c(1,3) (only evaluate expressions 1 and
3).
echo = (logical or numeric - following the same rules
as above), whether to display source code or not.
results = (logical or character) text output of the
code can be hidden (hide or FALSE) or delineated in a certain way
(default ‘markup’).
warning = (logical) whether to display the warnings in
the output (default TRUE). FALSE will output warnings to the console
only.
message = (logical) whether or not to display messages
that appear when running the code (default TRUE).
Using Code Chunk Options for Clean Quarto Documents
Ok, let’s use some of the options above to improve the look of our
Quarto document. Add the following options one by one to see how they
change your output (click Render after each option you
add):
- echo: false
- message: false
- warning: false
- results: false
These options mean the source code will not be printed in the rendered HTML document, messages from the code will not be printed in the rendered HTML document, and warnings will not be printed in the HTML document (but will still output to the console). Plots, figures, or whatever is printed by the code WILL show up in the final html document.
Now, we are seeing what we would like: a figure without other output to show in our paper.
Rendering Code (Optional)
Given the following options, how will some hypothetical code render? Try it out with the code we just added to visualize the styling change.
```{r}
#| eval: TRUE
#| include: FALSEThe expressions in the code chunk will be evaluated, but the output
figures/plots will not be included in the rendered document.
When might you want to use this?
If you need to calculate some value or do something on your dataset for
a further calculation or plot, the output is not essential to include in
your paper narrative.
Tip:
Find a complete list of code chunk options on Knitr developer Yihui Xie’s online guide to knitr.
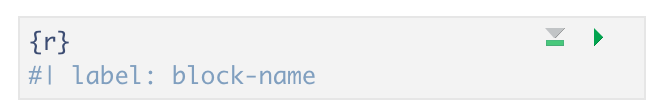
Label Your Code Chunk
Before we fix how our code output looks, let’s pause a second and give our code chunk a label. While not required for running your code, it is good practice to give a name to each code chunk because a label is a unique identifier that allows for more advanced options (such as cross-referencing) to work with your QMD files later on:
Some things to keep in mind
- The chunk label syntax is always
#| label: chunk-labelwithchunk-labelreplaced with your own text - The chunk label has to be unique (i.e., you can’t use the same name for multiple chunks)
We’ll see where this code chunk label comes in handy. But, for now, let’s go back and give our first code chunk a name:
#| label: fig-heartrate
When naming your code chunks that will produce figures or tables, use
fig- and tbl-. We will learn how these will
allow for cross-references.
Tip: Don’t use spaces, periods, or underscores in code chunk labels
Avoid spaces, periods (.), and underscores
(_) in chunk labels and paths. If you need separators, you
are recommended to use hyphens (-) instead. For example,
setup-options is a good label, whereas setup.options and chunk 1 are
bad; fig-path = ‘figures/mcmc-’ is a good path for figure output, and
fig-path = ‘markov chain/monte carlo’ is bad. See more at: https://yihui.org/knitr/options/
Caption Your Code Chunk Output
The options we just looked at focus on code evaluation and text
output. However, we have another set of options that deal with how plot
or figure outputs look at the act. Many of the options start with
fig. The one we will use today allows us to add a caption
to our figure. Again, this is an optional feature, but if you need (or
want) to add captions to your publication, it is straightforward to do
so in code chunks.
The caption information also resides at the top of a code chunk using
the #| syntax as such:
#| fig-cap: "Figure Caption Here"
Don’t forget to put the caption within quotes
"".
Adding a caption and cleaning up unwanted content for Figure 2
Let’s add the following caption: “Mean heart rate of stress and control groups at baseline and during intervention.” and ensure only the figure and the caption will be displayed in the HTML document.
So, you should end up with the following in your code chunk:
```{r}
#| label: fig-heartrate
#| echo: false
#| message: false
#| warning: false
#| results: false
#| fig-cap: "Mean heart rate of stress and control groups at baseline and during intervention."
Set the option fig-cap to equal the text in double
quotes.
More plot/figure options
Other options that change how a plot or figure appears often use the
syntax fig-xxx, similar to fig-cap. Some other
useful plot/figure code options include (From Yihui Xie’s page
):
-
fig-width,fig-height: (both are 7; numeric) Width and height of the plot (in inches), to be used in the graphics device. -
out-width,out-height: (NULL; character) Width and height of the plot in the output document, which can be different from its physical fig-width and fig-height, i.e., plots can be scaled in the output document. -
fig-align: (‘default’; character) Alignment of figures in the output document. Possible values are default, left, right, and center. The default is not to make any alignment adjustments. -
fig-link: (NULL; character) A link to be added to the figure. -
fig-alt: (NULL; character) The alternative text to be used in the alt attribute of the image tags of figures in HTML output. By default, the chunk option fig-cap will be used as the alternative text if provided.
Let’s render one more time to see if our figure outputs how we’d like and has a caption.
Time to Render!
Let’s try that again.
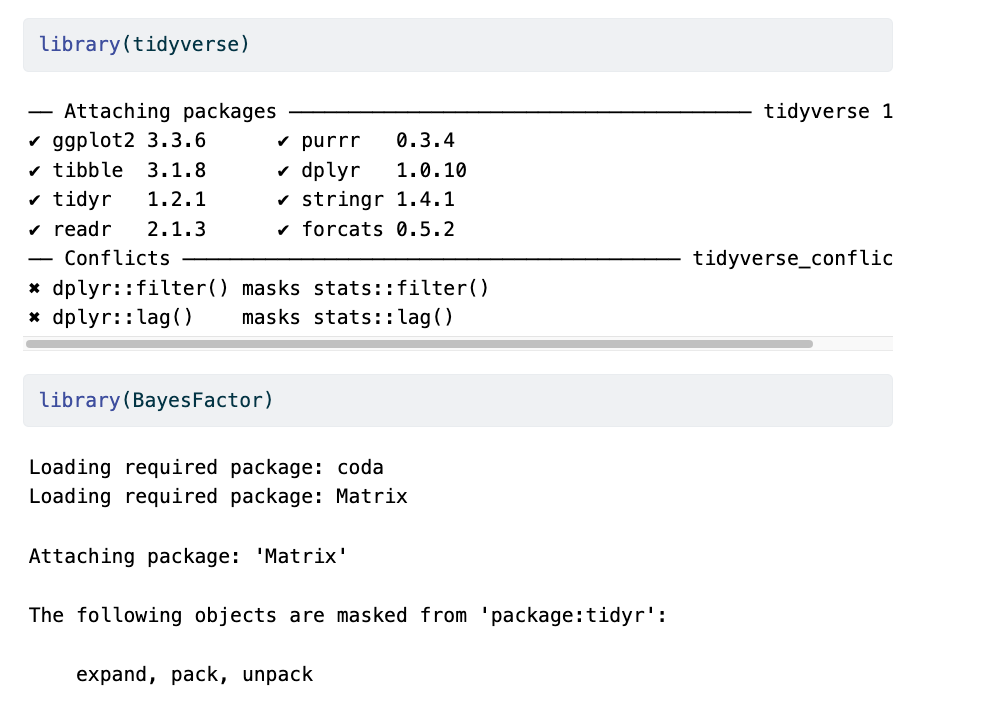
Best Practices for Loading Data and Packages
We can improve organization and rendering speed in our documents by
learning how to load data and packages. So far, we’ve loaded the library
tidyverse and the data frame df we need in the
first code chunk. Now, if we want to add another figure (say, the
hormone analysis code ’hormone_analysis.R`), which uses the same data as
our first code-generated figure, we would be loading the tidyverse and
the data a second time. This is unnecessary because once libraries and
data are loaded in a Quarto document, they are available for use in the
rest of the code in the following document.
The best practice is to load libraries and data once at the beginning of our document, making them available to all other figures and calculations throughout the document, avoiding code repetition and saving rendering time. This also makes it easier for us to keep track of all the libraries and data we need to use in any given document for ourselves and collaborators. If anything needs to be tweaked, we don’t need to search through every code chunk in our QMD document to make a change - it’s listed right at the top.
R
# load libraries
library(tidyverse)
library(BayesFactor)
library(patchwork)

# load data
df <- read_csv("../data/processed/preprocessed-GARP-TSST-data.csv")
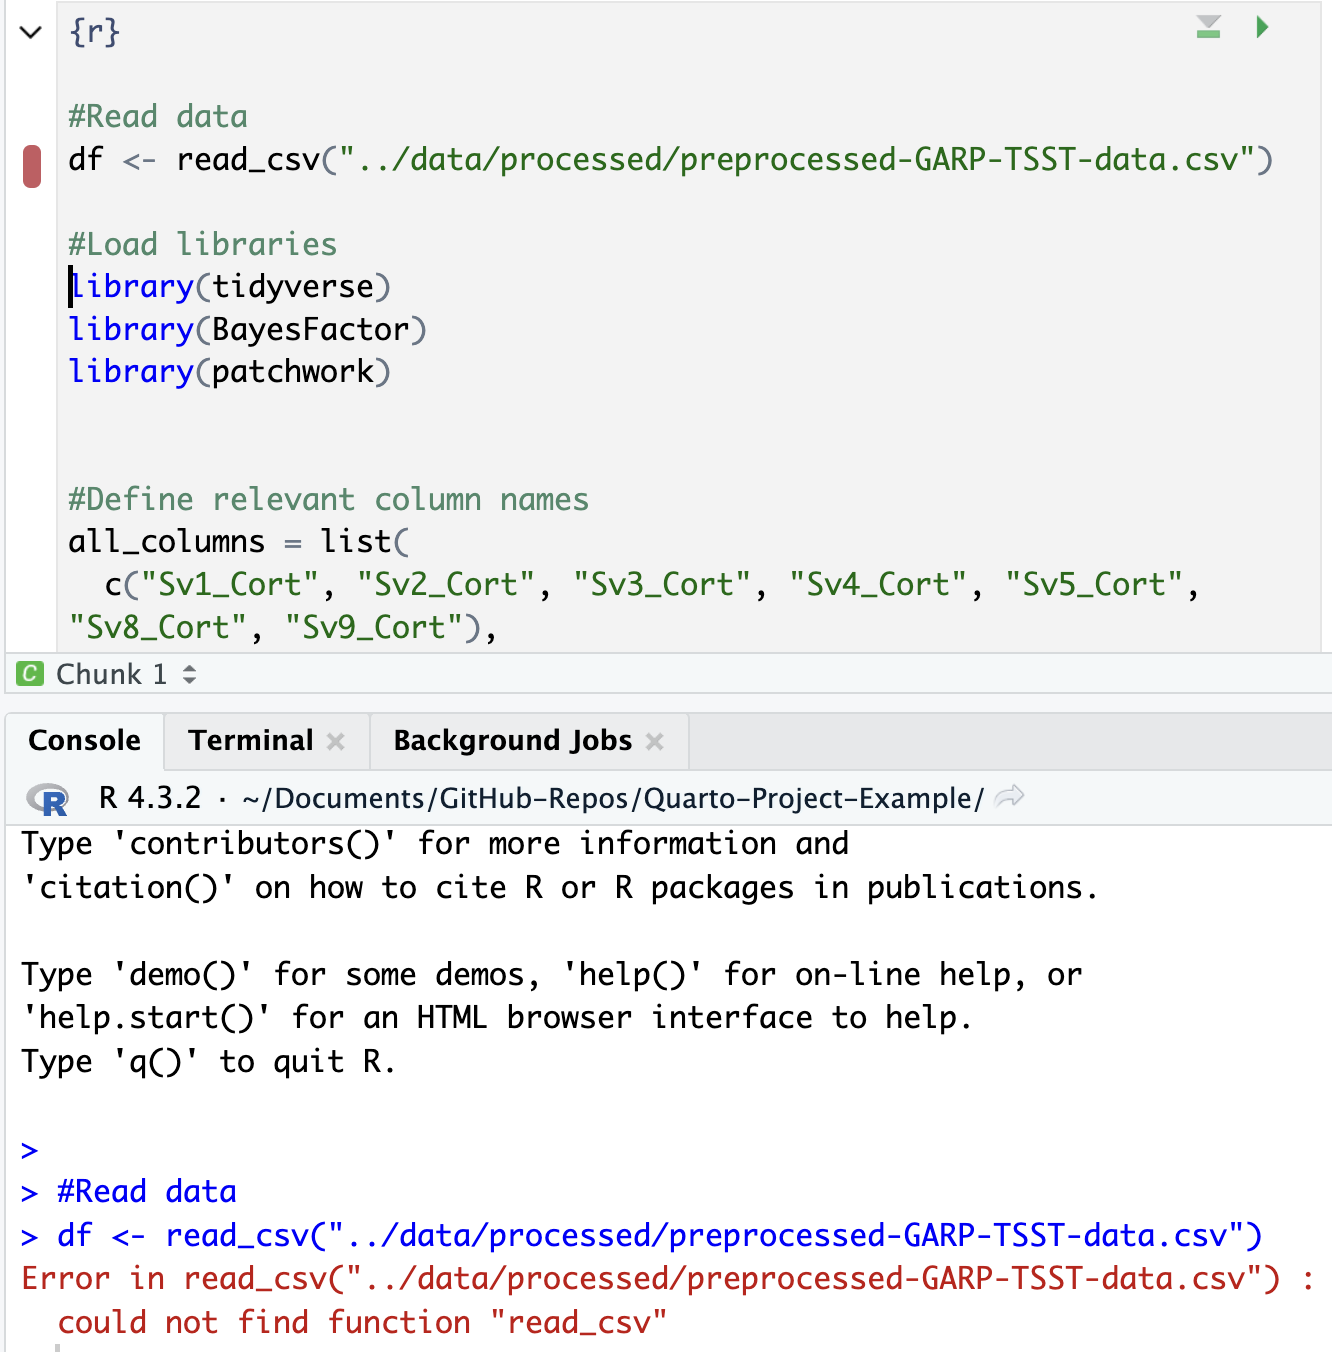
Order matters!
What would happen if we loaded the data before we loaded the libraries?
We would get an error because we haven’t loaded the tidyverse, which is required to read the CSV!
At this point, we could go back through our R scripts and comment out (or delete) the sections at the beginning that load the data and libraries (you will see this is already done in most of the scripts in the code folder). You can imagine that the more code chunks you have, the more time this step would save. Bonus: This also works to load the data before it is called in the inline code, as we will see below.
Adding In-line Code
We have already learned how to create, run, and customize code chunks, but what if you only need to make a quick calculation, and adding a code chunk seems a little overkill?
Sometimes, you need to do a quick calculation to add to your narrative - such as a count of total observations in your data or the mean of one of your variables. In those cases, it may not be worth setting up a code chunk to calculate those values, so Quarto also provides the ability to use inline code.
If that is the case, you can include r code directly in
the text portion of your document by enclosing it between single
backticks. Say you are discussing some of the summary statistics in your
manuscript. Quarto makes this possible through HTML/LaTeX inline code,
which lets you calculate simple expressions directly in your narrative.
Inline code lets you insert `r code`\ into your document to update
portions of your text dynamically. In other words, if your data set
changes, the code will automatically update the specified
calculation.
This can be helpful when referring to specific variables in your data. For example, you should include data-derived numbers as code, not as numbers.
Thus, rather than writing “The CSV file contains choice consistency data for 10.000 simulated participants” (Example 7A), replace the static number with a bit of code that, when evaluated, gives you a dynamic number if anything changes in your dataset. Note that there is no insert option to do this from the menu in the visual editor, so we need to insert inline code manually, for example:
The CSV file contains choice consistency data for `r nrow(bronars_simulation_data)`\ simulated participants.
When you render, you might get an error. Do you have any idea why? That is because we need to import the dataset we are referring to before the inline code can run. Let’s add the following to our chunk at the beginning of the document where we loaded our other data:
R
bronars_simulation_data <- read_csv("../data/raw/bronars_simulation_data.csv")
Time to Render!
If you update your dataset, this value will match the number of rows.
Adding inline code
Suppose we want to add another inline code to the same paragraph. Look for (Example 7B) to represent the average value for violation_count present in the same dataset. Which inline code would we have to add to the following sentence?
Tip: we will need to use a dataset$variable syntax!
`r mean(bronars_simulation_data$violation_count)`
5.3924
Important Note:
Make sure the file you are calling is in the correct subdirectory, and your working directory is set appropriately.
More on inline codes:
Quarto will always display the results of the inline code, but not the code. Inline expressions do not take knitr options.
- Each time you render/knit the document, calculations and plots will run and be displayed.
- Options for code chunks can be set at the document level.