All Images
Image 1 of 1: ‘XKCD 1987: Python Environment’
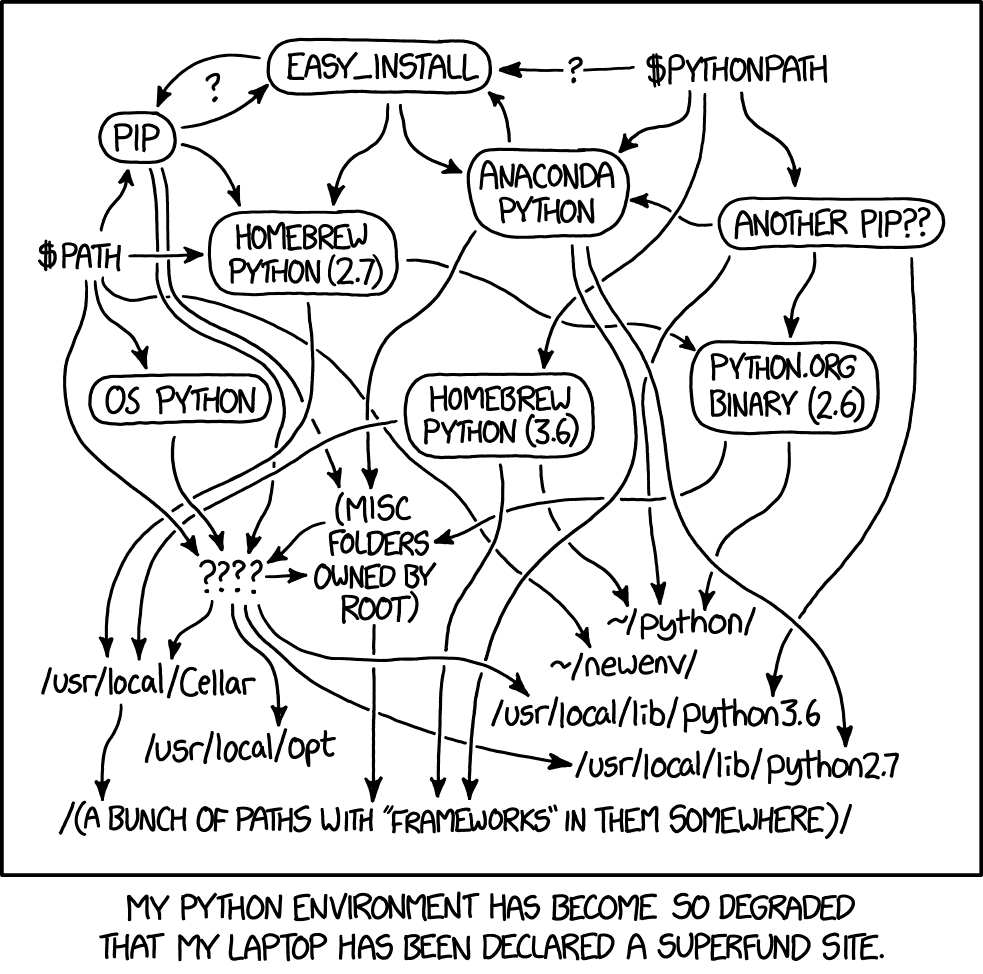
Image 1 of 1: ‘Jupyter Lab - Notebooks - dataviz kernel’
Image 1 of 1: ‘Plot of New Zealand's GDP over time’
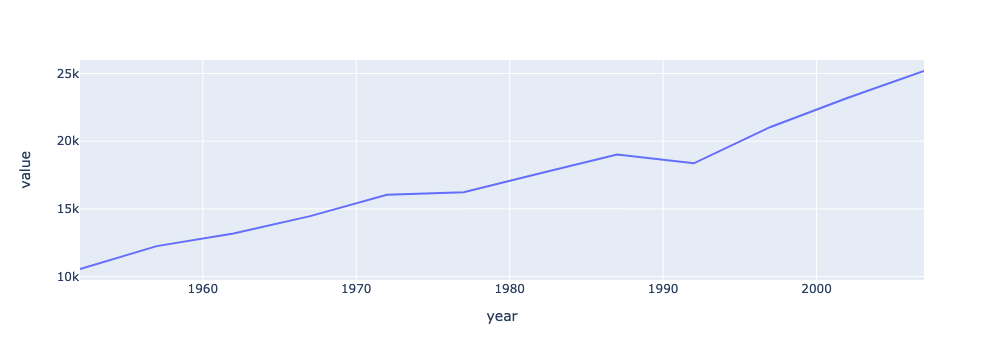
Image 1 of 1: ‘Plot of Oceania's GDP over time’
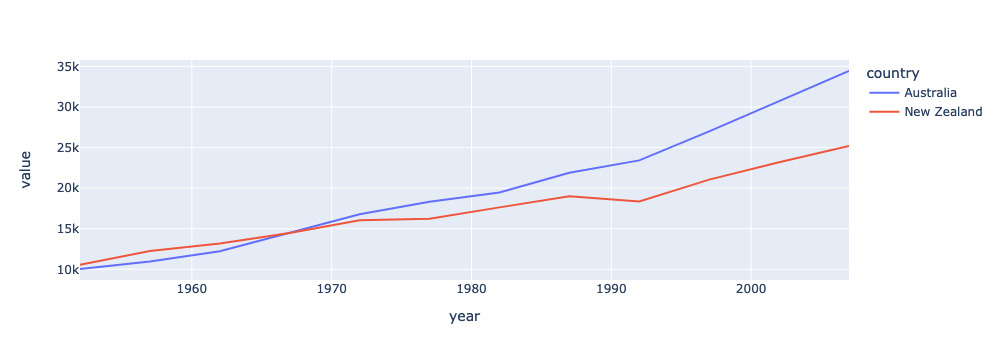
Image 1 of 1: ‘Plot of Oceania's GDP over time with correct labels’
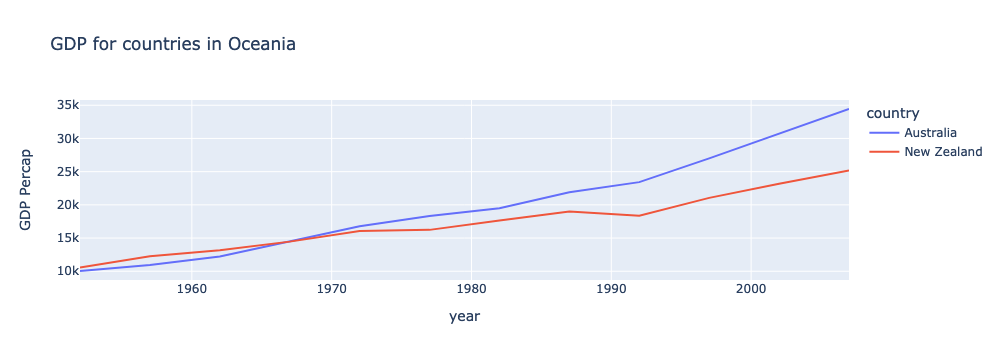
Image 1 of 1: ‘Open a Text File’
Image 1 of 1: ‘Open a Terminal’
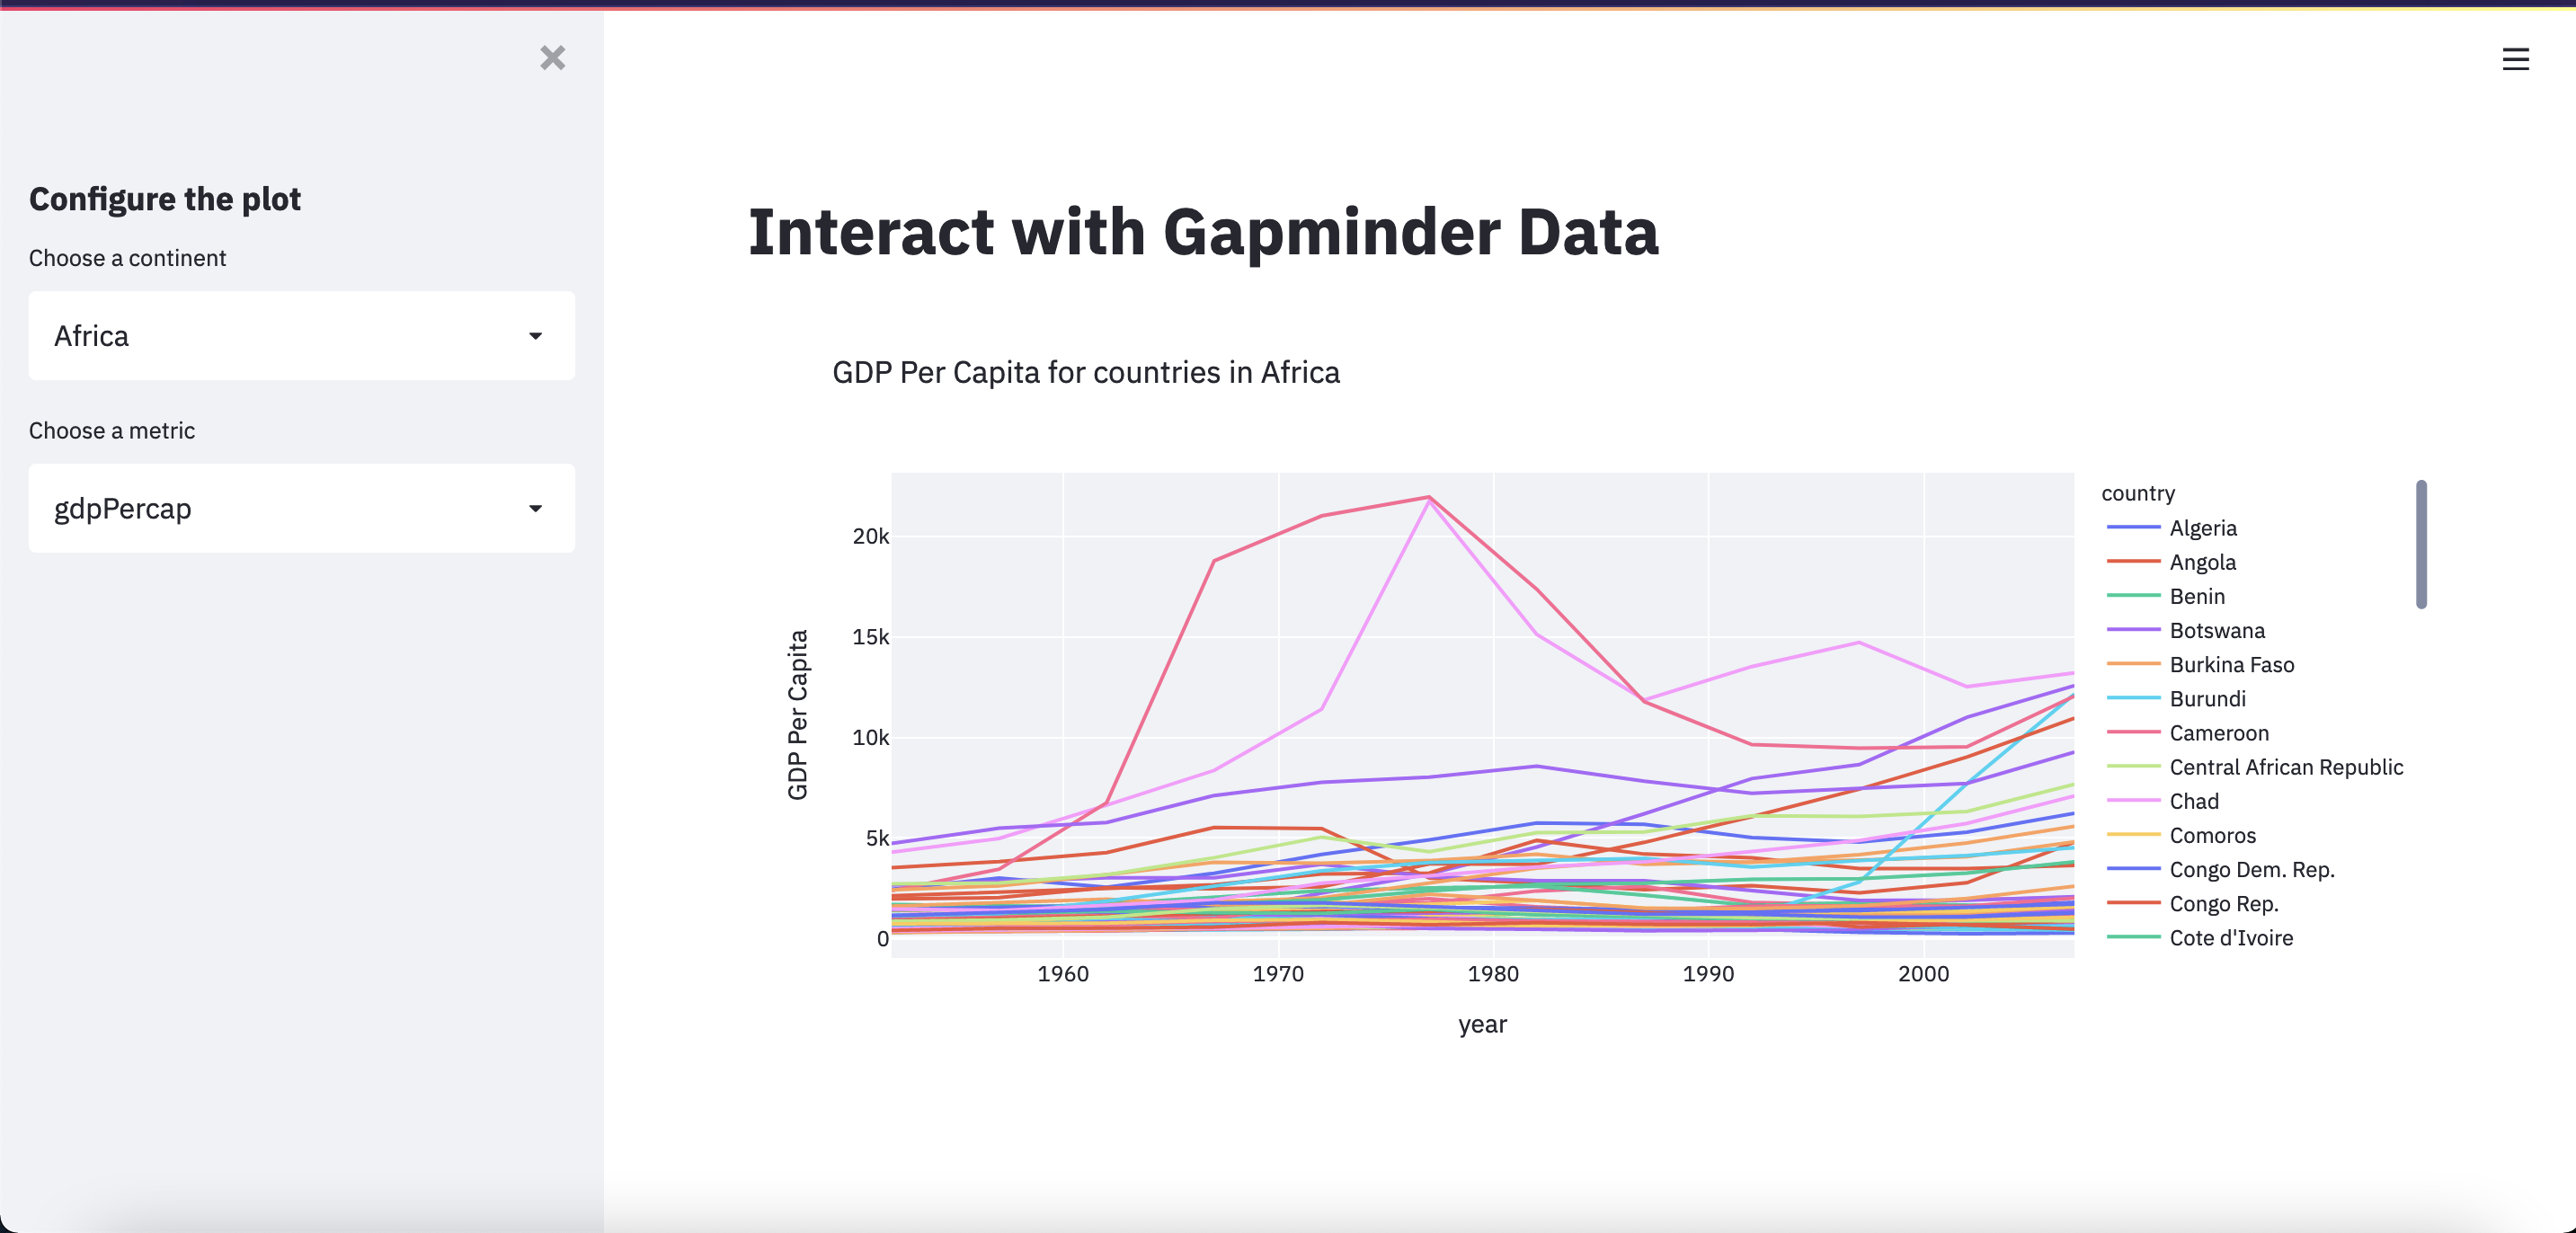
Image 1 of 1: ‘Streamlit app after this lesson’
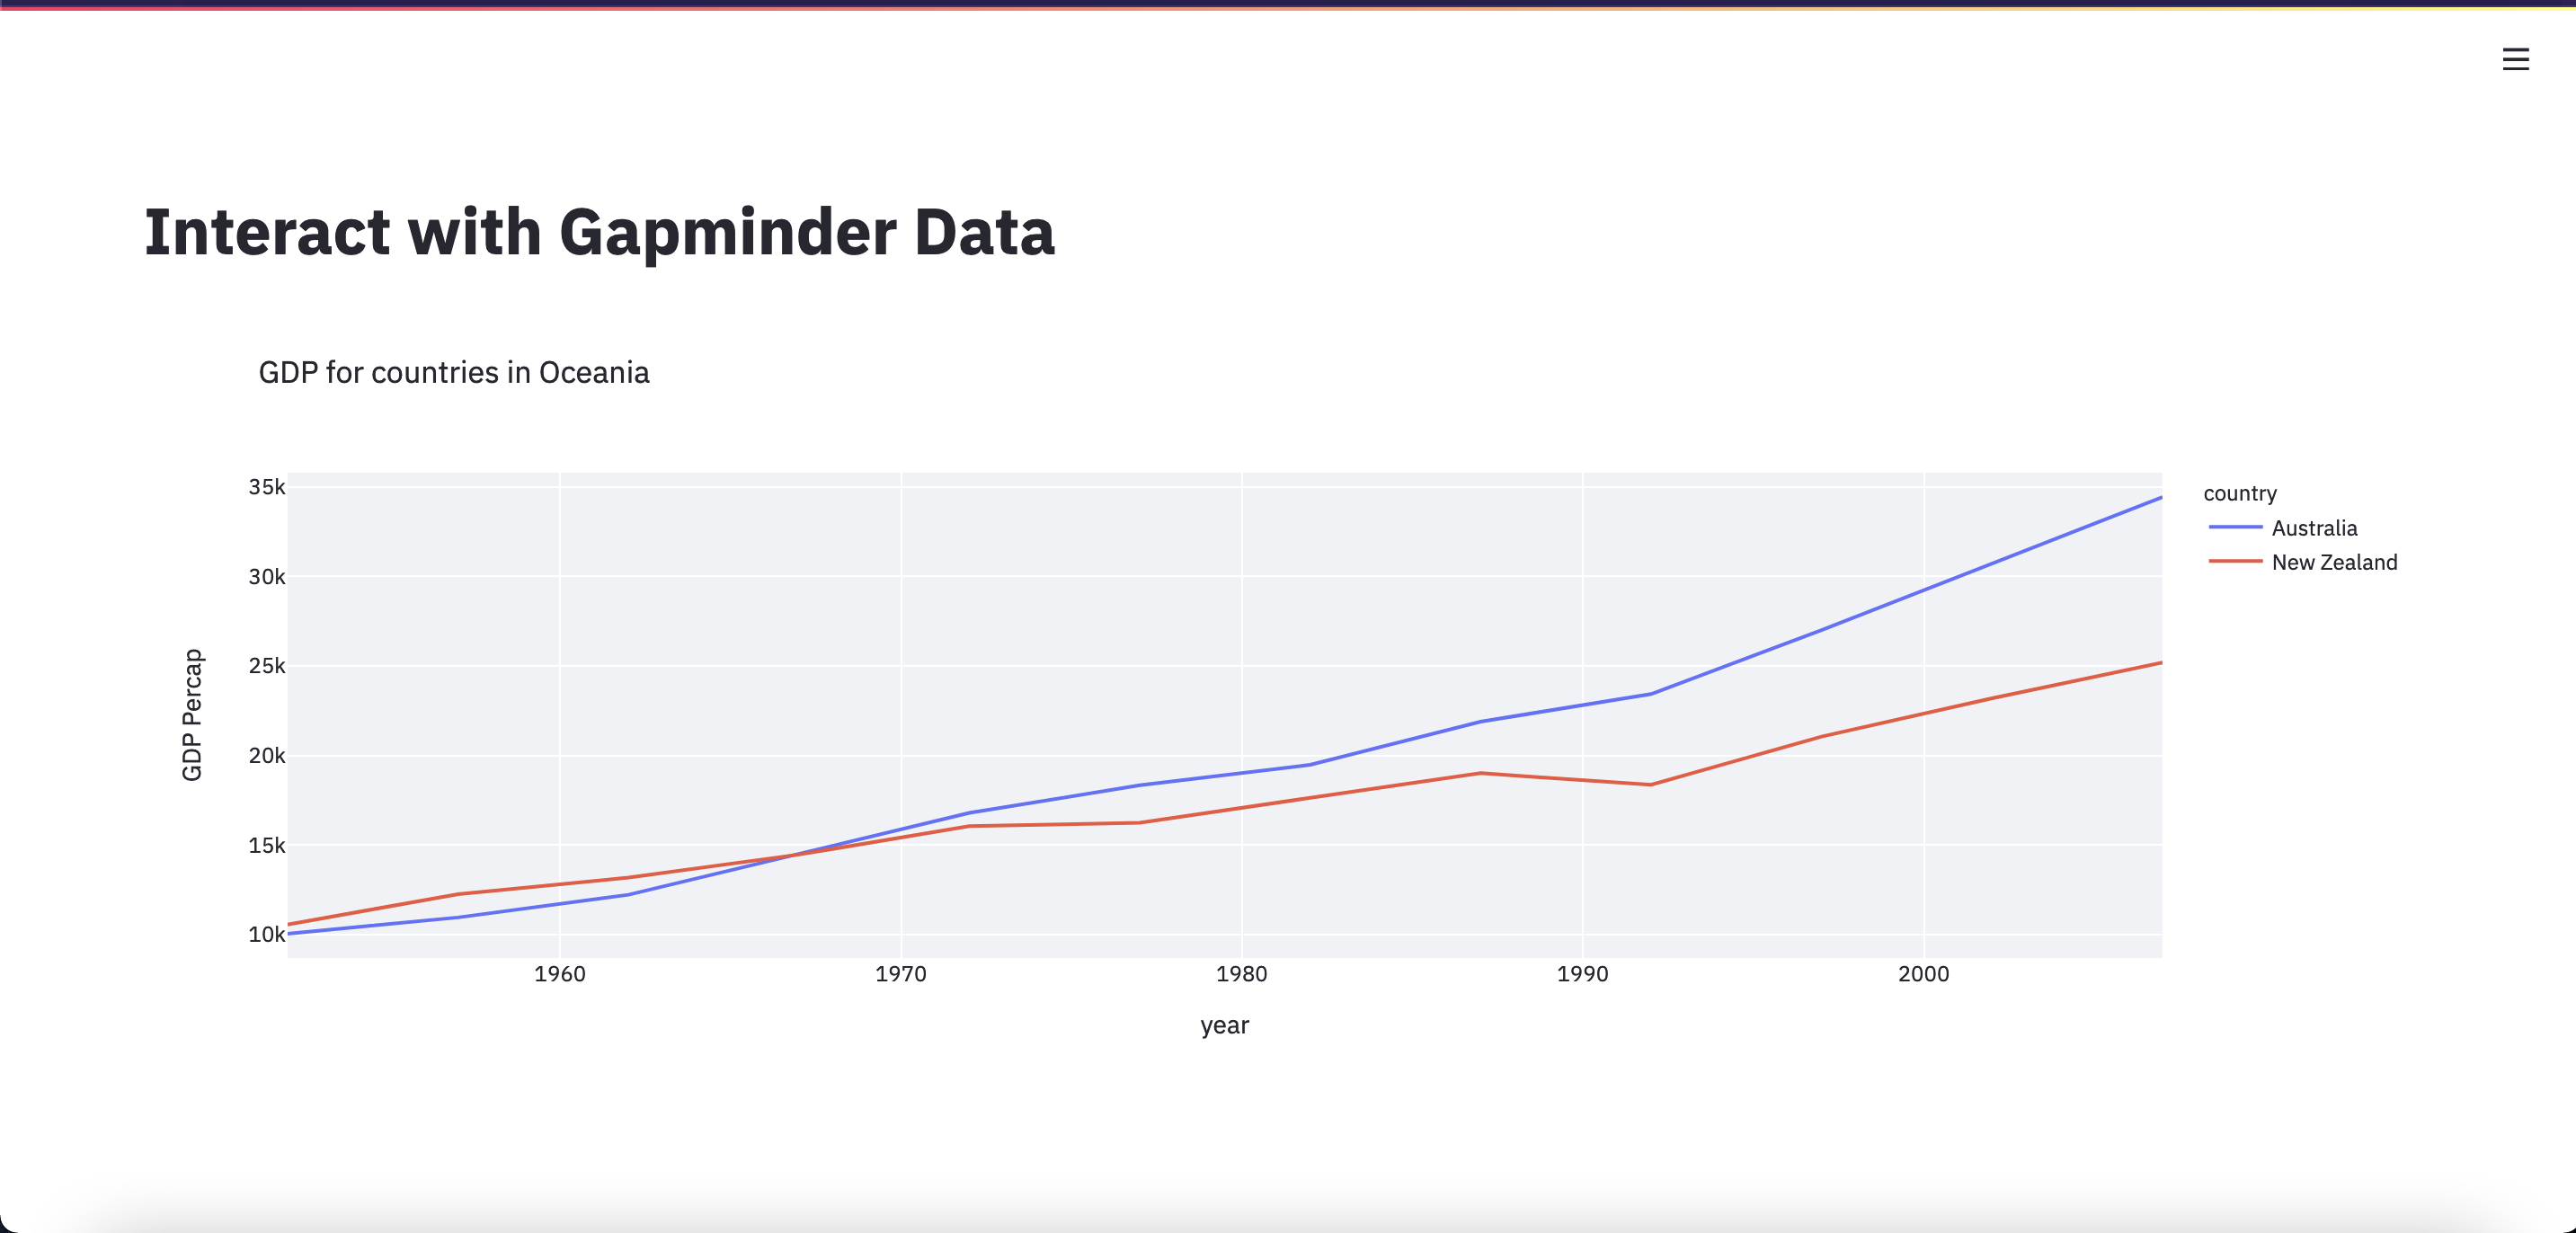
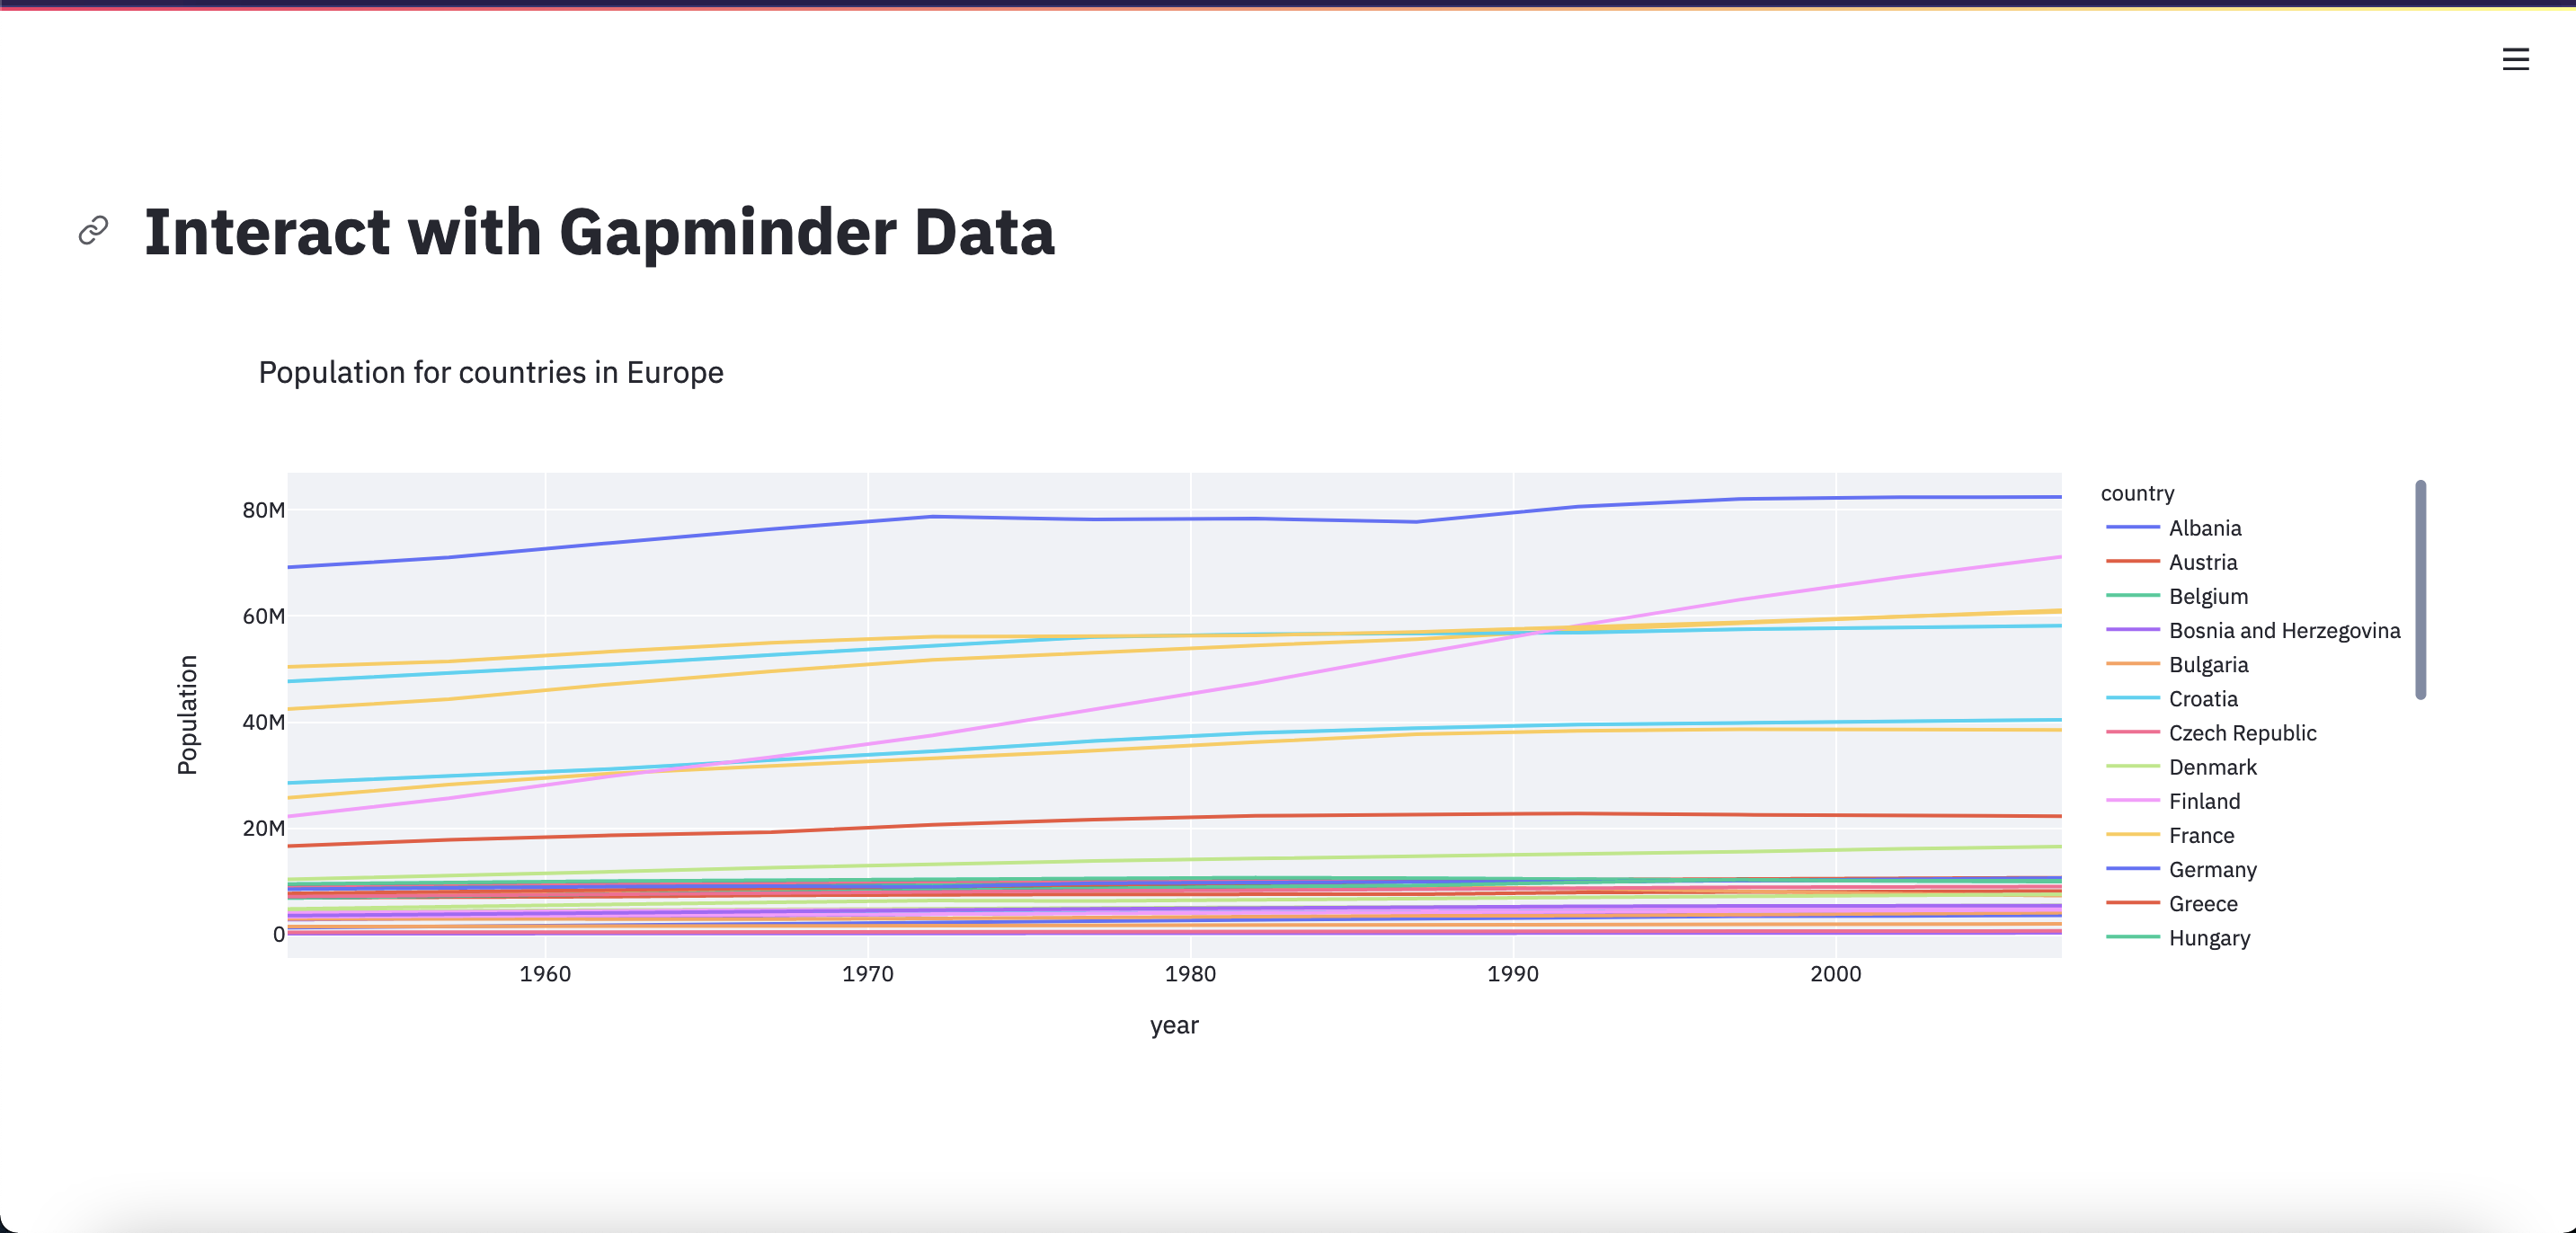
Image 1 of 1: ‘Plot of Europe's population over time with wrong labels’
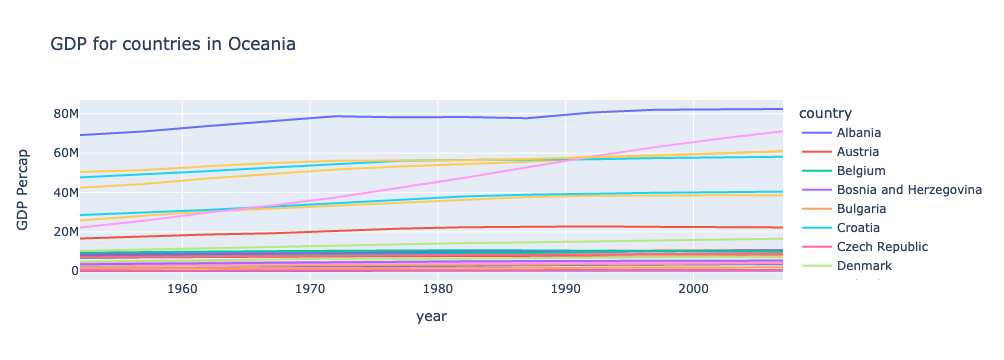
Image 1 of 1: ‘Plot of Europe's population over time with correct labels’
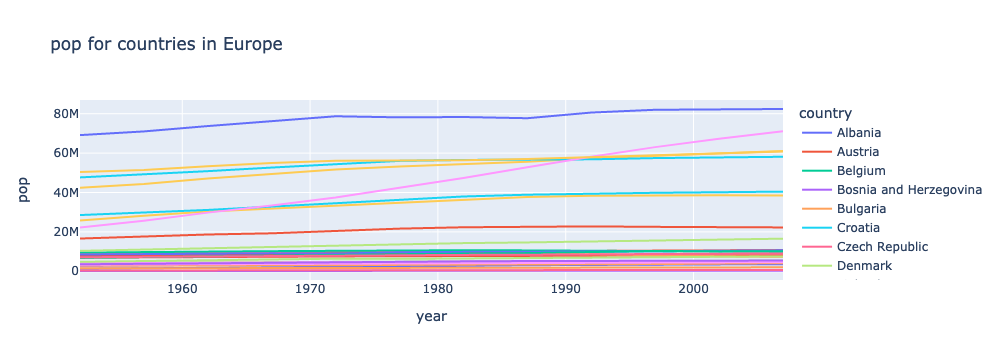
Image 1 of 1: ‘Plot of Europe's population over time with better labels’
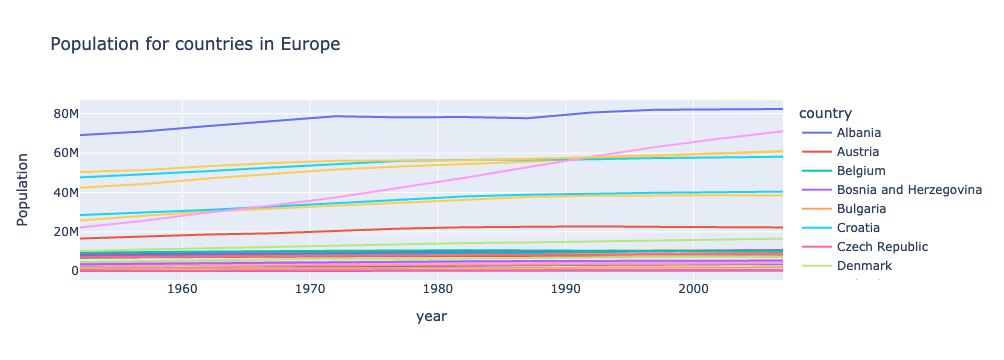
Image 1 of 1: ‘Streamlit app after this lesson’