Working with Tabular Data
Overview
Teaching: 60 min
Exercises: 0 minQuestions
How do I read a file
What is pandas
How to work with table-like data in Python like Excel
Objectives
Describe what the Python Data Analysis Library (Pandas) is.
Load the Python Data Analysis Library (Pandas).
What’s in our data?
Describe what a DataFrame is in Python.
Access and summarize data stored in a DataFrame.
Merge two dataframes, understand different types of join
Perform basic mathematical operations and summary statistics on data in a Pandas DataFrame.
Create pivot table
Merge database
When we have data stored in different data sets, it is frequently helpful to combine the data to provide deeper insight into system behavior. We need to merge the databases—and it turns out that there are several ways to think about this problem.
At a minimum, the databases have to have a join column, which is the set of values which are common to both data sets. Without these values, there is no way to relate the data sets to each other.
Merging data sets is equivalent to using lookup functions like VLOOKUP in a spreadsheet. For example, consider these two tables:
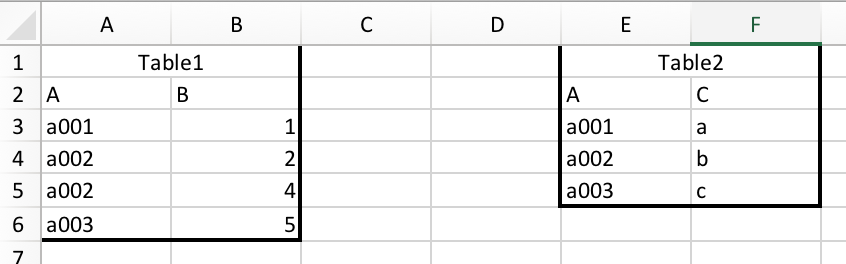
And we want to merge them together:
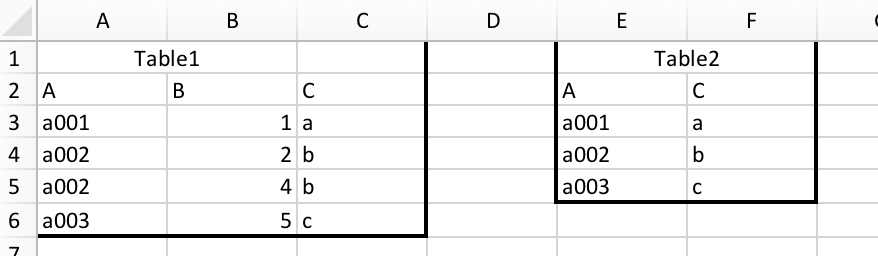
Using a spreadsheet, you end up with a relationship like this,
=VLOOKUP(A3,$E$3:$F$5,2,FALSE)
which is fairly concise but obscures what the tables actually represent and how they are organized.
We will carry out this operation in Pandas with pandas.DataFrame.merge.
DataFrame.merge(Another_DataFrame, how='inner, outer, left or right', left_on="Left_Join_Column_Name", right_on="Right_Join_Column_Name", ...)
DataFrame and its counterpart are straightforward, but what about how? how determines the join type. Assuming column J is the column on which the data sets are to be merged, consider the following ways of putting data together:
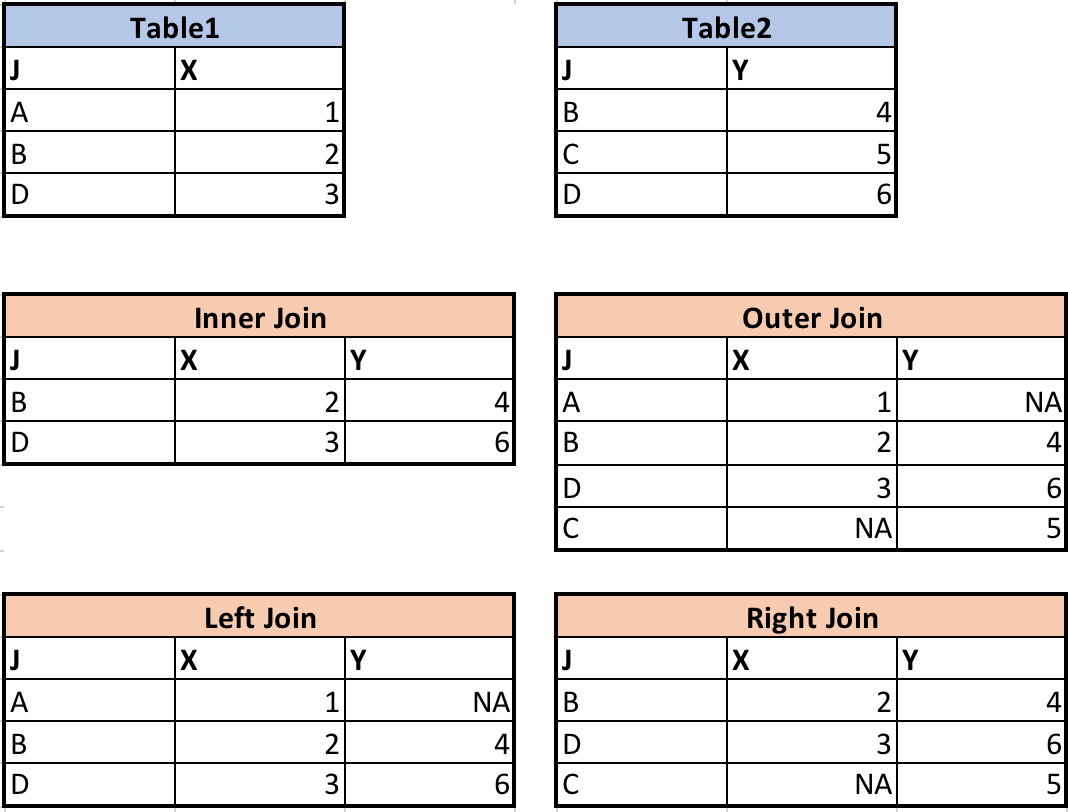
Instructors: now is a good time to draw these out on the board, perhaps using address and ZIP code lookups.
Let’s have a quick demonstration of the merges performed in the charts above.
# firstly, load in the tables
table1 = pd.DataFrame({'J': ['A', 'B', 'D'], 'X': [1, 2, 3]})
table2 = pd.DataFrame({'J': ['B', 'C', 'D'], 'Y': [4, 5, 6]})
Each join is specified simply using how:
# inner join
table1.merge(table2, how="inner", right_on="J", left_on="J")
# outer join
table1.merge(table2, how="outer", right_on="J", left_on="J")
# left join
table1.merge(table2, how="left", right_on="J", left_on="J")
# right join
table1.merge(table2, how="right", right_on="J", left_on="J")
Revisiting our data, we have two DataFrames: soda and invoice. What is common to both of these?
In the invoice DataFrame, the only information about soda is the "Item_id" column. If we want to see details of the soft drink associated with each invoice, we need to join the two tables together. Since the soda DataFrame also has "Item_id" column, only that column can be used as the join column.
Merge the data sets
Merge
sodaandinvtables, call it inv_soda.Not all kinds of soda will appear in the invoice (as some were never sold). If we want to keep everything in the
sodadataframe, what kind of join should we use?Solution
inv_soda = inv.merge(soda, how="left", right_on="Item_id", left_on="Item_id")
Checking Quality and Diagnosing Errors
Check how many rows are there in the joined table. Is it the same as the invoice table (930508 rows)?
If they are different, find the exact record that caused the problem.
Hint: To find an empty value, you can use
df[df["column_name"].isnull()]Solution
len(inv_soda)The result is 93509 rows. This is because one kind of soda was never sold. Let’s find out what is it:
inv_soda[inv_soda["Invoice_id"].isnull()]
Aggregate Function
Let’s suppose now that we want to summarize our data set, for instance by finding the number of bottles of each soft drink that has been sold. In a spreadsheet, we would use a pivot table to start to tease out multivariable summaries. In Pandas, we will use the groupby function. Once we’ve created a groupby DataFrame, we can quickly calculate summary statistics by a grouping of our choice.
# Group data by Item_Description
# The code below counts the number of invoice_id associated with each Item_Description. You can have other
grouped_df = inv_soda.groupby('Item_Description').agg({"Invoice_id":"count"})
grouped_df
You should see a table which begins:
                      Invoice_id
Item_Description
Ace's Energy          262
Ace's Energy Booster  64
Akame's Energy        80
...
"Item_Description" and "Invoice_id" are not at the same level. This is because the groupby function automatically made “Item_Description” the index (as with index_col). Thus if we use grouped_df.columns, we will only see the "Invoice_id" column. To avoid problems when using the aggregated result, we might want to:
grouped_df = inv_soda.groupby('Item_Description', as_index=False).agg({"Invoice_id":"count"})
grouped_df
The columns are at the same level now.
  Item_Description        Invoice_id
0 Ace's Energy            262
1 Ace's Energy Booster    64
2 Akame's Energy          80
...
In this case, if you use grouped_df.columns, both "Item_Description" and "Invoice_id" will show up. These are broadly equivalent, so you can use whichever you prefer.
The "count" column has the name of the counted column, or "Invoice_id". This is confusing, so you should change it to a more descriptive name with the rename() function.
inv_soda.groupby('Item_Description', as_index=False).agg({'Invoice_id':'count'}).rename(columns={'Invoice_id':'Count'})
Our final output is:
  Item_Description        Count
0 Ace's Energy            262
1 Ace's Energy Booster    64
2 Akame's Energy          80
...
Note that the input in
.agg()is a dictionary. We can, in fact, generate multiple aggregate columns at the same time.inv_soda.groupby('Item_Description', as_index=False).agg({"Invoice_id":"count", "Bottle_Cost":"mean"}){.callout}
Finding Averages per Category
Find the average
Bottle_CostandBottle_Retail_Pricefor each categorySolution
inv_soda.groupby('Category', as_index=False).agg({"Bottle_Cost":"mean","Bottle_Retail_Price":"mean"})
Pivot Tables
Spreadsheets perhaps show their power as summarization tools best in the pivot table. Pivot tables let you summarize quantities from many variables in many different ways. Of course, we are able to create something similar using Pandas.
A basic pivot table contains the following parameters:
pandas.pivot_table(DataFrame, values, index, columns, aggfunc)
# values: columns to aggregate (like choosing the field to report in Excel's pivot table)
# index: keys to group by on the pivot table index (just like dragging into the row box in Excel's pivot table)
# columns: keys to group by on the pivot table column (just like dragging into the column box in Excel's pivot table)
# aggfunc: aggregate function, for example, mean, sum, min, etc. (just like setting the values box in Excel;s pivot table)
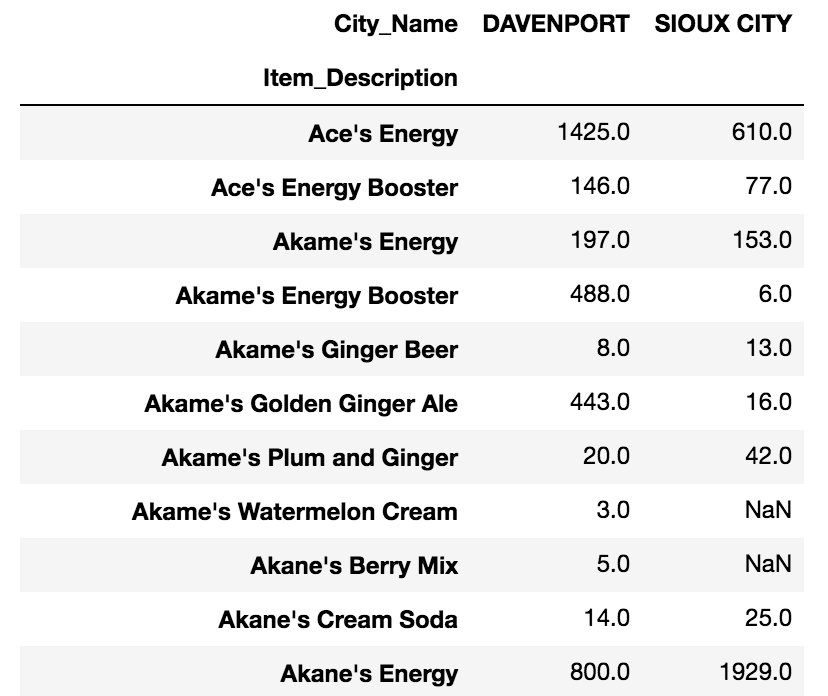
For instance, to see the total bottles sold for each soft drink by city:
pd.pivot_table(inv_soda, values="Bottles_Sold", index = ["Item_Description"],\
            columns = ["City_Name"], aggfunc="sum")
Pivot Table for Bottles Sold by Vendor
Create a pivot table that shows the total number of bottles sold from each vendor in each category. Set
"Vendor_Name"as the index and"Category"as the columns.Solution
pd.pivot_table(inv_soda, values="Bottles_Sold", index = ["Vendor_Name"],\
            columns = ["Category"], aggfunc="sum")
Key Points
Use
read_csvto read tabular data into Python.use sort_values([columns]) to sort the dataframe.
use df_object.column_name or df_object[column_name] to select one column.
use df_object[list_of_column_names] to select multiple columns.
use df_object[condition] to filter data. For example, df_object[df_object[column_name] == value].
use .describe() to get descriptive statistics of one column.
use df1.merge(df2) to merge two DataFrames.
use df_object.groupby(column_list1).agg({column1:agg_function1, column2:agg_function2…}) to apply aggregation on data group.
Create pivot table with pandas.pivot_table