Discussion
Last updated on 2024-02-18 | Edit this page
Setting up the camera viewpoint
The utils.visualization_utils module defines a series of
utility functions used by several episodes to generate plots of the data
according to some prefixed anatomically meaningful orientations. The
generate_anatomical_slice_figure and
generate_anatomical_volume_figure methods receive a list of
the actors containing the representations of the underlying data to be
displayed and generates a Matplotlib Figure
instance containing the axial superior, sagittal right and coronal
anterior views. generate_anatomical_slice_figure displays
the data at some given particular slices. The methods achieve this by
calling some auxiliary functions that set up the camera in the
appropriate viewpoints. These viewpoints are obtained applying rotations
at given angles; in the mentioned method, the rotations are applied to
the focal point. These rotations are then defined according to the
following perpendicular axes:
- pitch (transverse axis): an axis running from right to left, allowing rotations in the sagittal plane.
- roll (longitudinal axis): an axis directed forward, allowing rotations in the coronal plane.
- yaw (vertical axis): an axis running bottom to top, allowing rotations in the axial plane.
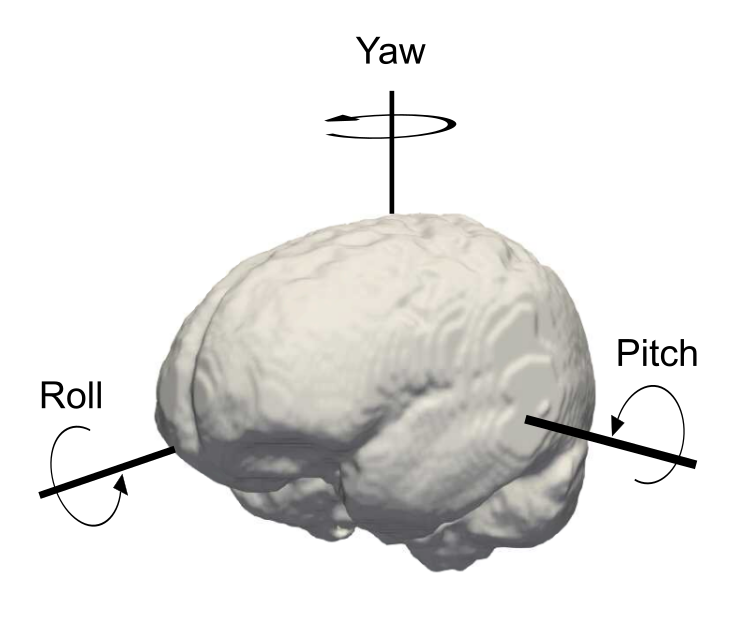
Camera axis orientations
We can visualize the different axis with reference to neuroanatomy and the rotations around them.
The mentioned concepts are common across different 3D visualization packages. The mentioned episode uses the FURY package to generate the visualization scenes.
Multi-shell dMRI data
The lesson presented a way to recover the fODFs on single shell data using the Constrained Spherical Deconvolution method. This is also called Single-Shell Single-Tissue (SSST) CSD since only the white matter tissue is used in the process. Having multiple shell data allows for decomposition of the contribution of different tissues (as different macroscopic tissues have unique b-value dependencies) to the fODF using the so-called Multi-Shell Multi-Tissue CSD (MSMT-CSD) method (Jeurissen et al. 2014). Performing a multi-tissue decomposition using single shell data (Single-Shell 3-Tissue CSD, SS3T-CSD) has also been proposed (Dhollander et al. 2016).
Further derivatives dMRI data
This lesson has shown how to compute the white matter support of the brain using dMRI data and tractography. Tractography allows to obtain many more derivatives, such as the groups of coherent streamlines (bundles) using bundling methods or different measures or scalar maps along bundles (tractometry) using the scalars, such as FA, computed from dMRI data. When combined with structural and functional data, diffusion MRI derivatives can be used to estimate the brain connectivity across different brain regions (using structural MRI parcellations). This is useful, among others, to study diseases (neurological or not) affecting the brain or different aspects related to its functional patterns (such as attention, learning, etc.). Similarly, studying the structural wiring of the brain allows us to study its evolution and do comparative biology analyses to study the brain’s similarities across species.
Limitations of dMRI
The power of diffusion MRI lies in its ability to offer a non-invasive method to study the in vivo human brain. Although the resolution and the information made available from the dMRI data is improving over time (using more powerful MRI machines and other new acquisition sequences), it still does not allow us to reach the level of detail that invasive methods, such as chemical tracers or anatomical sectioning, offer.