All Images
Data Visualization NowVisualizations Help Formulate New HypothesesWhy Communicate Through Visualizations?Why the History of Data Visualization Matters NowWhat Motivated DuBois?Data Visualization as a Scientific Concern for the Du Bois LabCommunicating Science to the Public: The 1900 Paris ExpositionMotivation: What could a scientist do?Turning Data into ArtCombining Different Art FormsPicture This: Getting Creative With DataPraised and PreservedRecap (Overall Learning Objectives)References
Figure 1
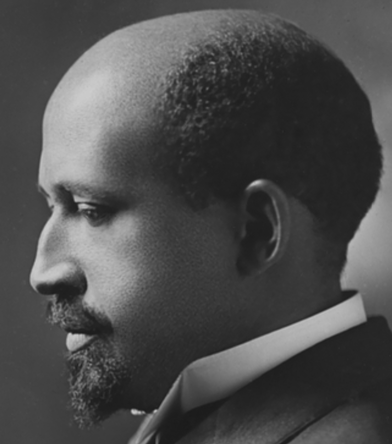
Du Bois, 1911
Figure 2
Figure 3
Figure 4
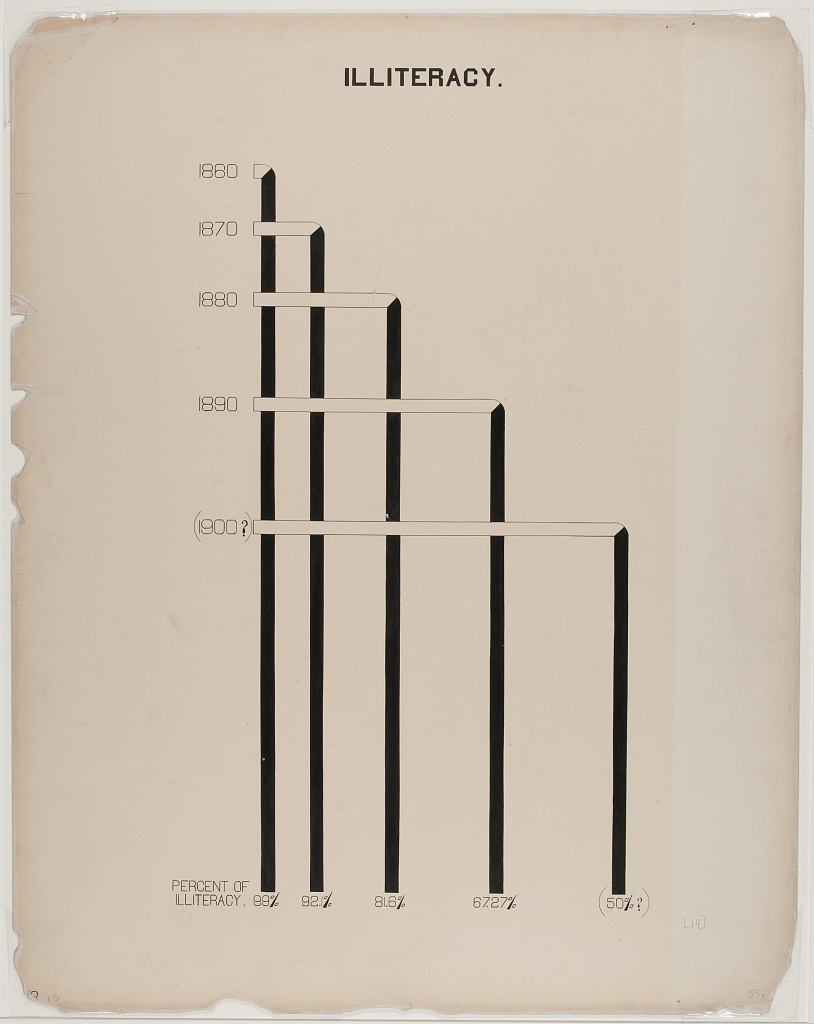
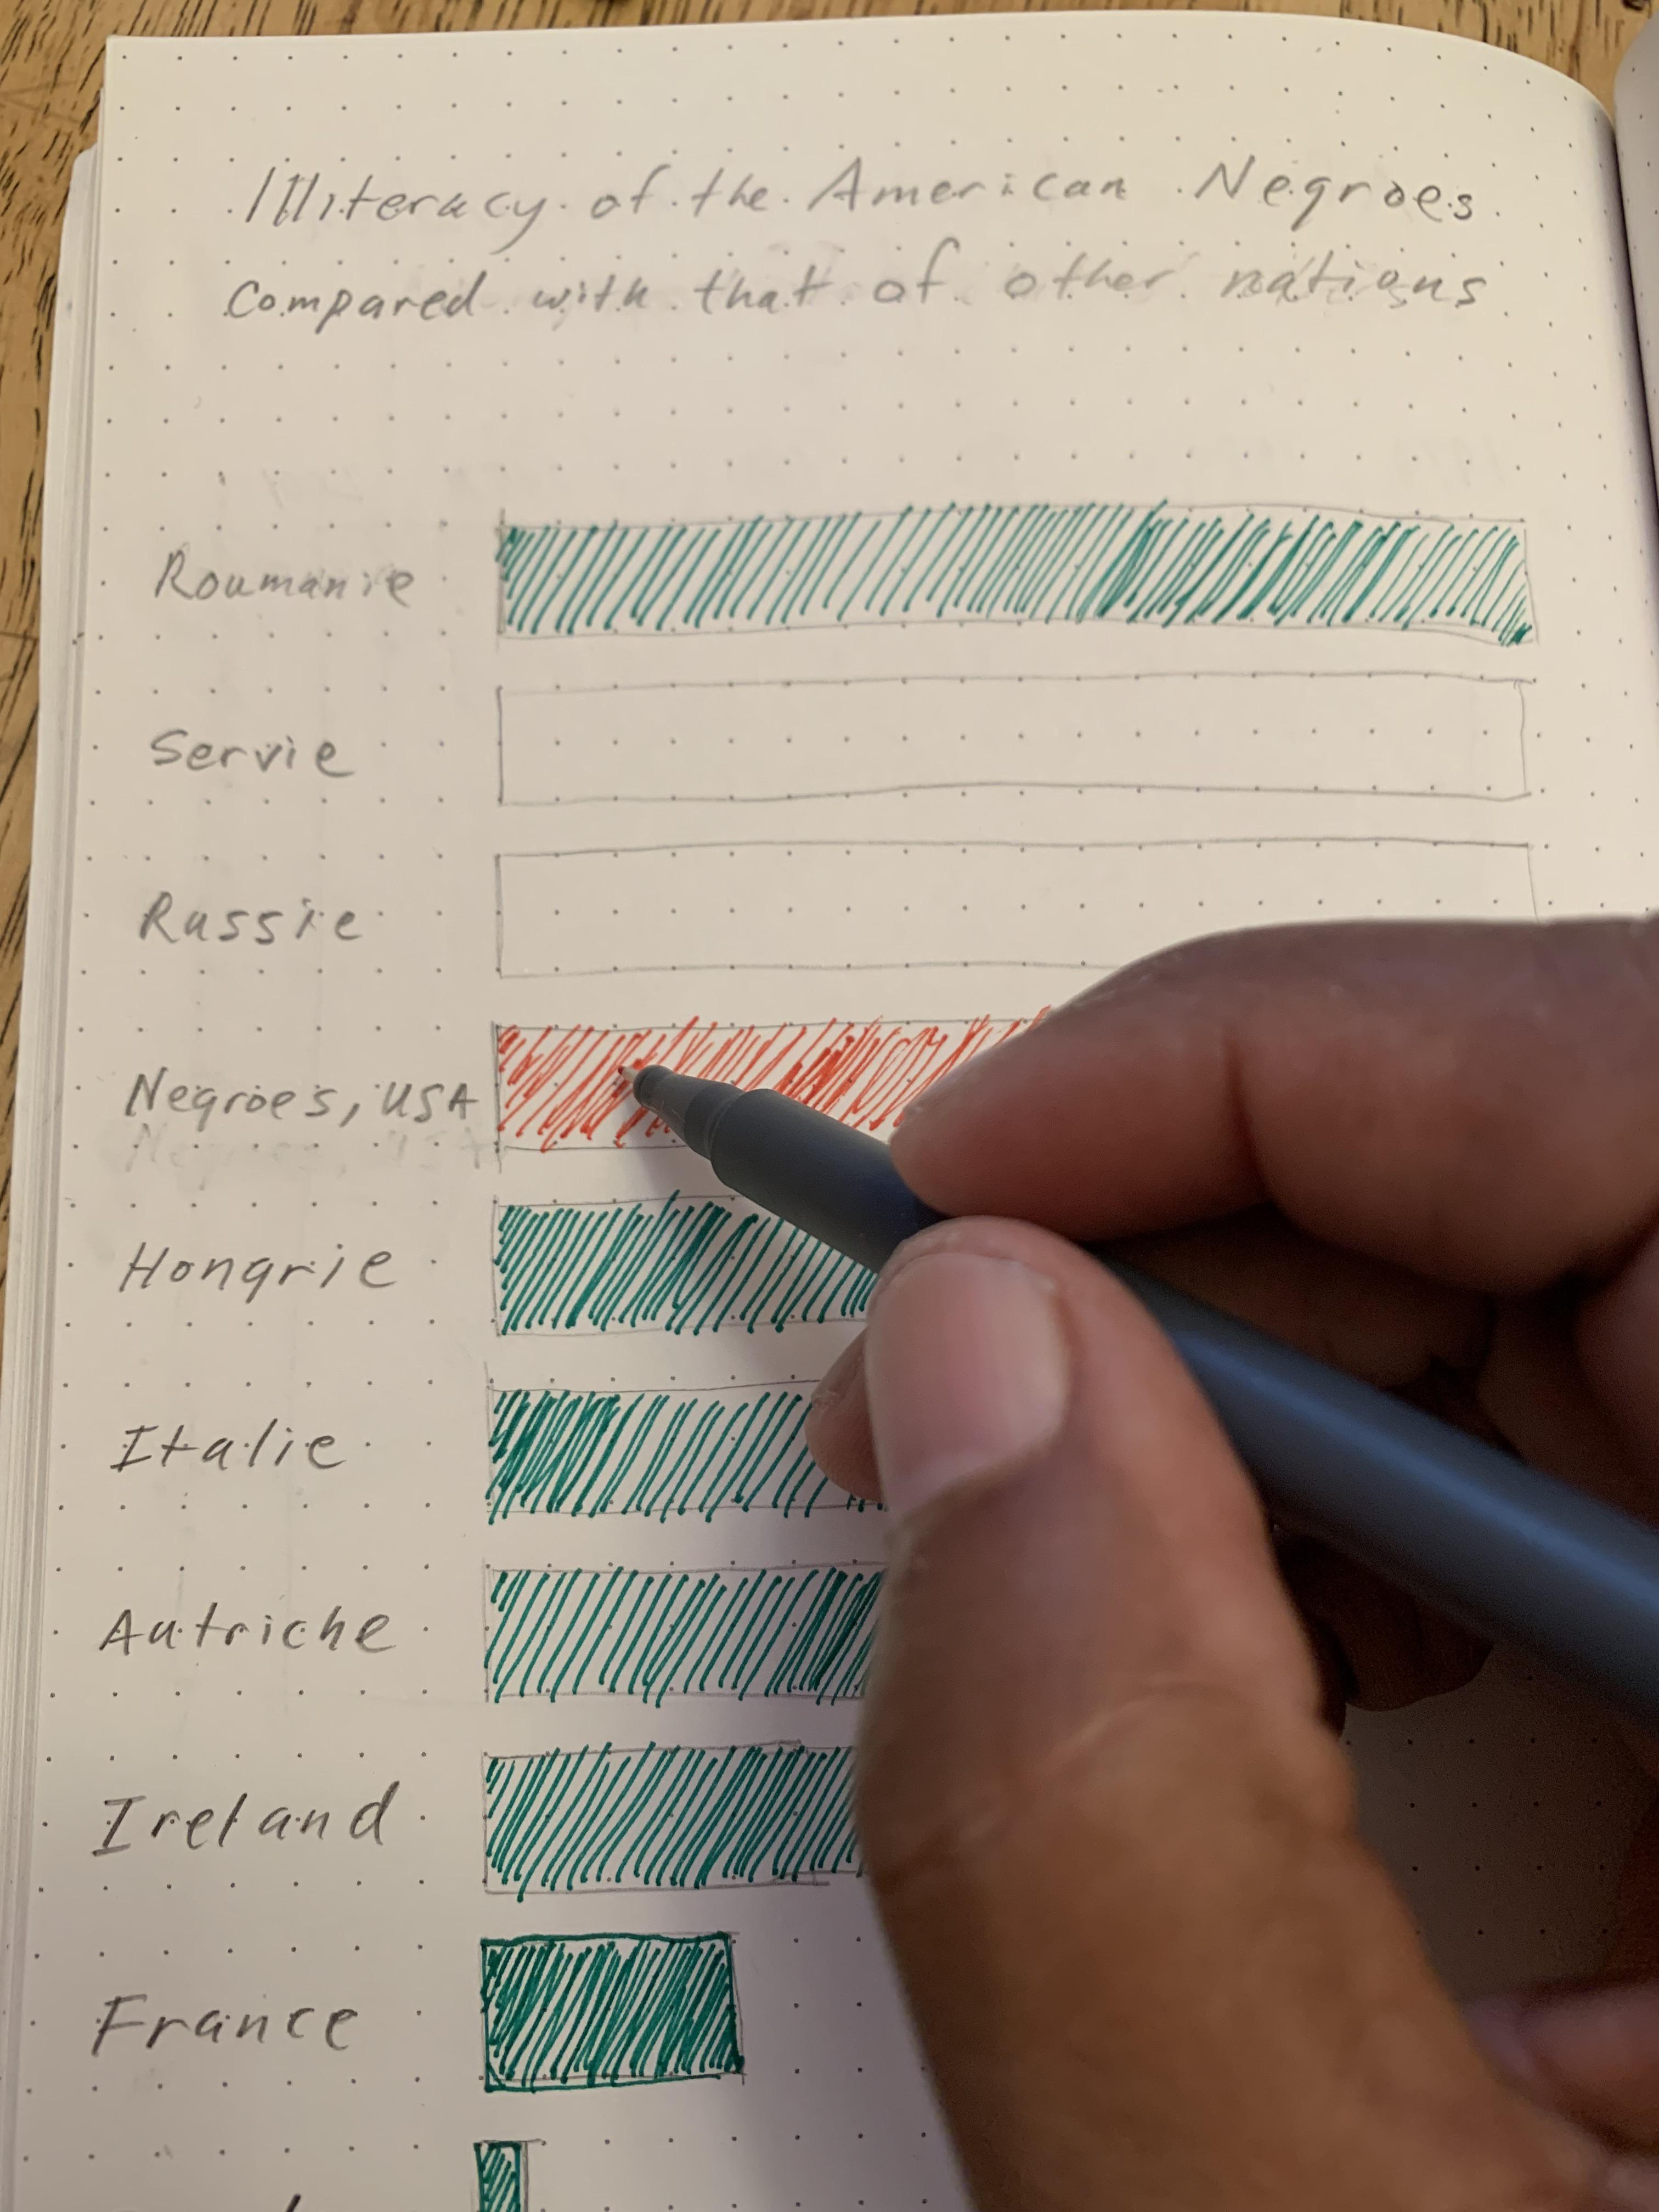
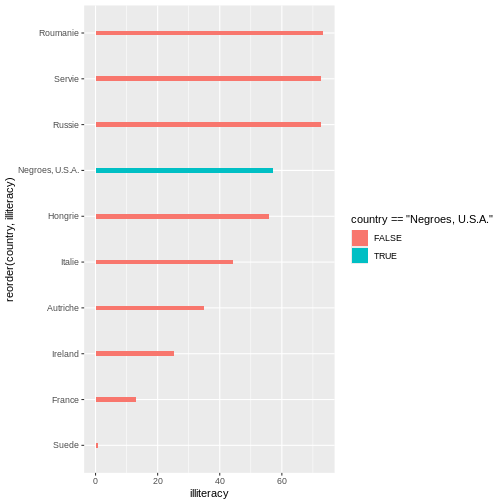
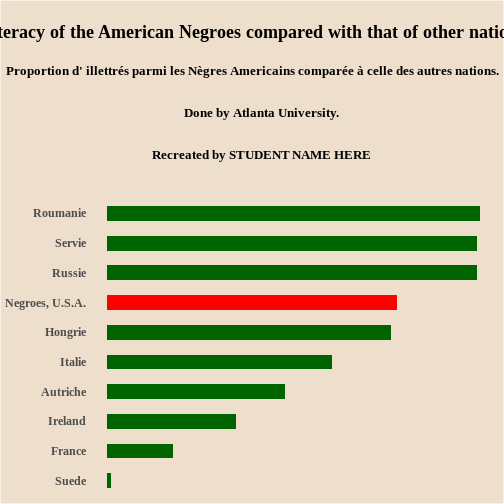
Illitercy
Figure 5
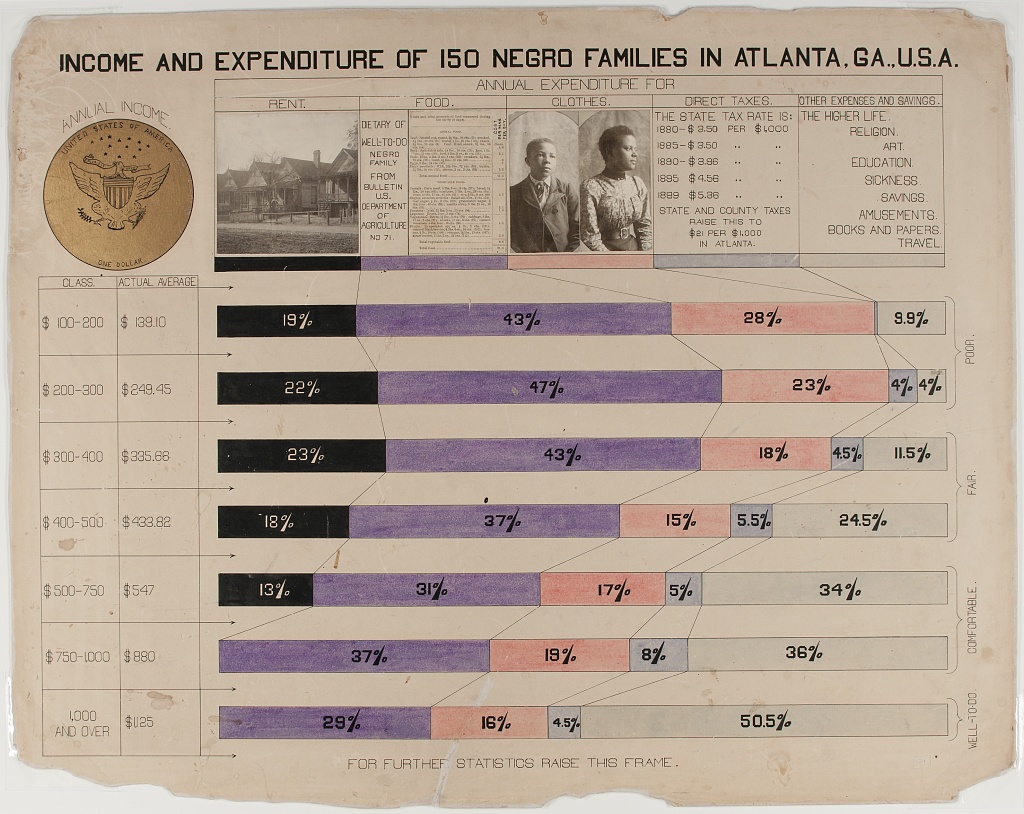
Income and Expenditure of 150 Negro Families in
Atlanta
Figure 6
Figure 7

Using R with R Studio
Figure 1

Figure 2

Figure 3

Figure 4

Reading and Interpreting STEM ChartsExample: Re-Create with Modern Data and Accessible Design
Figure 1
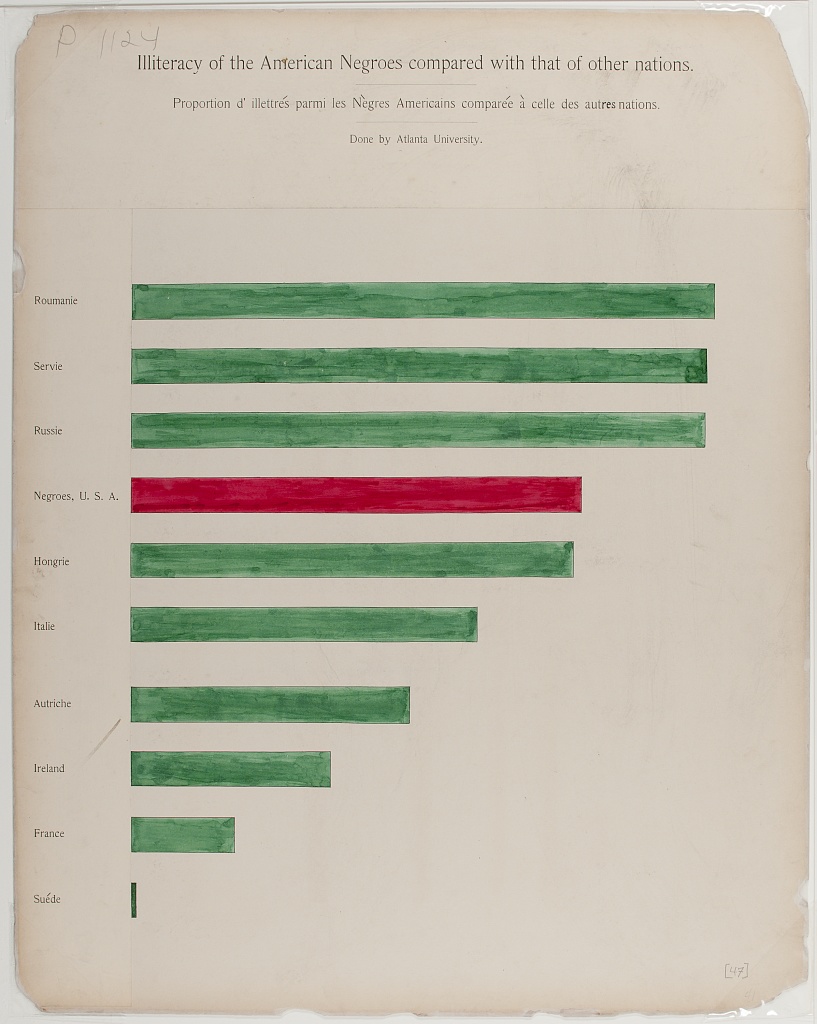
Figure 2
Figure 3
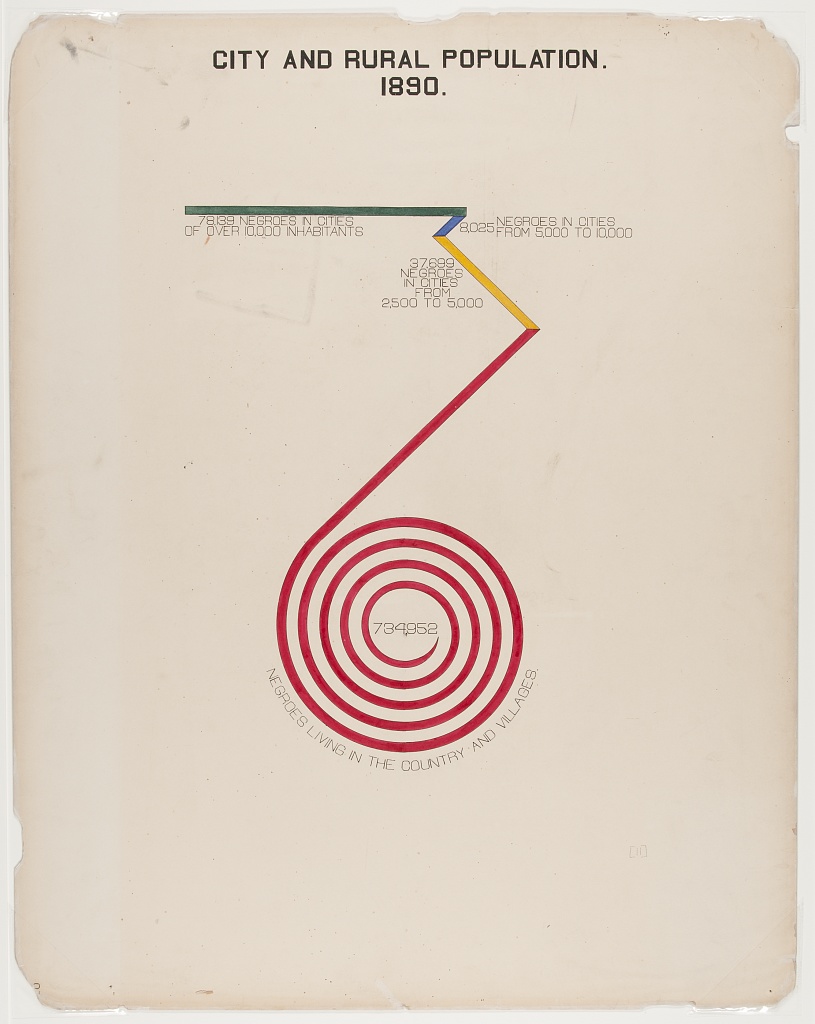


Figure 4
Figure 5
Figure 6
Figure 7
Figure 8
Figure 9
Figure 10

Figure 11
mod-data-chart
Recreate a Du Bois Bar Chart
Figure 1

Figure 2

Figure 3
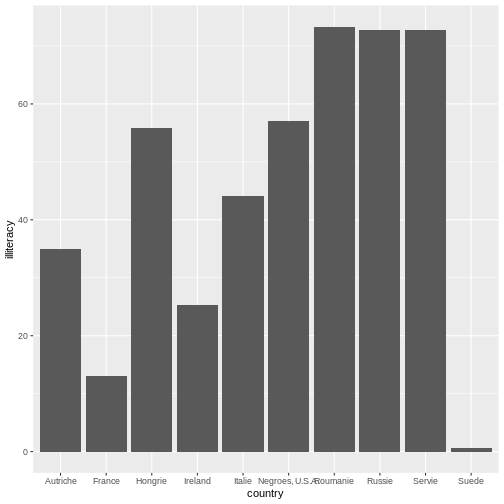
Figure 4
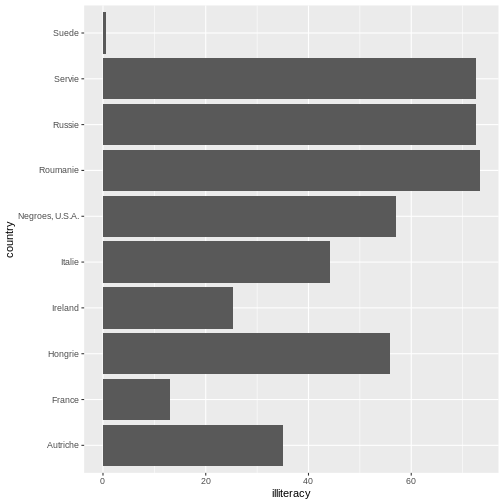
Figure 5
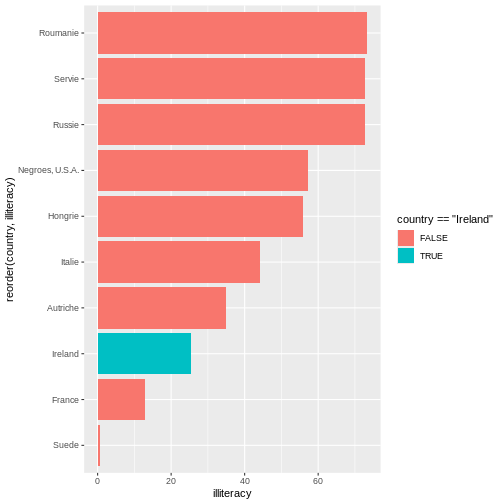
Figure 6
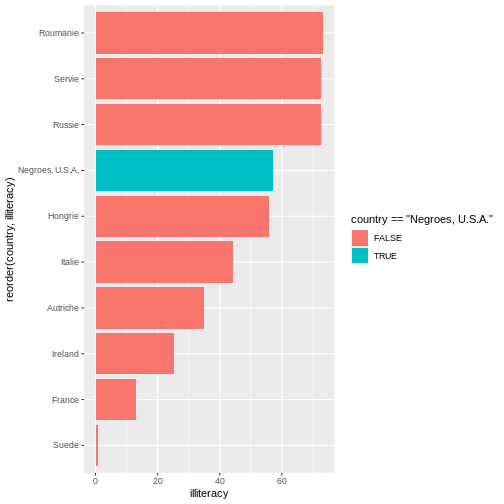
Figure 7
 Below is the code with width 1.
Figure 8
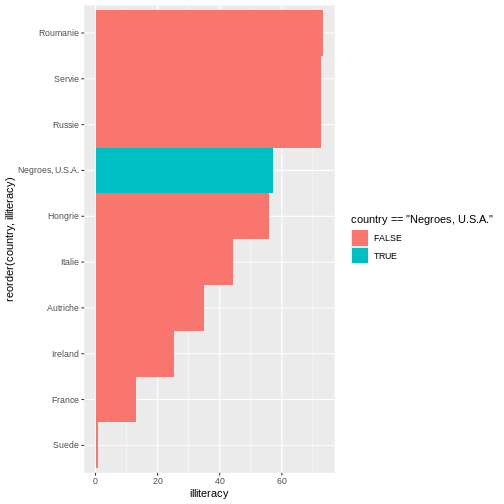
Figure 9
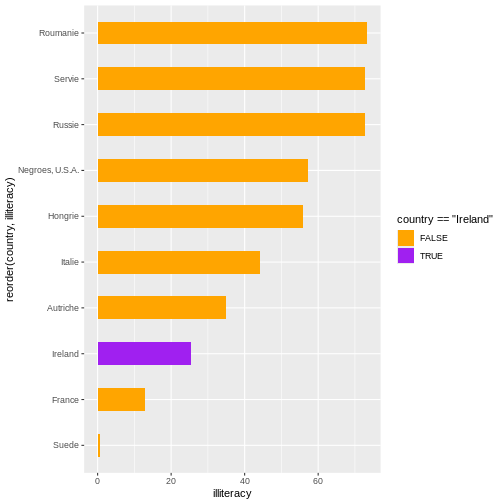
Figure 10
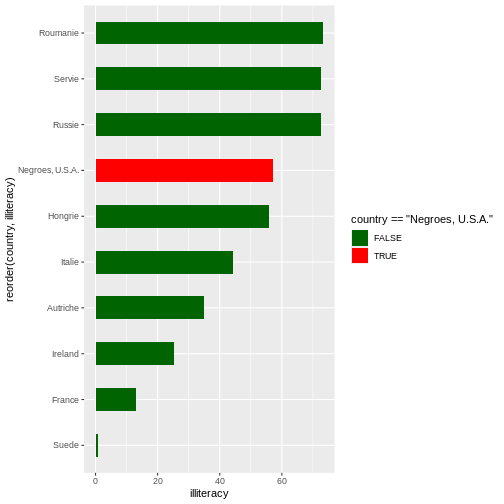
Figure 11
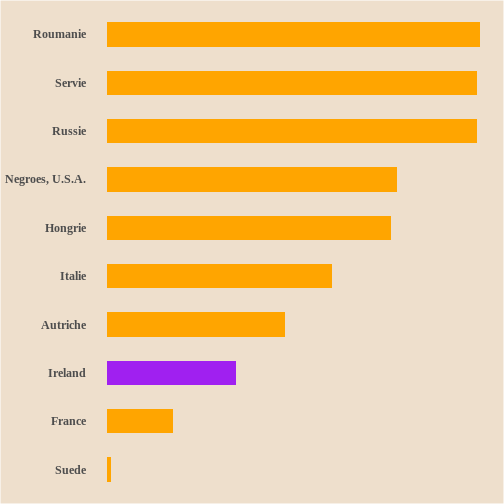
Figure 12
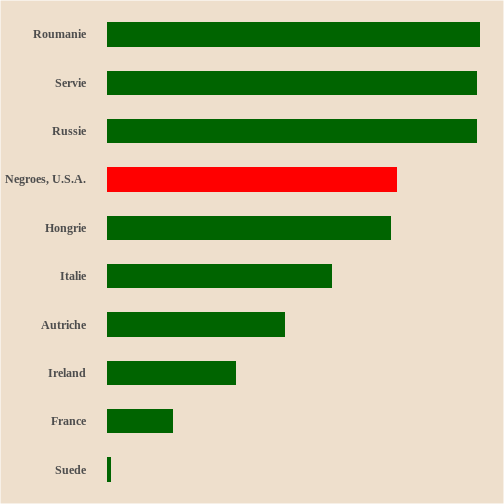
Figure 13
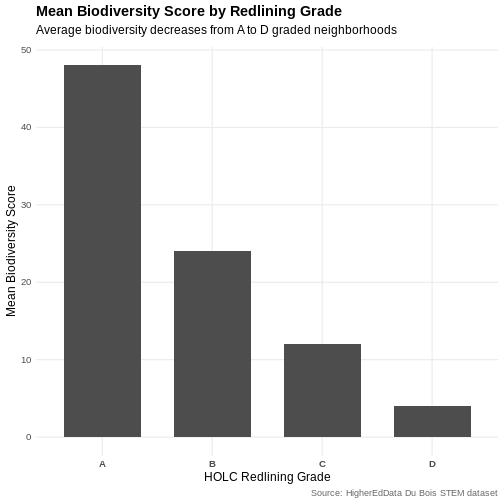
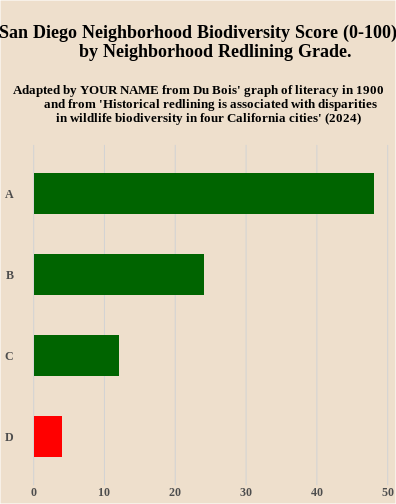
Adapt: Biodiversity and Redlining Bar Chart
Figure 1

Figure 2
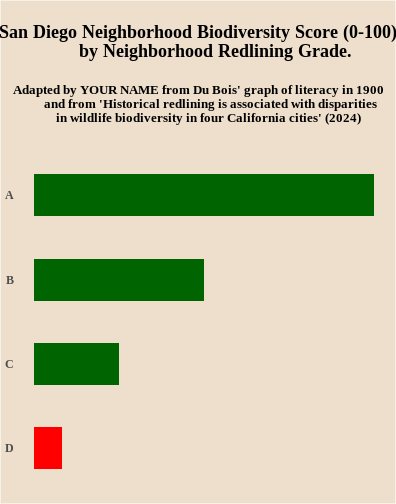
Figure 3
AI assisted plotting with R
Figure 1
Figure 2
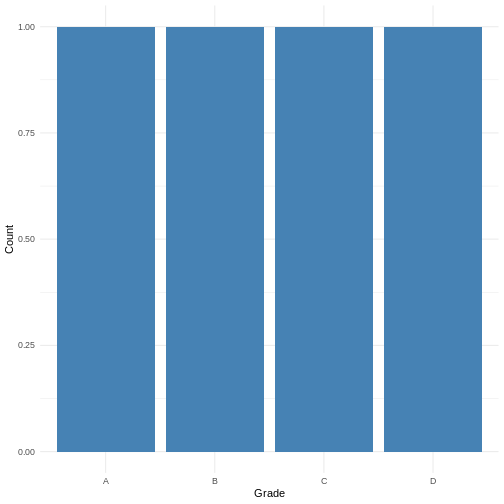
Figure 3
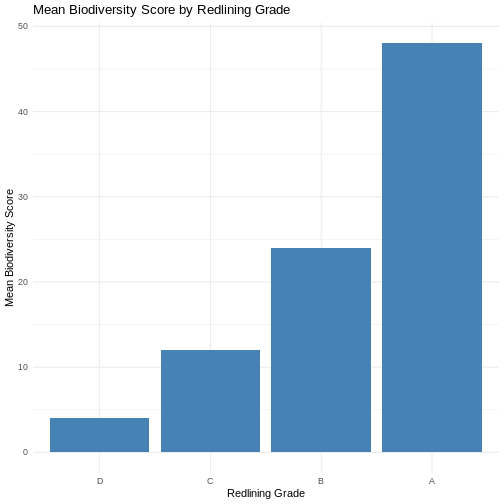
Figure 4
Click to see the commented code ChatGPT gave us back:
R
# load the tidyverse (includes ggplot2, dplyr, readr, etc.)
library(tidyverse)

# read the CSV file directly from the provided URL into a dataframe
df <- read.csv("https://raw.githubusercontent.com/HigherEdData/Du-Bois-STEM/main/data/d_biodiversity_redlining.csv")

# inspect the structure of the dataset to confirm column names and types
glimpse(df)
OUTPUT
Rows: 4
Columns: 2
$ grade        <chr> "A", "B", "C", "D"
$ biodiversity <int> 48, 24, 12, 4
R
# convert the grade column into an ordered factor so bars appear A → D
df <- df %>%
  mutate(
    grade = factor(grade, levels = c("A", "B", "C", "D"))
  )

# create the bar chart
df %>%
  ggplot(aes(
    x = grade,          # place redlining grade on the x-axis
    y = biodiversity    # use biodiversity values as bar height (mean scores)
  )) +
  geom_col(             # create bars with heights equal to y values
    fill = "steelblue"  # set bar color
  ) +
  labs(
    title = "Mean Biodiversity Score by Redlining Grade",  # chart title
    x = "Redlining Grade",                                 # x-axis label
    y = "Mean Biodiversity Score"                          # y-axis label
  ) +
  theme_minimal()      # apply a clean, minimal theme
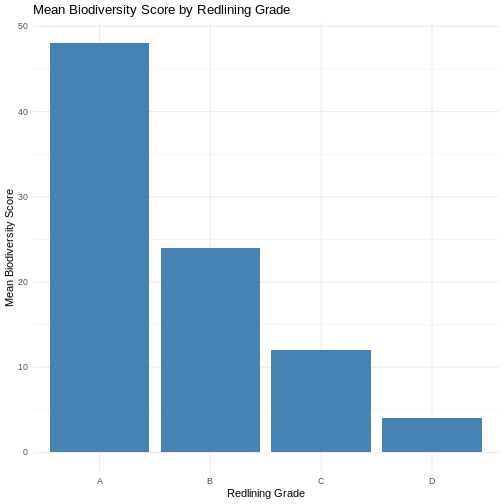
Figure 5
ChatGPT response authors got for Du Bois style:
Chat GPT really wants to put back in extraneous mutation code.
To get more Du Boisian, you would need to direct AI to make more changes like using horizontal bars and the tall poster aspect ratio of Du Bois’ original posters.
R
# load tidyverse
library(tidyverse)

# read data (use read_csv for tidyverse consistency)
df <- read.csv("https://raw.githubusercontent.com/HigherEdData/Du-Bois-STEM/main/data/d_biodiversity_redlining.csv")

# inspect structure
glimpse(df)
OUTPUT
Rows: 4
Columns: 2
$ grade        <chr> "A", "B", "C", "D"
$ biodiversity <int> 48, 24, 12, 4
R
# ensure grade is ordered
df <- df %>%
  mutate(grade = factor(grade, levels = c("A", "B", "C", "D")))

# summarize biodiversity by grade (important!)
summary_df <- df %>%
  group_by(grade) %>%
  summarize(mean_biodiversity = mean(biodiversity, na.rm = TRUE))

# Du Bois–style bar chart
ggplot(summary_df, aes(x = grade, y = mean_biodiversity, fill = grade)) +
  geom_col(
    width = 0.65,
    color = "black",
    linewidth = 1.2
  ) +
  geom_text(
    aes(label = round(mean_biodiversity, 1)),
    vjust = -0.6,
    family = "serif",
    size = 5
  ) +
  scale_fill_manual(values = c(
    "A" = "#2A9D8F",   # teal
    "B" = "#E9C46A",   # gold
    "C" = "#F4A261",   # orange
    "D" = "#E63946"    # red
  )) +
  labs(
    title = "Biodiversity by Redlining Grade",
    subtitle = "A Du Bois–Inspired Visualization",
    x = NULL,
    y = NULL
  ) +
  theme(
    # warm background (key Du Bois look)
    plot.background = element_rect(fill = "#F5E6C8", color = NA),
    panel.background = element_rect(fill = "#F5E6C8", color = NA),

    # remove gridlines completely
    panel.grid = element_blank(),

    # bold, centered titles
    plot.title = element_text(
      family = "serif",
      face = "bold",
      size = 20,
      hjust = 0.5
    ),
    plot.subtitle = element_text(
      family = "serif",
      size = 13,
      hjust = 0.5
    ),

    # x-axis styling (bold category labels)
    axis.text.x = element_text(
      family = "serif",
      face = "bold",
      size = 14
    ),

    # remove y-axis text/ticks for cleaner look
    axis.text.y = element_blank(),
    axis.ticks = element_blank(),

    # emphasize baseline only
    axis.line.x = element_line(color = "black", linewidth = 1.2),

    # remove legend (color already encoded in x)
    legend.position = "none"
  )
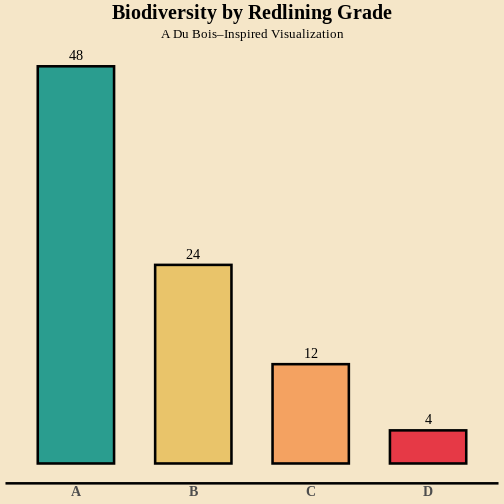
Figure 6