All Images

Introduction


Figure 1

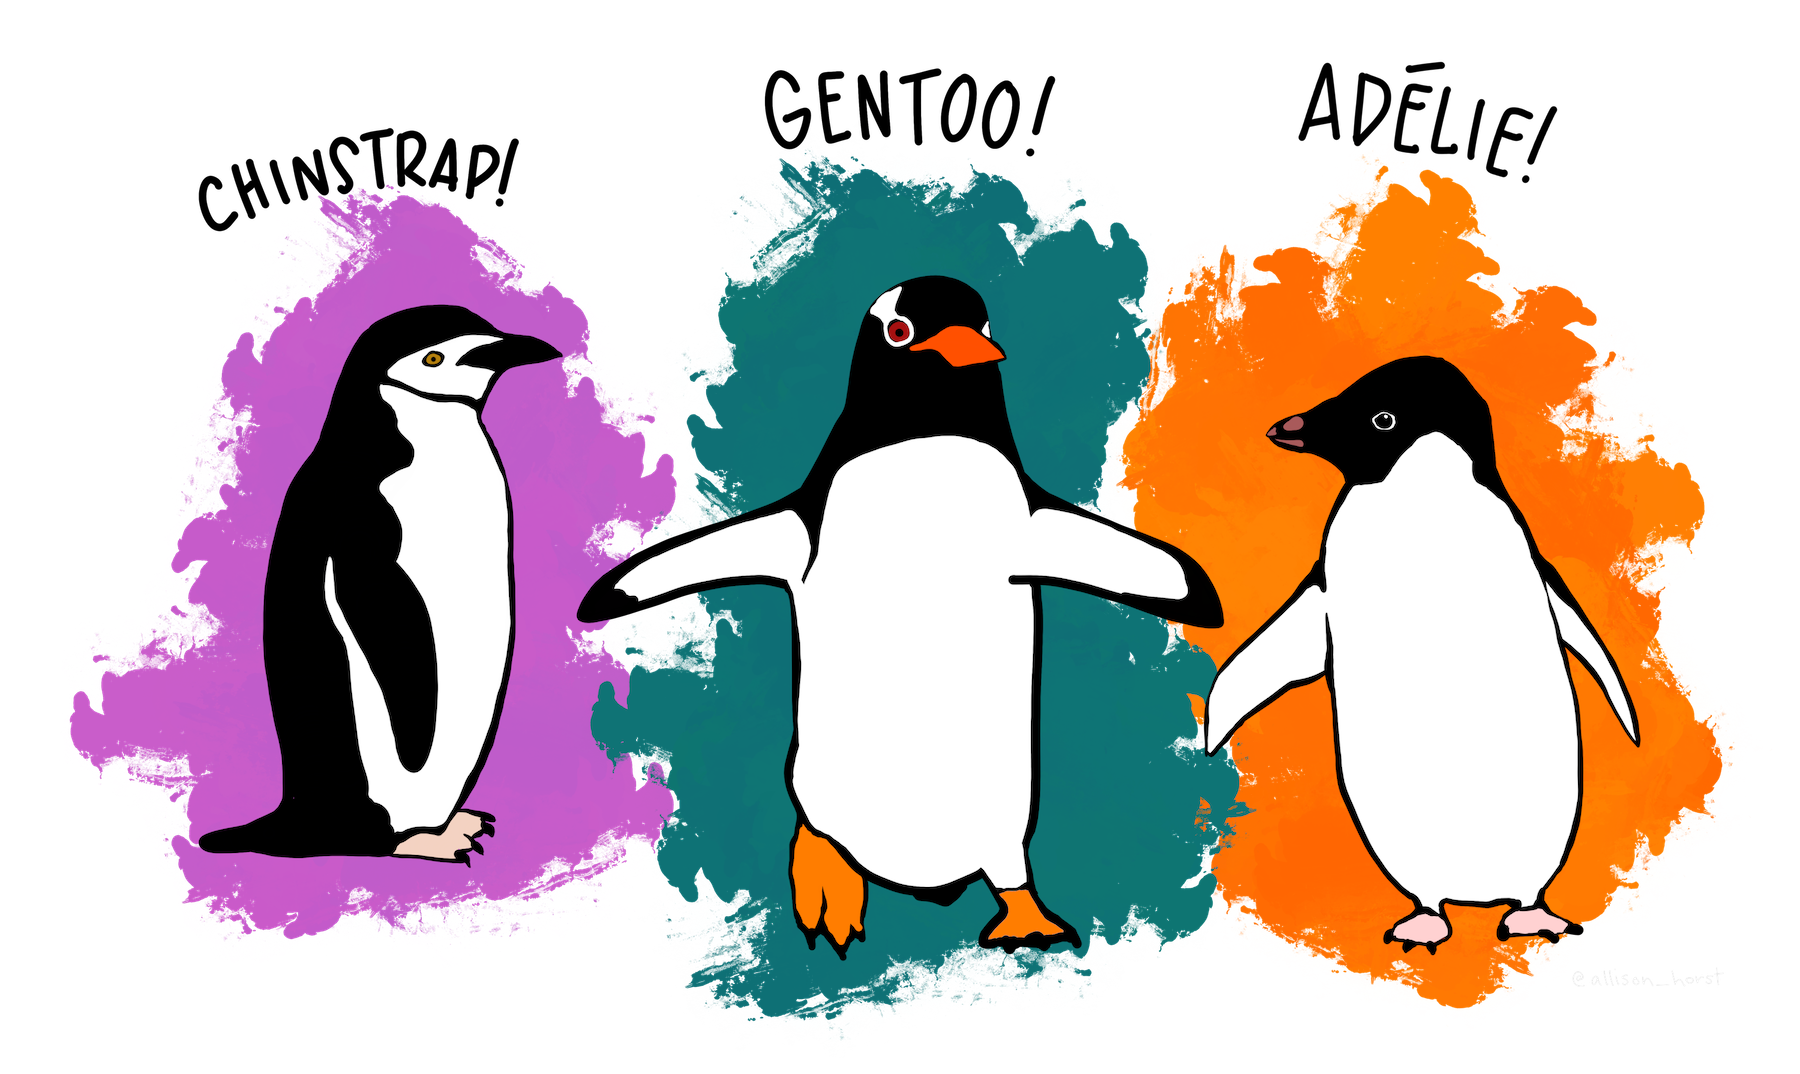
Illustration of three penguins side by side, each in front of a splash of color: a Chinstrap penguin seen from the side on the left, a Gentoo penguin with its flippers spread in the middle, and an Adélie penguin on the right.
The three species of penguins in the penguins dataset. Artwork by @allison_horst.

First targets Workflow


Figure 1

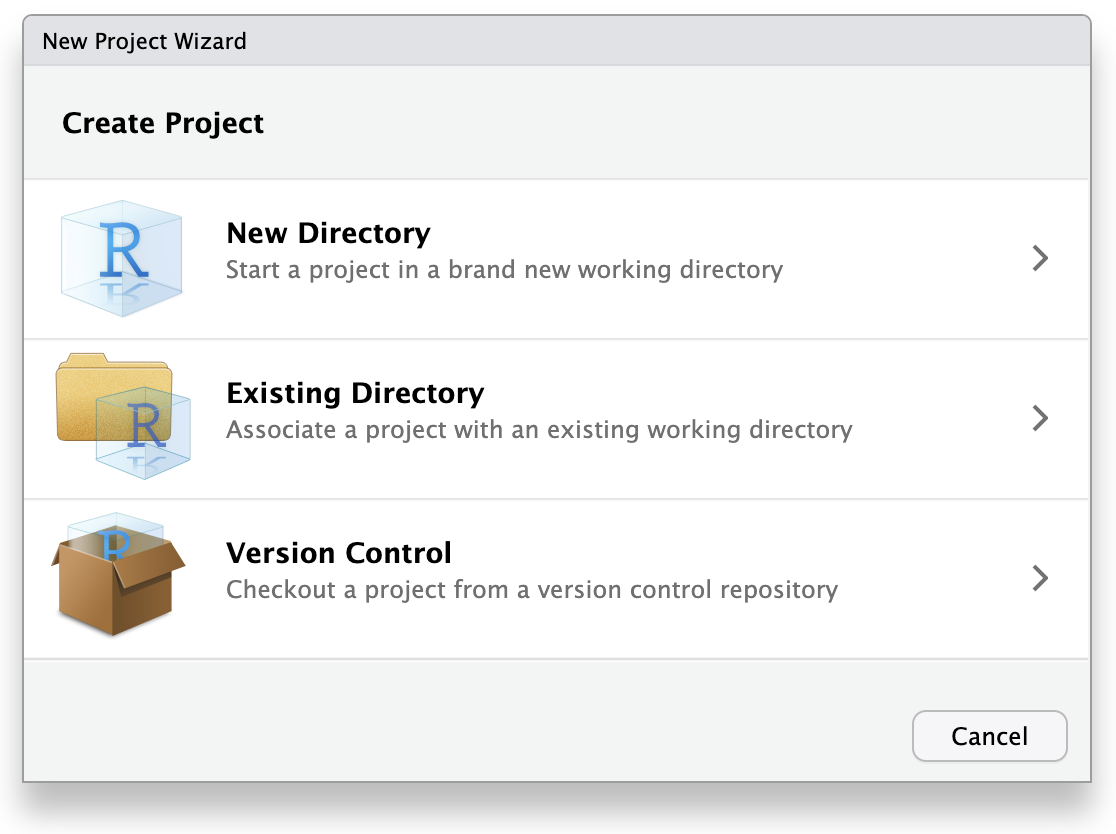
Screenshot of RStudio New Project Wizard menu
The New Project Wizard

Figure 2

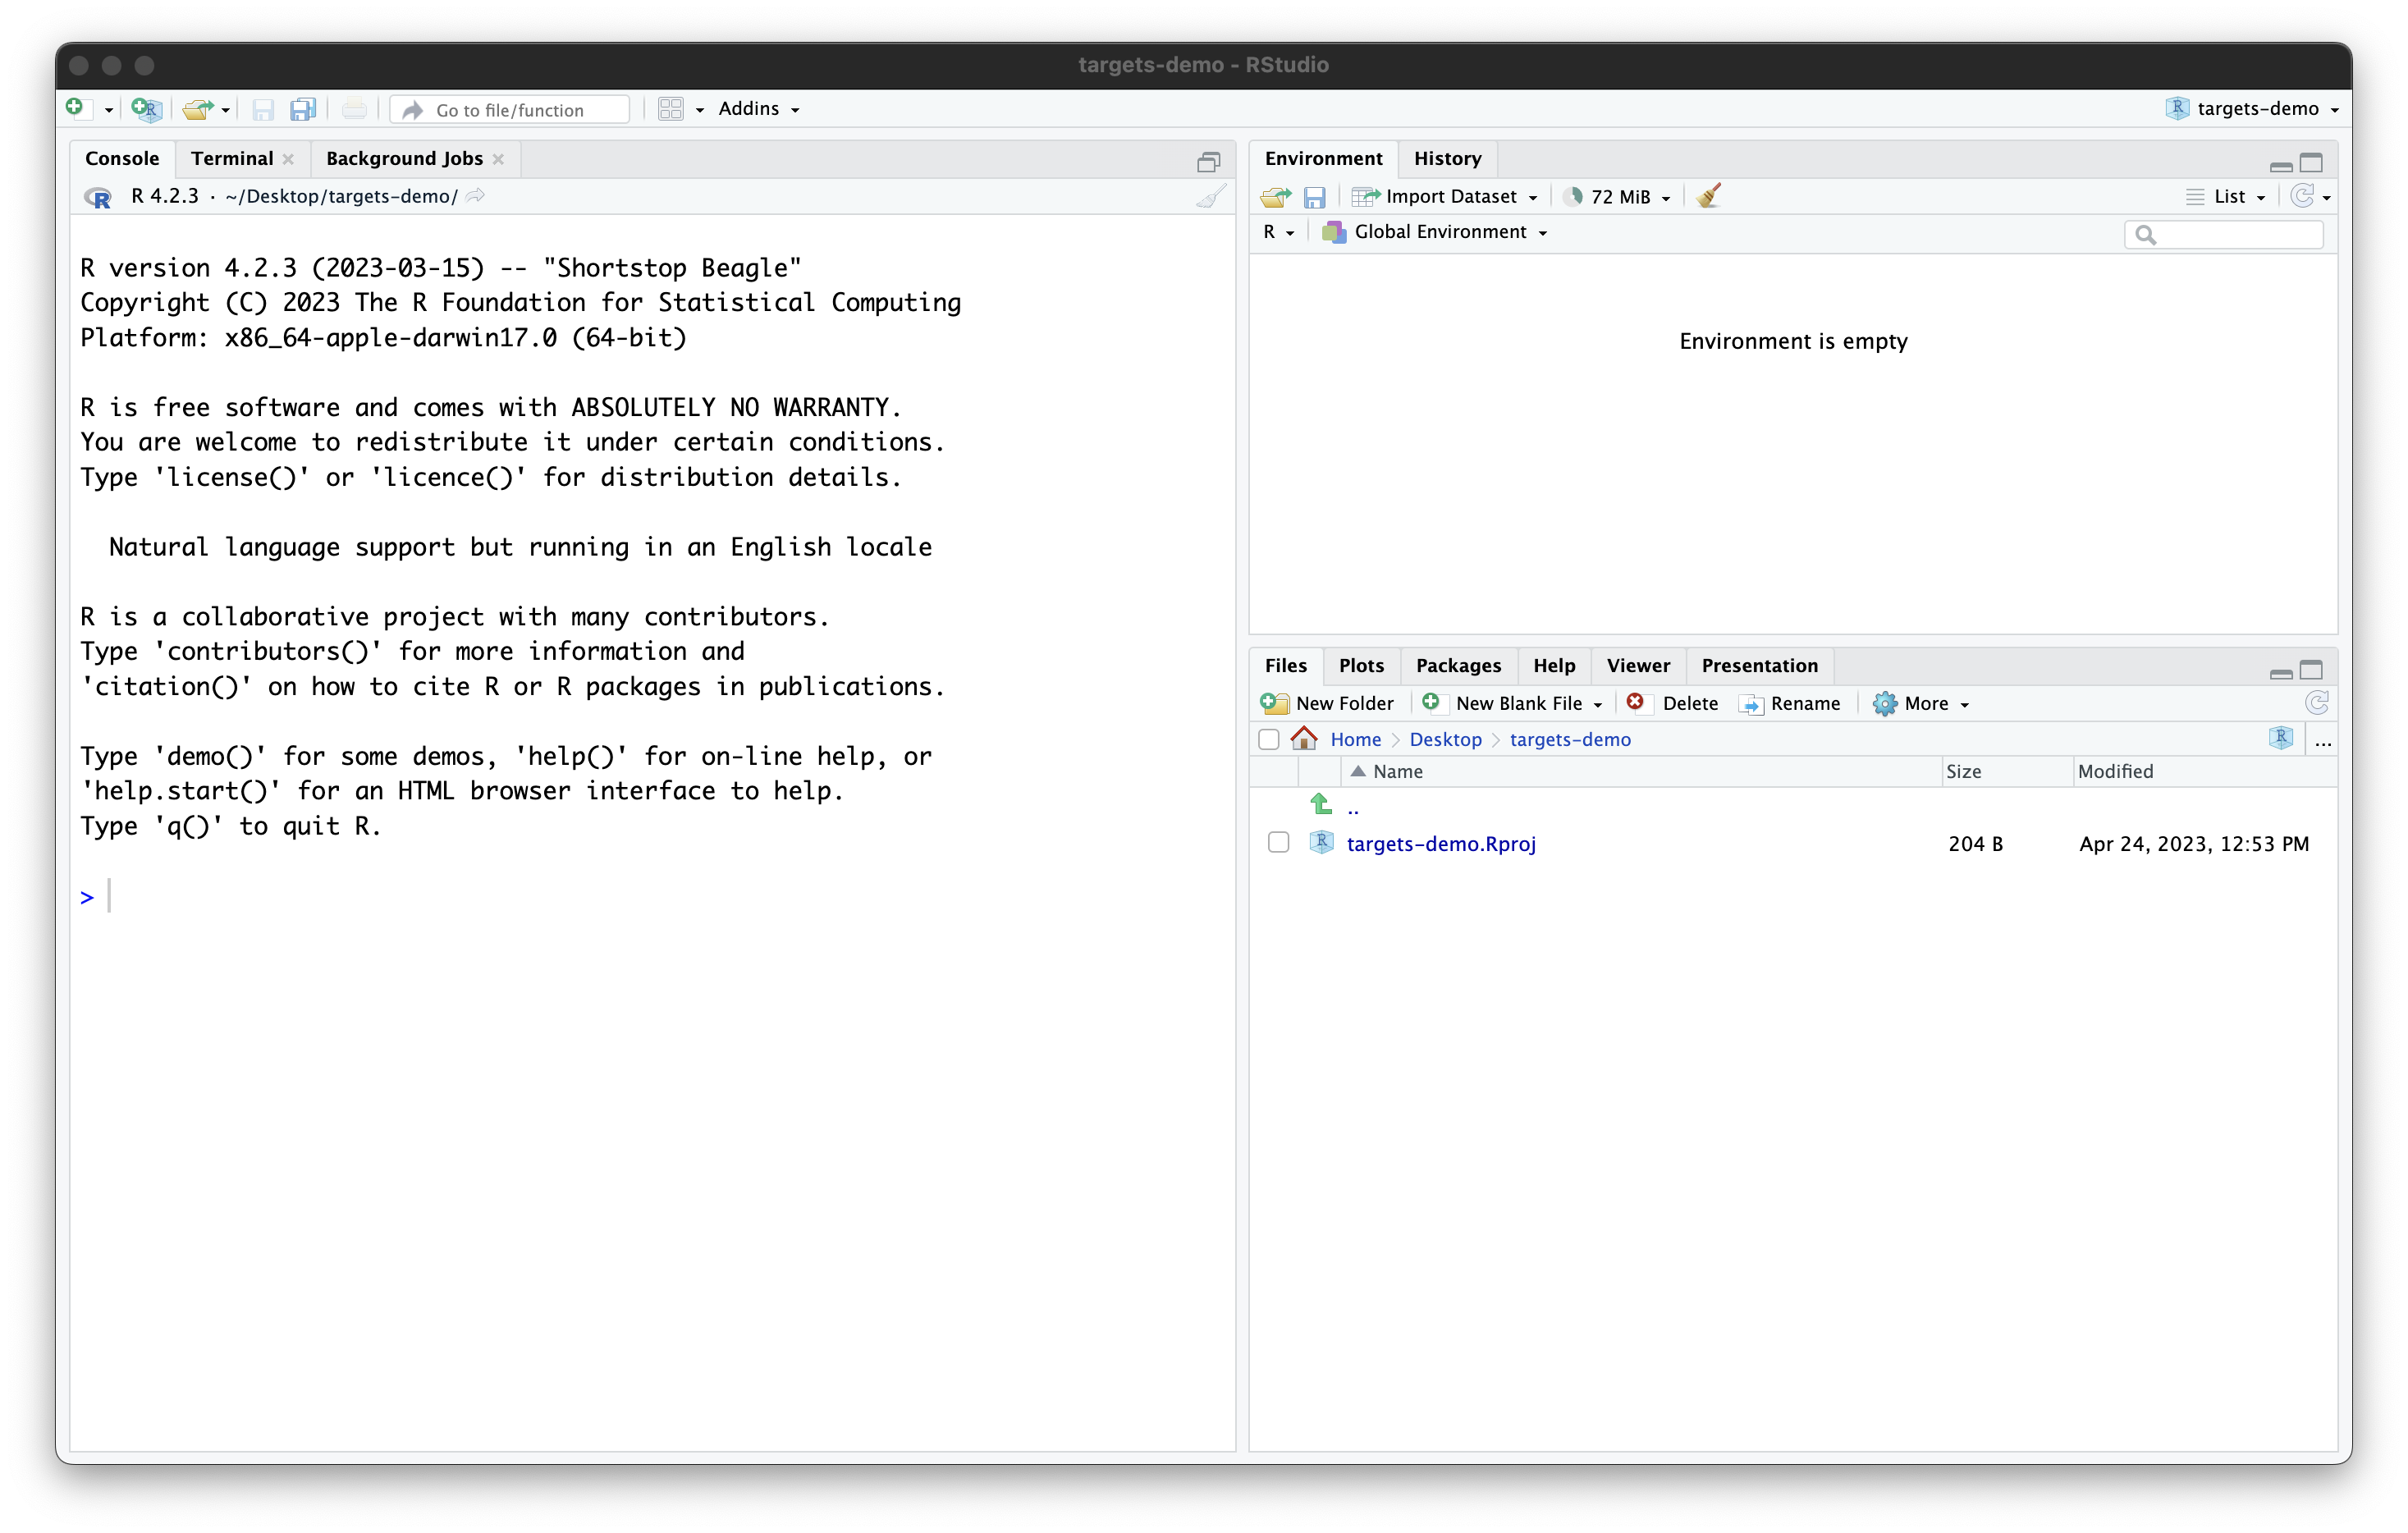
Screenshot of RStudio with a newly created project called 'targets-demo' open containing a single file, 'targets-demo.Rproj'
Your newly created project

Figure 3

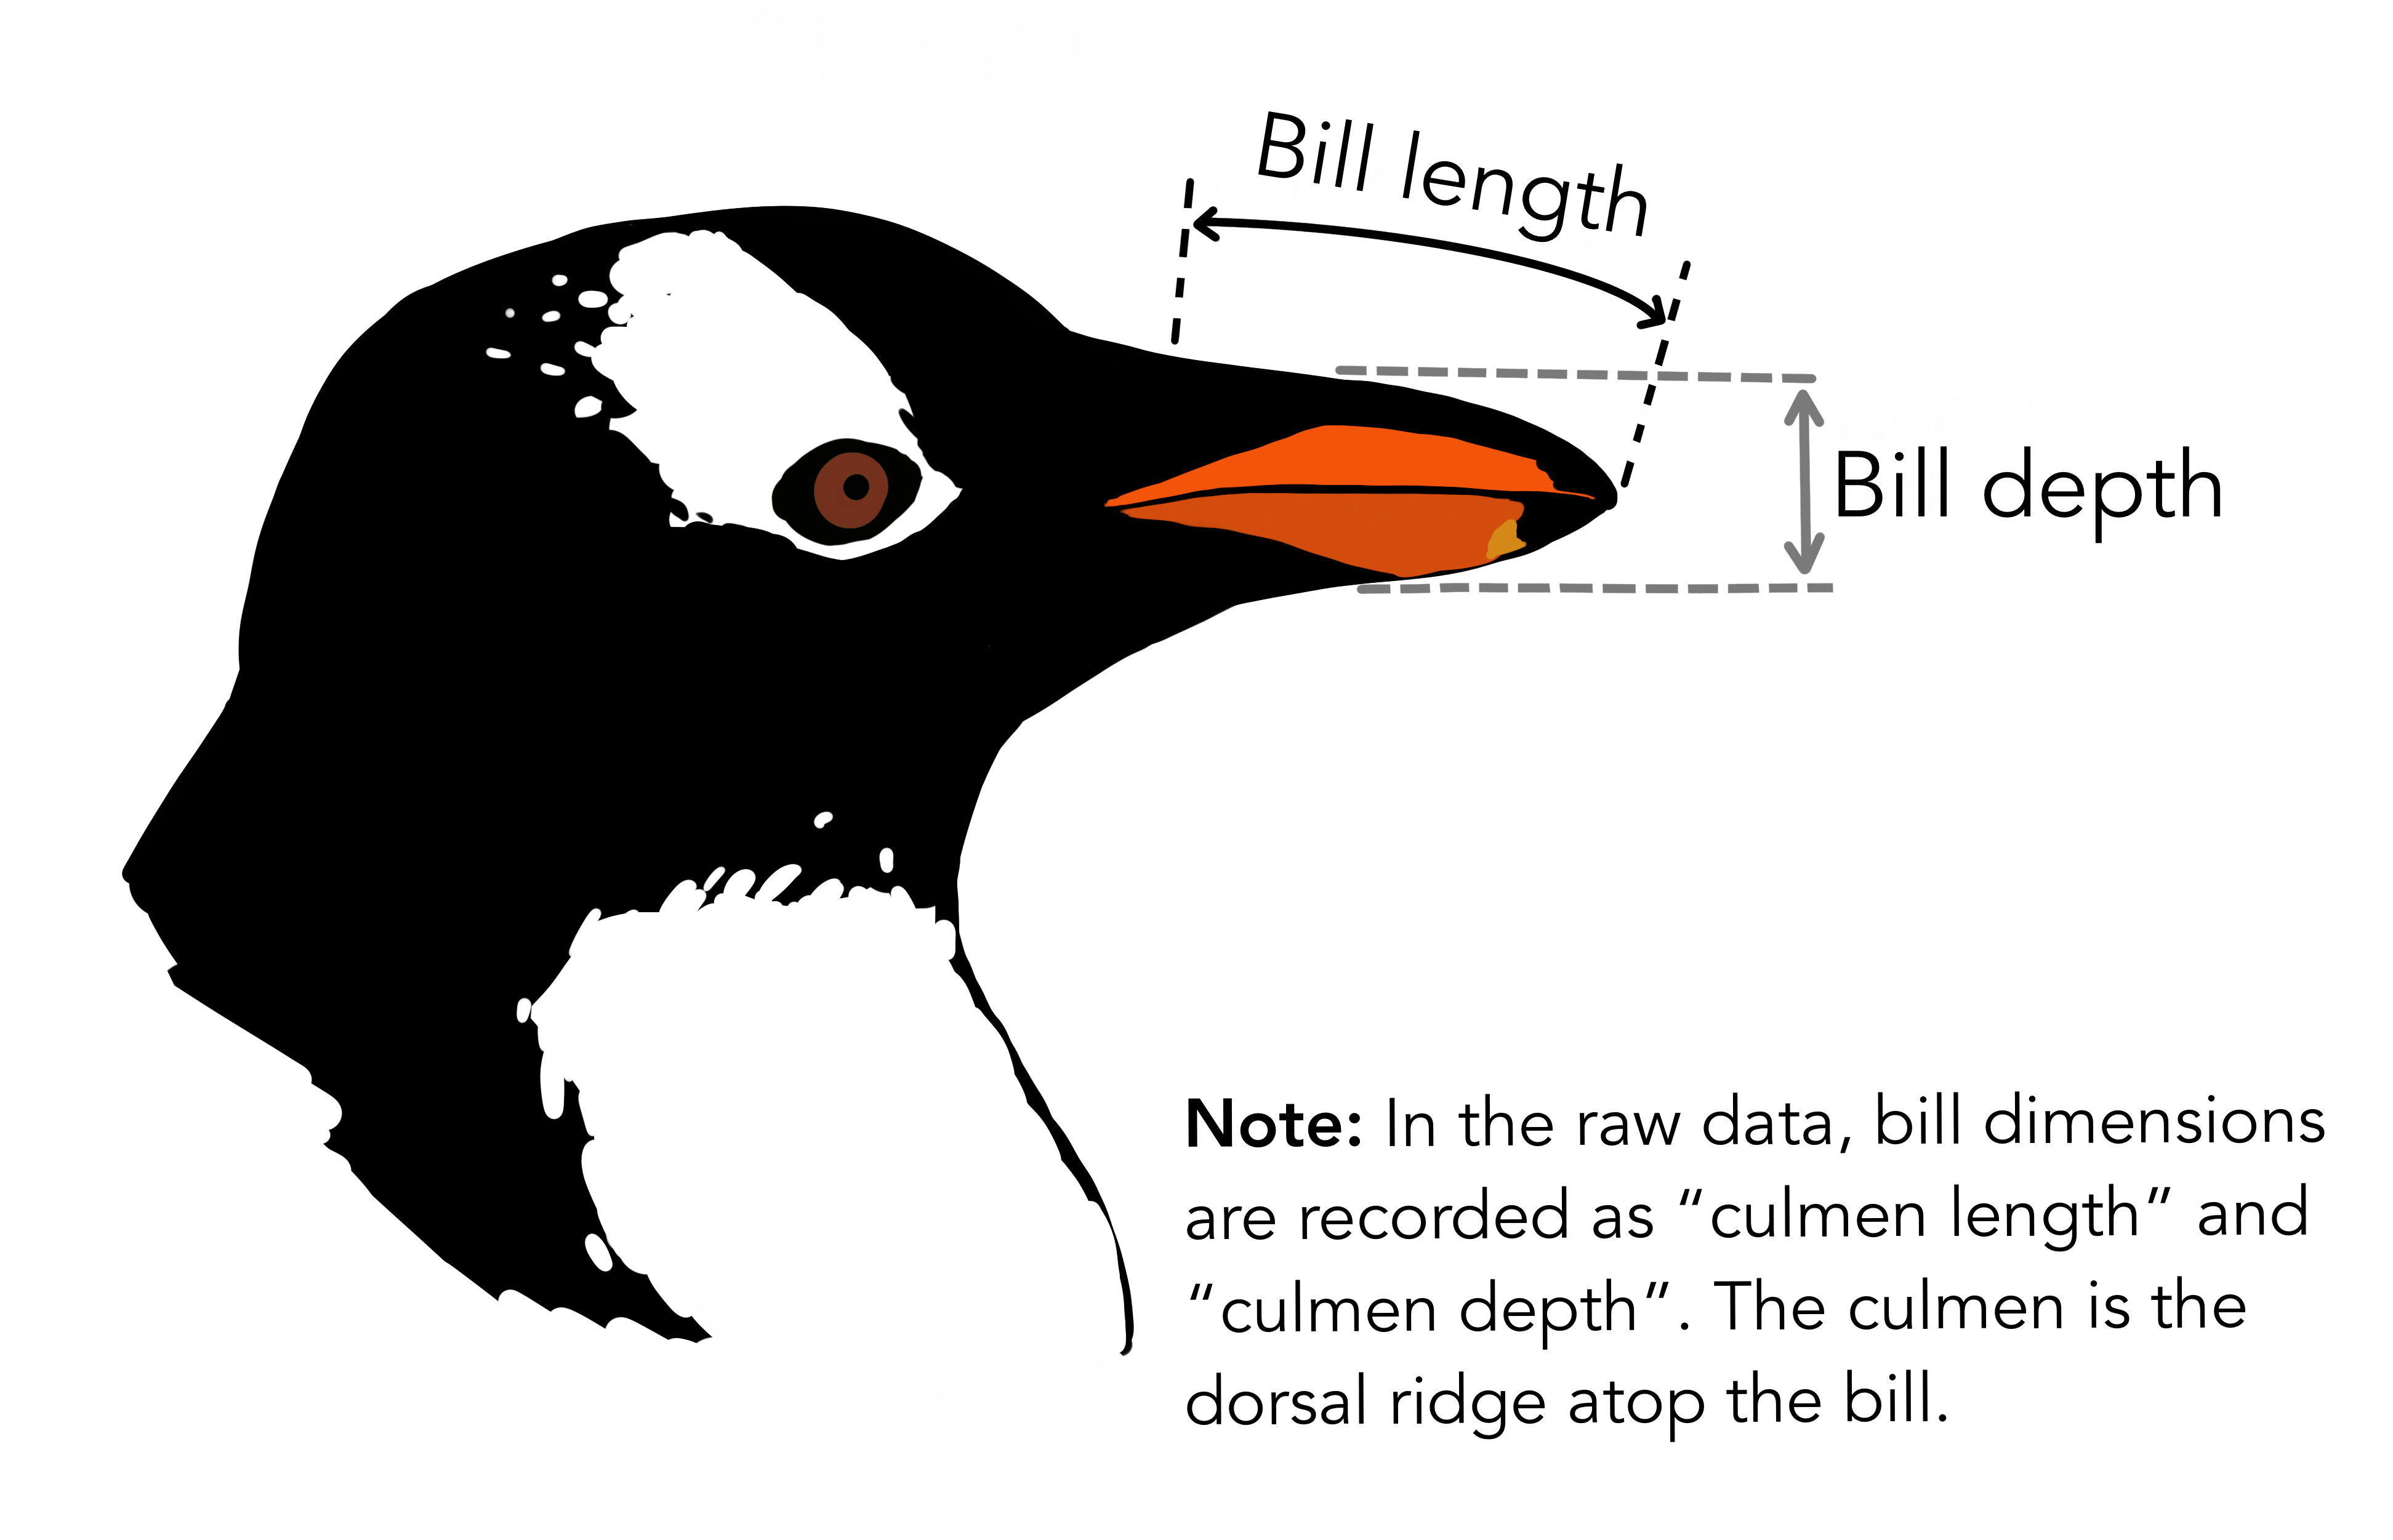
Illustration of a penguin's head from the side. Arrows show that bill length is measured along the top of the bill from its base to its tip, and bill depth is the thickness of the bill. A note says that in the raw data these are recorded as culmen length and culmen depth, and that the culmen is the dorsal ridge atop the bill.
Illustration of bill (culmen) length and depth. Artwork by @allison_horst.

A Brief Introduction to Functions


Loading Workflow Objects


The Workflow Lifecycle


Figure 1
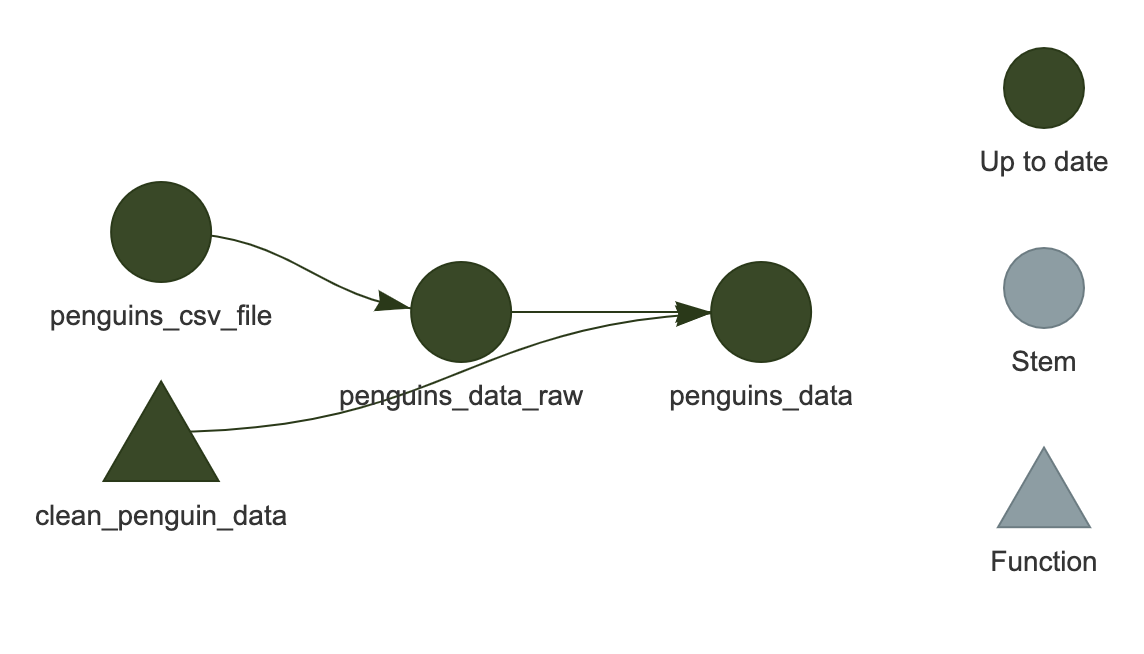
Visualization of the targets worklow, showing 'penguins_data' connected by lines to 'penguins_data_raw', 'penguins_csv_file' and 'clean_penguin_data'

Best Practices for targets Project Organization


Managing Packages


Branching


Parallel Processing


Working with External Files


Reproducible Reports with Quarto


Figure 1
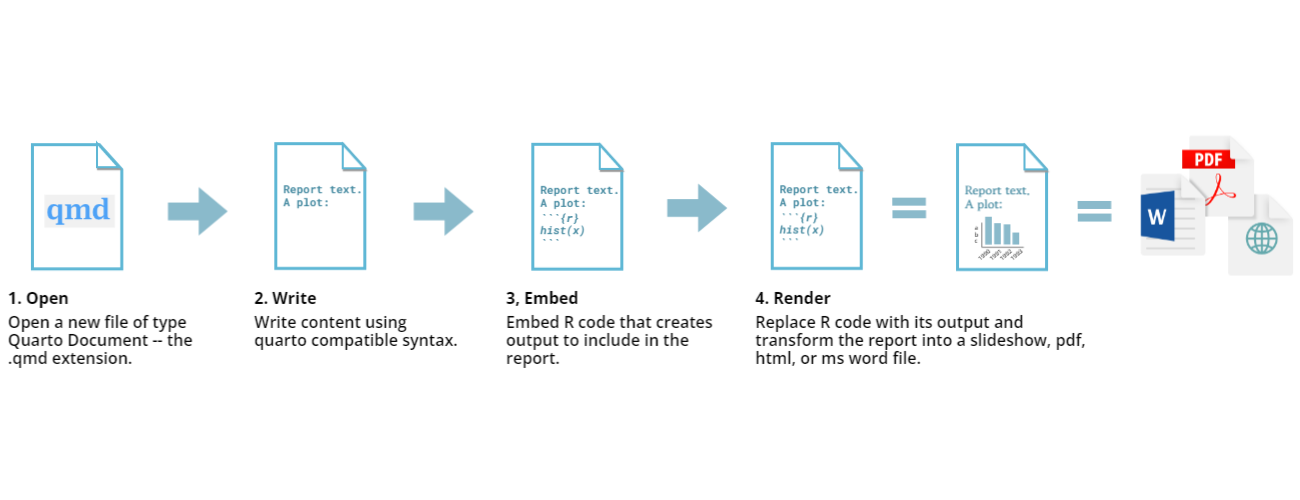
Quarto workflow
Quarto workflow