Introduction to quantitative proteomics data
Overview
Teaching: 15 min
Exercises: 0 minQuestions
What data do we have?
What analyses can we apply?
How can we check the data throughout the analysis?
Objectives
Understand proteomics data set.
Understand what data cleaning we need to do.
Understand what data analysis we can do.
Data
-
The data we are going to use are part of a study of the Clinical Proteomic Technology Assessment for Cancer CPTAC led by Amanda Paulovich.
-
In the experiment, the authors spiked the Sigma Universal Protein Standard mixture 1 (UPS1) containing 48 different human proteins in a protein background of 60 ng/μL S. cerevisiae strain BY4741. Two different spike-in concentrations were used: 6A (0.25 fmol UPS1 proteins/μL) and 6B (0.74 fmol UPS1 proteins/μL).
-
The data were searched with MaxQuant version 1.5.2.8, and detailed search settings were described by Goeminne et al.
-
Three replicates are available for each concentration. The study is a spike-in study for which we know the ground truth.
Read data
To read and instepct the peptides.txt file we will use the package readr, which is bundled within the tidyverse package. Please load the tidyverse if not already done. :
library("tidyverse")
f <- readr::read_delim("https://raw.githubusercontent.com/lgatto/bioc-ms-prot/master/data/cptac_peptides.txt",delim="\t")

## explore
head(f)
Quantitative information
Quantitative information is contained in the columns that have “Intensity” tag. We can see which columns have quantitative information.
(i <- grep("Intensity.", names(f))) # 56 57 58 59 60 61
Your turn
Exercise
Subtract peptide names and intensity values from
f.Solution
f[,c(1,i)]
Key Points
It’s important to understand your proteomics data.
Identifying the anatomy of SummarizedExperiment and QFeatures objects
Overview
Teaching: 30 min
Exercises: 20 minQuestions
How do SummarizedExperiment and QFeatures objects look like?
Objectives
Recognize the anatomy of SummarizedExperiment and QFeatures objects.
Execute common operations on SummarizedExperiment and QFeatures objects.
Anatomy of a SummarizedExperiment object
These are the component pieces of the SummarizedExperiment for data representation.
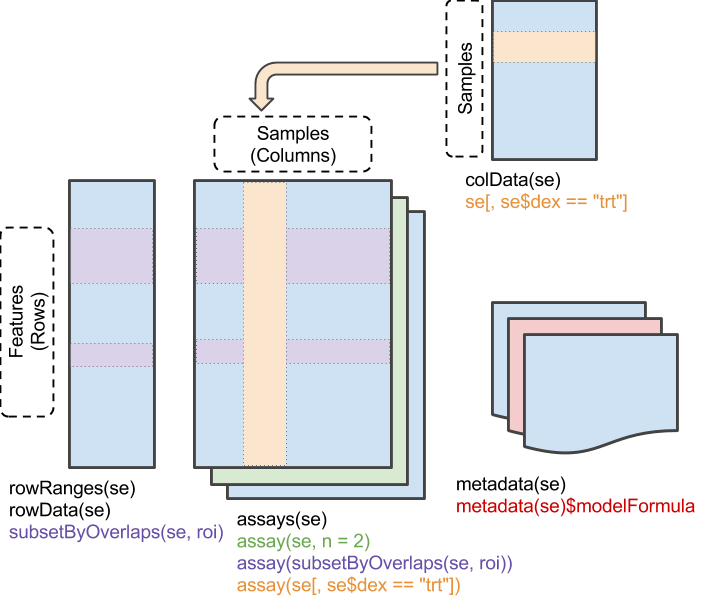
We can access different levels of information of a SummarizedExperiment object using the following functions:
- assay(): A matrix-like or list of matrix-like objects of identical dimension
- colData(): Annotations on each column, as a DataFrame.
- rowData(): Annotations on each row.
Anatomy of a QFeatures object
QFeatures objects form QFeatures package are based on the SummarizedExperiment and MultiAssayExperiment classes and provides infrastructure to manage and analyse quantitative features from mass spectrometry experiments. It follows a hierarchical structure: spectra (first column in the picture) compose peptides (second column in the picture) which in turn compose proteins (third column in the picture). The main advantage of this structure is that is very easy to navigate across spectra, peptide and protein quantitative data.
Example:
We can load a simplify example feat1 data, which is composed of single assay of class SummarizedExperiment composed of 10 rows and 2
columns.
library("QFeatures")
data(feat1)
feat1
Similarly to what we have done for SummarizedExperiment object , we can extract information from QFeatures
colData(feat1)
assay(feat1[[1]])
rowData(feat1[[1]])
Key Points
Importing txt into Qfeatures
Overview
Teaching: 15 min
Exercises: 0 minQuestions
How can we import txt file into QFeatures object?
How can we add metadata to QFeatures?
How can we inspect QFeatures features?
Objectives
Import MaxQuant peptides.txt file into QFeatures object.
Inspect QFeatures features.
Read peptide file into QFeatures
We can use the readQFeatures function from QFeatures package to import f data.frame that we read into R before. We also need to provide the position i where our quantitative Intensity columns live. We can name this new QFeatures object cptac.
library("QFeatures")
cptac <- readQFeatures(f, ecol = i, sep = "\t", name = "peptides", fnames = "Sequence")
Exercise
Use the
colDatafunction to see description of each sample fromcptacSolution
colData(cptac)
Encode the experimental design in QFeatures
We can update the sample (column) annotations to encode the two groups, 6A and 6B, and the original sample numbers.
ptac$group <- rep(c("6A", "6B"), each = 3)
cptac$sample <- rep(7:9, 2)
colData(cptac)
Get metadata information of QFeatures
We can get metadata information of QFeatures
rowData(cptac)
We can use the assay function to get a matrix-like cptac
library("magrittr")
assay(cptac) %>% head(2)
Key Points
Functions from QFeatures and SummarizeExperiment packages allow to do these steps seamlessly.