Details on spreadsheets design
Last updated on 2023-09-06 | Edit this page
Information in tables
Information can usually be stored in a triplet: subject, object and
their relation. This triplet is often best represented in a table, as
they are easy to fill. Such tables are often used to collect data, or at
least metadata of an experiment. For example, in the BIDS standard, the
participants.tsv file is a spreadsheets collecting
information about all subjects of an experiment.
| subjects | relation |
|---|---|
| subject 1 | object |
example:
| subjects | eye_color |
|---|---|
| Bob | blue |
NB: the .csv version of the table above will be:
subjects,eye_color
Bob,blue
The design of the table will depend on the type of analysis you will do. Spreadsheets are a way to create tables, One should always have only one table in one sheet, computers have difficulties to separate tables that are on the same sheet.
When planning to collect data in tables by hand, it is good to have one unique design for the digital spreadsheet and the printed one. This will fasten and reduce the error rate of the manual digitization of the data.
Information in .xlsx files
While Excel or libreoffice are user-friendly software to create and fill spreadsheets, they propose functions which are making the information computer un-readable and should be avoided. For instance, the “merging cells” function makes spreadsheet nice-looking but impossible to read in computer programs.
On the other hand, other function should be used with care: Colors, text formats or borders will also not be translated in any useful information for the data analyst. You can use them for purposes that are not data driven.
As a simple rule, export your excel spreadsheet into the
.csv format, that is the data included in your spreadsheet.
tsvformat is similar, it uses tabs instead of commas to
separate the values.
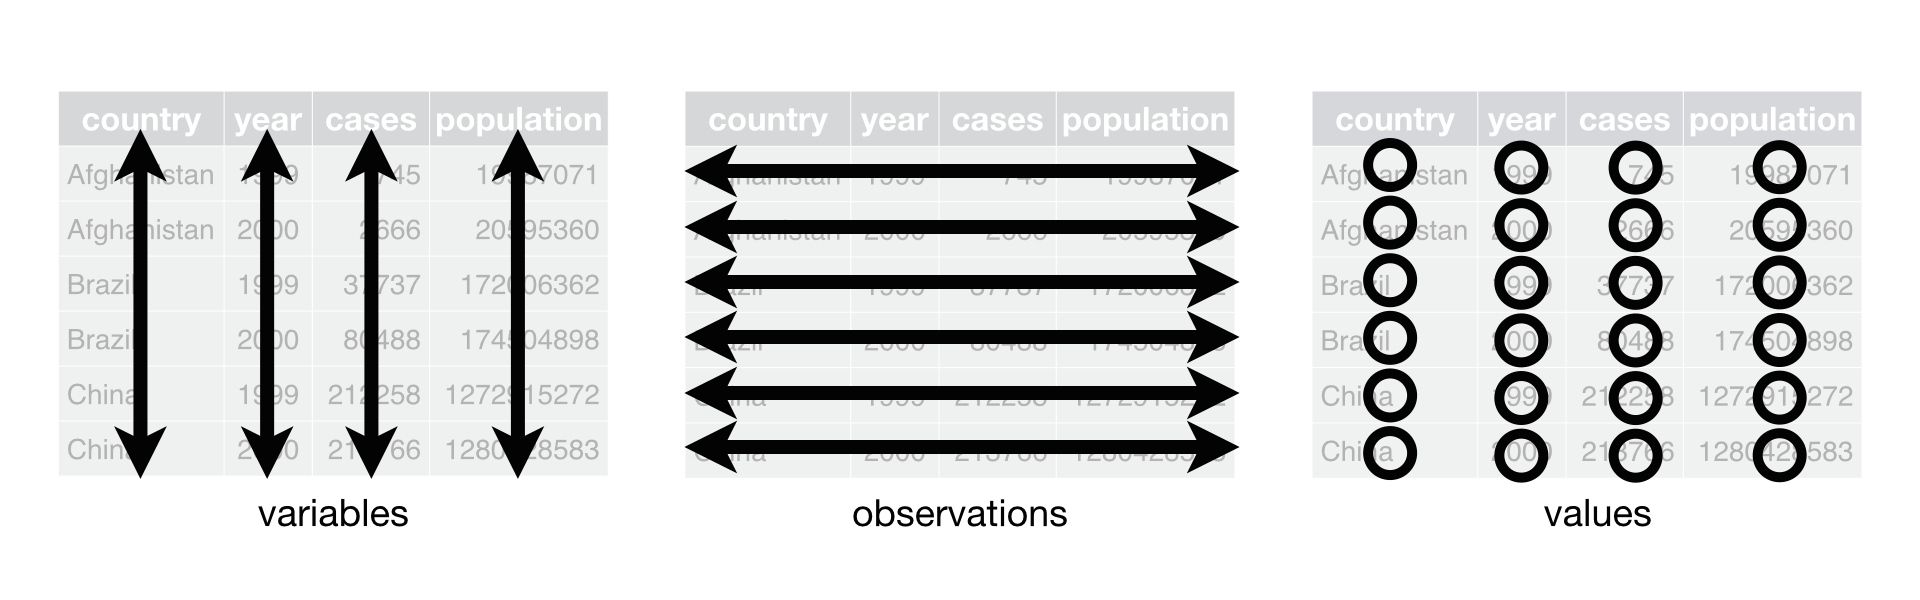
Tidy spreadsheets
There are very simple rules to facilitate data use, which go into the concept of tidy data. The tidy data format allows for filtering and sorting data easily in spreadsheet software.
Validation
Since spreadsheets are often entered manually, if is good to validate them automatically. There are usually tools to make sure the spreadsheet is tidy, that all cells are non-empty, or that values were not typed wrongly.
For instance, in the BIDS format, the participants.csv file we talked about earlier, comes with a json validator, which says what columns are required, and what values are accepted.
Some tips
- If you really need some information about the column in the spreadsheet itself, put it in the firs raw and have the headers in the second raw: it is easy to tell the computer to read a spreadsheet starting at the second raw, much more difficult to tell it to ignore the second raw.
- Instead of using colors, you can add one columns to add information usually given by the color. Software usually have a way to add colors to a row depening of the value of that new column.
- Designing good spreadsheet is usually an iterative process. It is often interesting to involve the whole team, or even a larger community. This is similar to a standard creation work.
- The process of naming columns should follow the same rules as naming files.
- For dates, use three columns (year, month, day): software will often change ISO formatted dates into a different format without telling you, during the file import.