Introduction
Overview
Teaching: 0 min
Exercises: 0 minQuestions
What is an interactive map?
Why using Jupyter notebook for creating interactive maps?
How to create our first interactive map in the jupyter notebook?
How to change default ipyleaflet basemap?
What is a layer?
Objectives
Understand what is an interactive map
Learn how to use the Jupyter notebook to create an interactive map
Learn about layers and how to control them
Requirements
In this lesson, we will be using the following python packages:
ipyleaflet
Whats is an interactive map?
An interactive map is a web based map with for instance clickable points or zoom functionalities. When clicking one of the points, it can show informational box (popup) relevant to that point.
Using interactive maps is a way to provide users with complex information in a very synthetic way.
Together, we will learn to create an interactive map dashboard from the beginning to the end.
Why using Python in Jupyter notebooks for creating interactive maps?
The Jupyter Notebook is based on a set of open standards for interactive computing.
It makes it possible to build data analysis and visualization with embedded interactive computing to enhance data exploration.
What is ipyleaflet?
Leaflet is one of the most popular open-source JavaScript libraries for interactive maps. It’s widely used by GIS specialists like OpenStreetMap, Mapbox, and CartoDB.
The ipyleaflet Python package makes it easy to integrate and control Leaflet maps in Python.
Note
foliumis another popular python package for visualizing data on an interactive leaflet map.
Our first interactive map with ipyleaflet in the Jupyter notebook
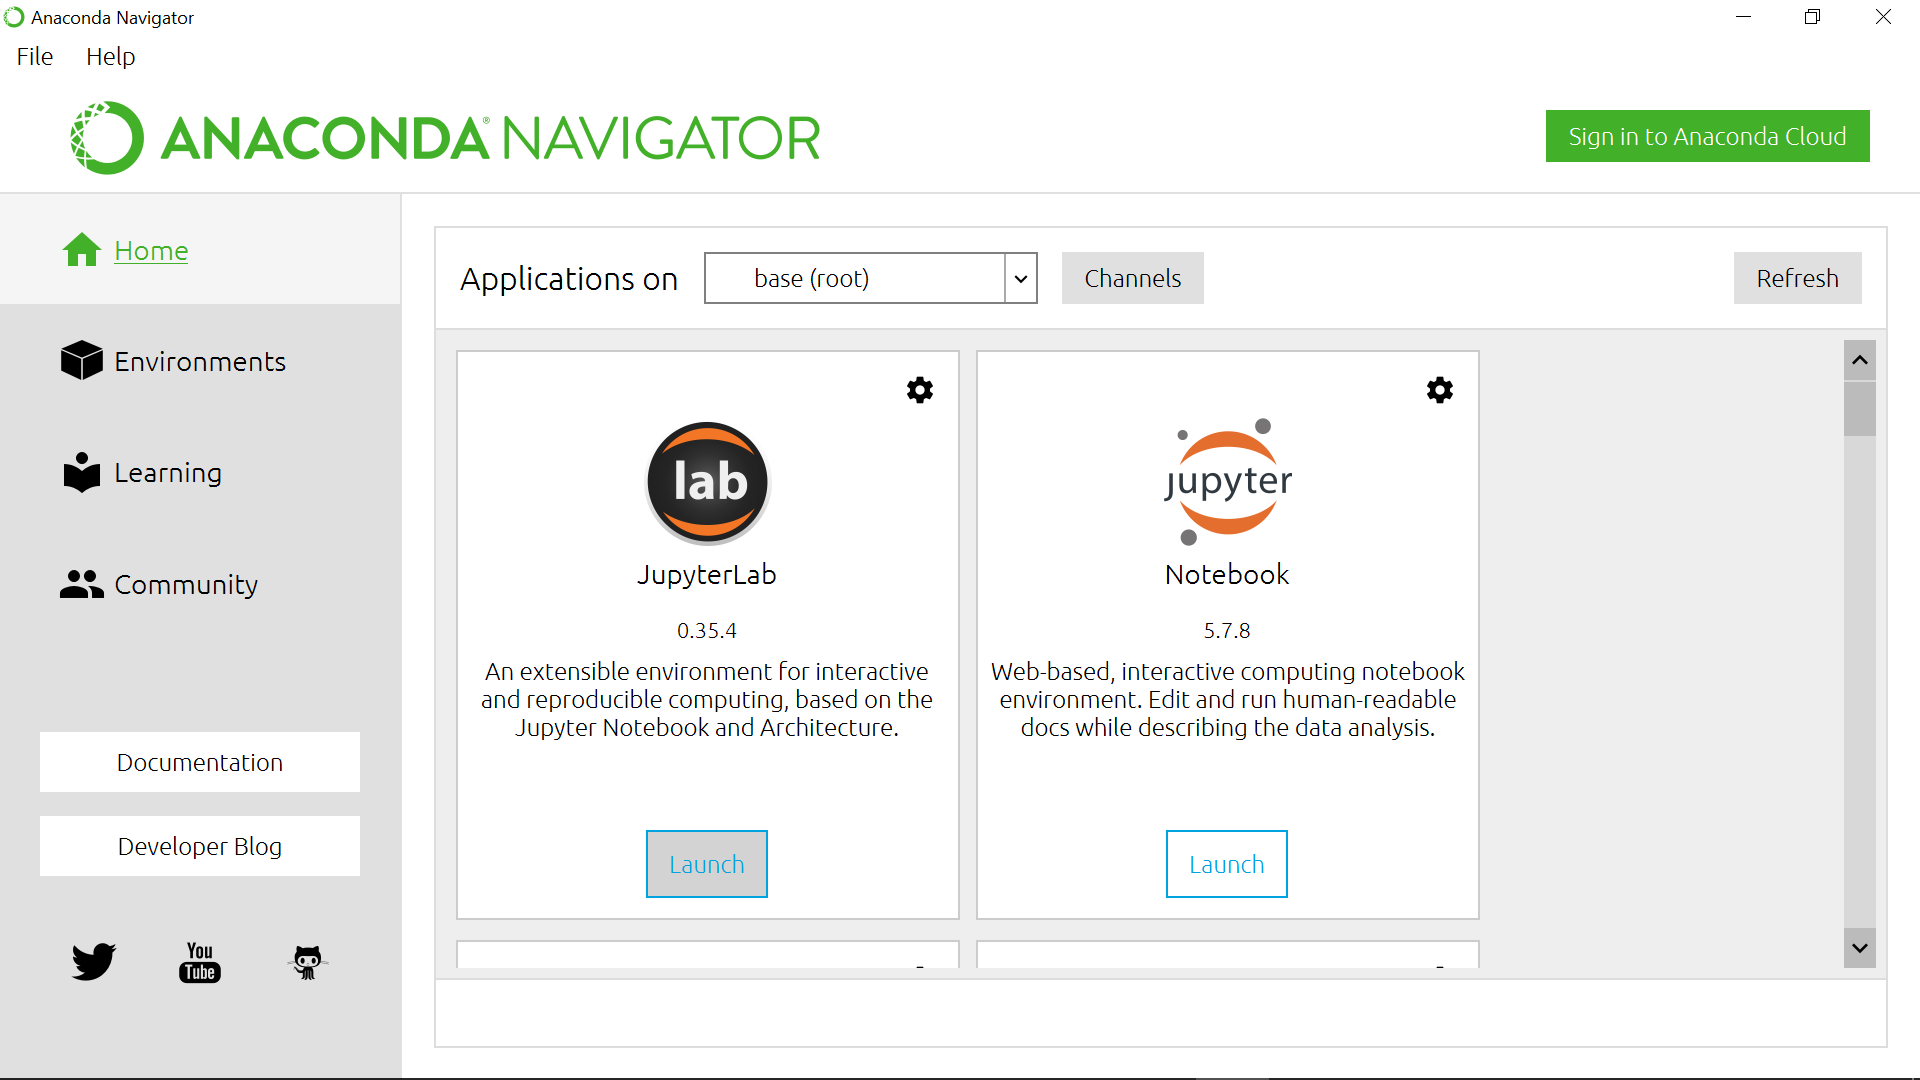
Start JupyterLab
With anaconda-navigator, start JupyterLab:
or from the command line, open a Terminal and run:
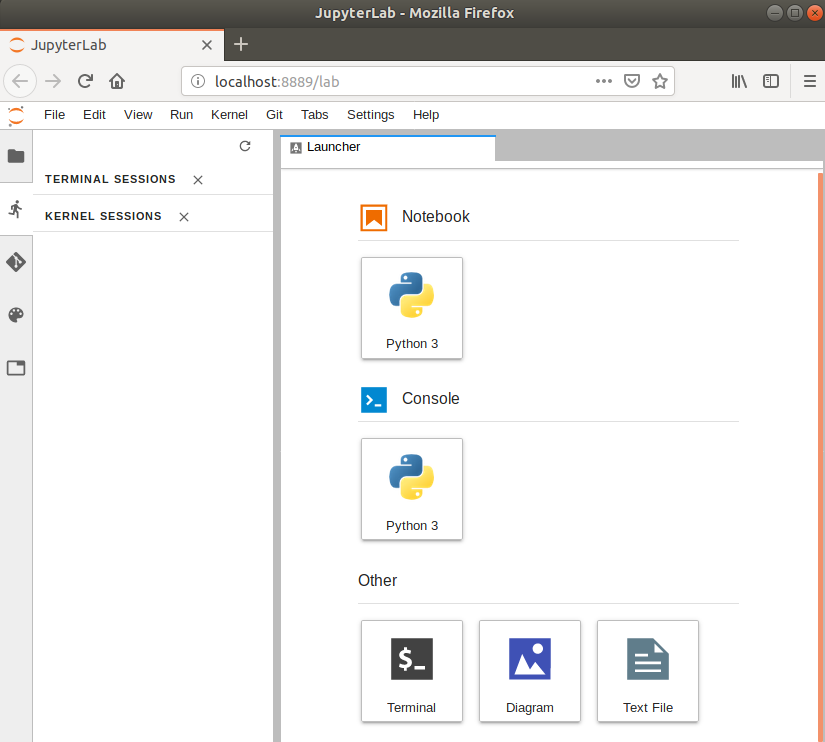
jupyter lab
In both cases, you should get a JupyterLab in your browser:
Default browser
You may need to change the default browser for starting your jupyter notebook. All the examples in this lesson have been tested with Google chrome.
Create a simple interactive map
Let’s open a new Python 3 Jupyter notebook and create our first interactive map:
from ipyleaflet import Map
Map()
What do you get?
- Try to zoom out to get a better view of the world.
Solution
Without any argument, a map is created with all the defaults:
- default location is centered over (0,0) (0 degrees latitude and 0 degrees longitude)
- default basemap in the background with continents and country boarders.
- Rename the notebook: right click on its name and rename it to for instance
simple_map.ipynb.
JupyterLab ipyleaflet extension
If you do not see any map with JupyterLab, you may need to install the JupyterLab extension:
jupyter labextension install jupyter-leafletSome users have found that the jupyterlab-manager is also required in jupyterlab if the map does not display.
jupyter labextension install @jupyter-widgets/jupyterlab-managerFor more information on how to install
ipyleaflet, look here.
Customize ipyleaflet interactive map
from ipyleaflet import Map, basemaps

# Map centred on (60 degrees latitude et -2.2 degrees longitude)
# Latitude, longitude
Map(center = (60, -2.2), zoom = 2, min_zoom = 1, max_zoom = 20,
    basemap=basemaps.Stamen.Terrain)
- center: Initial geographic center of the map (default value is (0,0)). A tuple needs to be given with the first element the latitude in degrees (from -90.0 to 90.0) and the second element is the longitude (from -180 to 180).
- zoom: Initial map zoom level (default value is 12)
- max_zoom: maximum value allowed for zooming in (default value is 18)
- min_zoom: minimum value allowed for zooming out (default value is 1)
- basemap: basemap used for
ipyleafletmap. Theipyleafletdocumentation does not give the full list of availablebasemapsinipyleafletbut it can be found in basemaps.py; usenamewhen passing basemaps toMap. A preview of most of them can be found here.
Try it out
- Create a new map centred on Manchester (United Kingdom)
- Try different basemaps such as
OpenTopoMapandEsri.WorldImagery.Solution
OpenTopoMapfrom ipyleaflet import Map, basemaps Map(center = (53.48, -2.24), zoom = 2, min_zoom = 1, max_zoom = 20, basemap=basemaps.OpenTopoMap)
Esri.WorldImageryMap(center = (53.48, -2.24), zoom = 2, min_zoom = 1, max_zoom = 20, basemap=basemaps.Esri.WorldImagery)
There are many more ways to customize your ipyleaflet. To get the full list of parameters for Map, read
Map reference documentation.
Map Layers
Introduction to map layers
Note
Definitions are taken from http://desktop.arcgis.com/en/arcmap/10.3/map/working-with-layers/what-is-a-layer-.htm.
Layers are used to display geographic datasets; the main idea is to have datasets and associated information “separated” into layers.

Example of map layers. Image is from http://cms.sbcounty.gov/portals/30/Images/Web%20Banner23.jpg.
And to keep it simple, we will start with one dataset per layer. The final result on ipyleaflet map will depend on
the layers you draw and the layer order.
Vector versus Raster
In the picture above, Raster and Vector are both mentioned. These are the two primary types of geospatial data structures.
Raster data is stored as a grid of values which are rendered on a map as pixels. Each pixel value represents an area on the Earth’s surface.
Source: Image taken from Geospatial Data Carpentry lessons on Introduction to Raster data.
Vector data structures represent specific features on the Earth’s surface, and assign attributes to those features.
Source: Image taken from Geospatial Data Carpentry lessons on Introduction to Vector data.
To get more information on these topics, look at the Geospatial Data Carpentry lessons.
Adding/removing a layer to ipyleaflet map
Adding or removing layers with ipyleaflet is done using add_layer or remove_layer. A layer is added or
removed from an existing ipyleaflet map, and to be able to do so, we store our map into a variable:
map = Map(center = (53.48, -2.24), basemap=basemaps.Esri.WorldImagery)
And then the map does not appear in our notebook. For this, you need to explicitly show it:
map
There are different “kind” of layers that can be added/removed to an ipyleaflet map and in the next episode,
we will learn to add a raster layer and vector layers. In both cases, we will be using
add_layer or remove_layer.
Key Points
JupyterLab
ipyleafletfor creating interactive maps
ipyleafletbasemapsLayers