(Meta)data in Excel
Overview
Teaching: 40 min
Exercises: 15 minQuestions
How to represent data in tables
Objectives
Do’s and don’ts in Excel
How good table organization can helps to re-use data
(2 min teaching)
Tables are one of the best forms of storing and representing information. That is why we find them almost everywhere, from a menu in a restaurant, a bank statement, to professional databases. No surprise then that we biologists love tables and we tend to predominantly use Excel.
Excel is easy to use, flexible and powerful, however, it often gives us too much freedom which leads to bad practices and difficult to re-use data and metadata.
Exercise 1: What can go wrong with data in Excel (4 min)
Have a look at the example data-file in Excel.
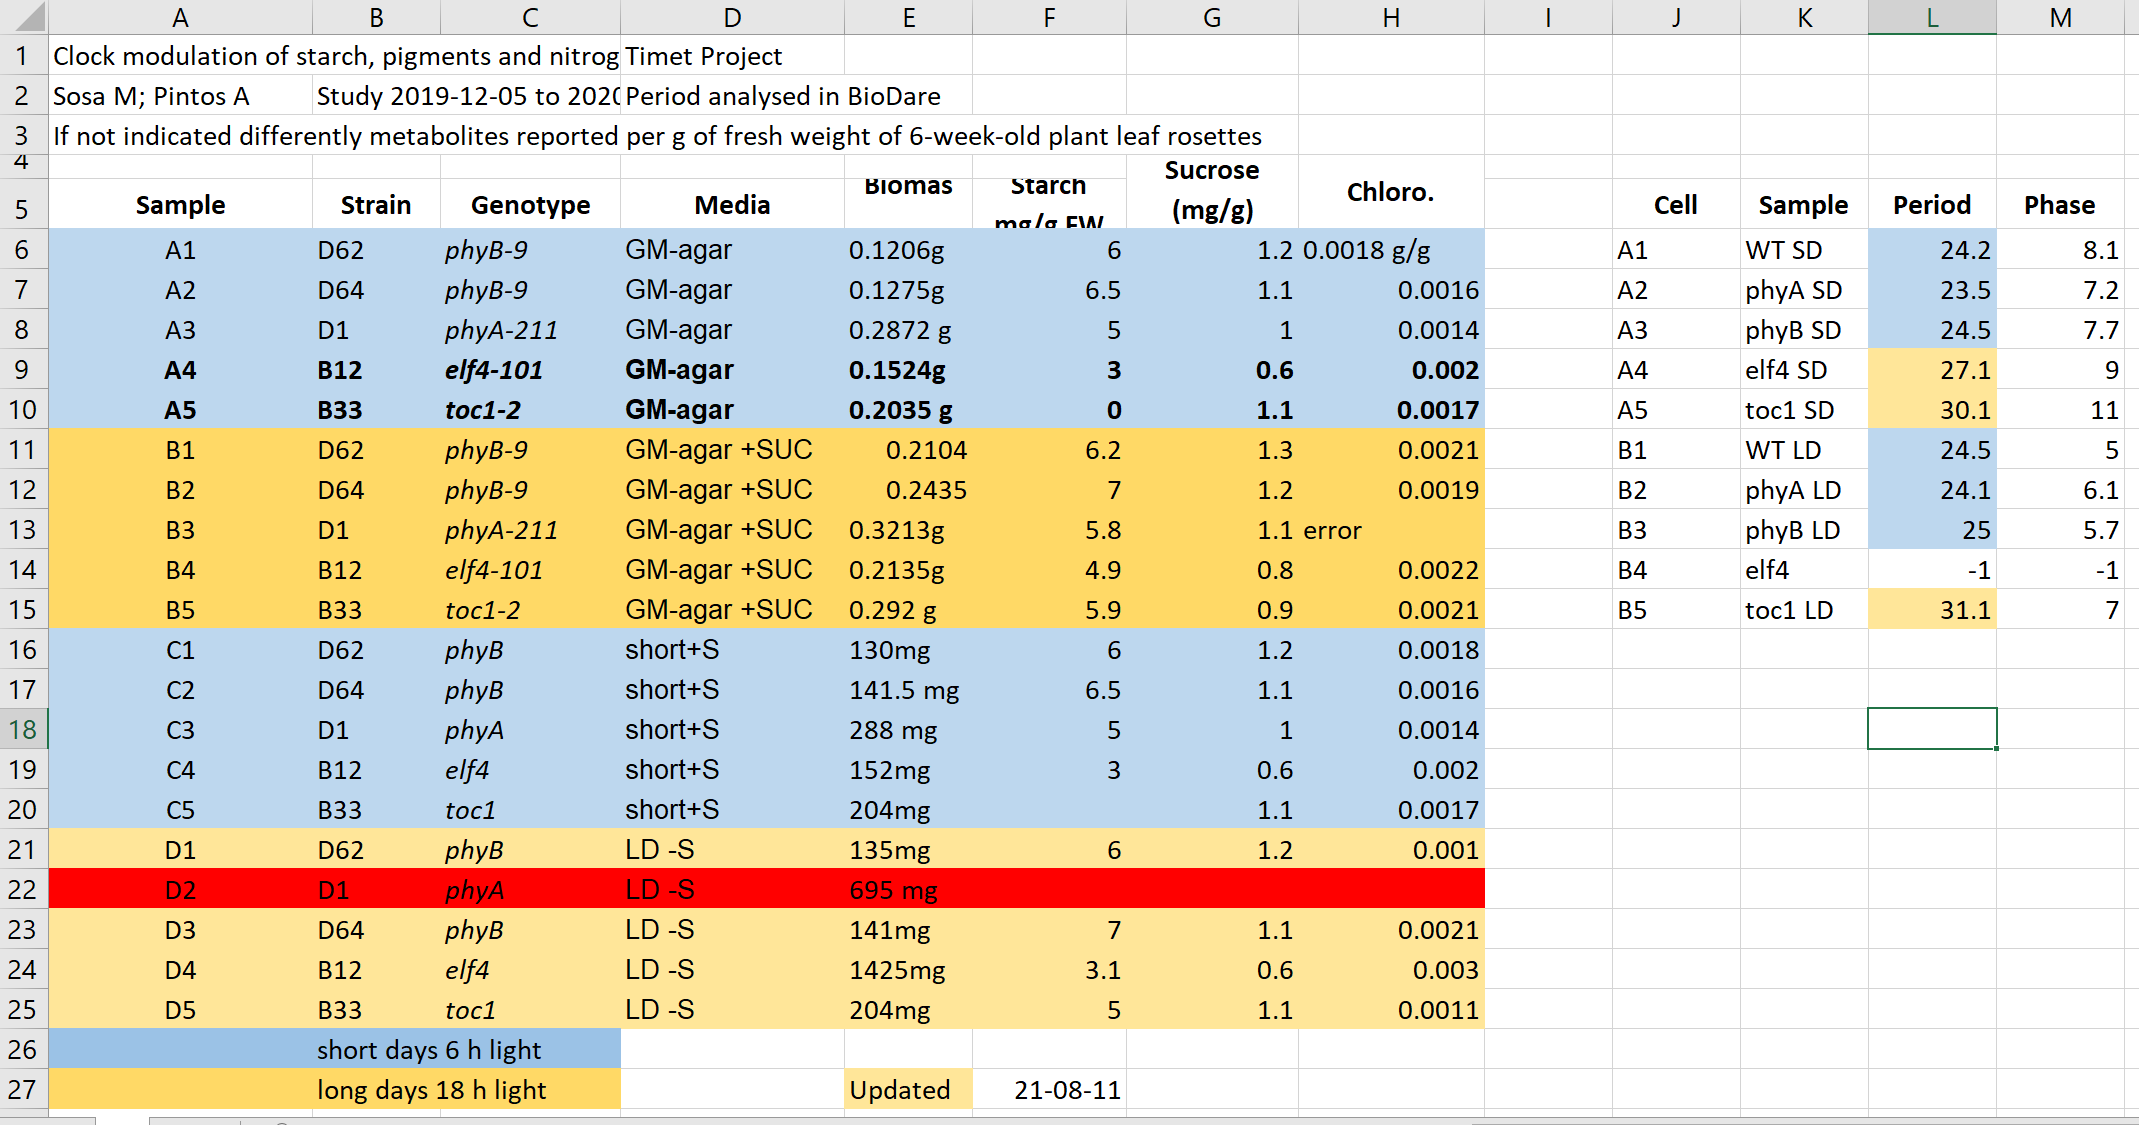
It contains data similar to the presented data before from experiments on plants in different light conditions. Imagine you need to work with this file.
- What do you find confusing?
- What would you try to clarify with the author before doing anything with the file?
- What will be the issues with calculation of: average biomas, biomas per genotype?
- Typically, more advanced data analysis is done programmatically, which requires either conversion to text format as csv, tsv format or using a library that reads Excel files and “kind of makes this conversion on the fly”. Save this file in a text format, close Excel and reopen the saved files. What has changed?
Have you seen similar tables? Do you believe this example is realistic and replicates real-life issues?
Solution
This file hopefully unrealistically exacerbates typical bad practices in Excel. 1+2. Some things that may be confusing:
- Why are there two tables, are the period measurement related to the metabolics i.e. same samples?
- Do colors in the period table have the same meaning? Seems no.
- Why can row 22 be read, whilst row 13 says error?
- What is the meaning of values in the media column?
- Are the genotypes the same in different blocks or not?
- What is the meaning behind bold text in the table?
- What is the definition of the terms/why are units missing/inconsistent? 3.
- Before averaging the biomas weight, they need to get converted the same unit and the text needs to get replaced by the unit.
- Averaging per genotype needs manual selection of suitable entries 4.
- Information about light conditions is completely lost.
- Header columns are scrambled.
- The update date may change its meaning depending on the location (switch year with day).
Common Spreadsheet Errors (25 min teaching)
1. Using multiple tables
Multiple data tables within one spreadsheet confuse both human and computers.
- For humans they prompt finding associations where they are not present.
- For computers each spreadsheet row typically is treated as one observation. And you are potentially using the same field name in multiple places.
In our example both column A and K named sample represent different information,
and values in row 6 from both parts are not related.
2. Using multiple tabs
That seems like an easy way to organize data, right? Well, yes and no.
- tabs make it more difficult to do programmatic analysis
- tabs can be ignored (under the radar) when opening files, for example the recently used tab is shown first, other user may not notice that there are many other tabs before it (we have seen it a lot when importing data)
However,
- tabs seems like a perfect place to add administrative, descriptive metadata so they are next to data while not “polluting” the data table.
- having secondary data next to primary in subsequent tabs permits easy inspection of all without a need to always send a collection of files.
Our recommendation: use with caution; the more automatic analysis you do, the less frequently you should use tabs.
3. Not filling in zeros
It might be that when you’re measuring something, it’s usually a zero, say the number of times a rabbit is observed in the survey. Why bother writing in the number zero in that column, when it’s mostly zeros?
However, there’s a difference between a zero and a blank cell in a spreadsheet. To the computer, a zero is actually data. You measured or counted it. A blank cell means that it wasn’t measured and the computer will interpret it as an unknown value (otherwise known as a null value).
The spreadsheets or statistical programs will likely mis-interpret blank cells that you intend to be zeros.
Because of this, it’s very important to record zeros as zeros and truly missing data as nulls.
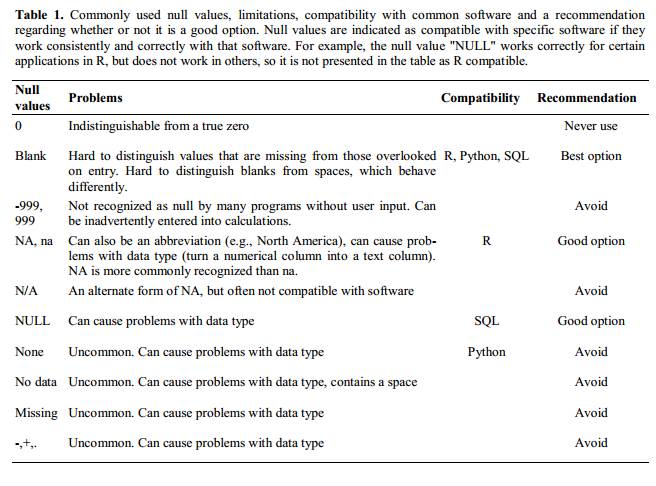
4. Using problematic null values
Example: using -999 or -1 or 0 (other numerical values) to represent missing data.
Other times different null values are used to convey different reasons why the data isn’t there. For example, -1 not recorded, -2 contamination etc.
This is important information to capture, but is in effect using one column to capture two pieces (real values and comment or status). It would be good here to create a new column like ‘data_missing’ and use that column to capture the different reasons.
Whatever the reason, it’s a problem if unknown or missing data is recorded as -999, 999, or 0. Many statistical programs will not recognize that these are intended to represent missing (null) values.
It is essential to use a clearly defined and consistent null indicator. Blanks (most applications) and NA (for R) are good choices.
White et al, 2013, explain good choices for indicating null values for different software applications in their article: Nine simple ways to make it easier to (re)use your data. Ideas in Ecology and Evolution.
5. Using formatting to convey information organizing data
Never highlight cells, rows or columns that should be excluded from an analysis, or to mark particular properties/conditions.
In our example file information about light conditions is only encoded as a color. Formatting information is not available to analysis software and almost certainly will be lost during processing.
All the information should be encoded as a field value, for example in columns like: condition, calibrated, validated, omitted etc.
You can still use colors/fonts to help with readability (just make sure they help and don’t distract) but no information should be lost if data is exported to plain text.
If you are not careful, formatting a worksheet to be more aesthetically pleasing can compromise your computer’s ability to see associations in the data.
Never merge cells, as it will make your data unreadable by statistics software. Don’t leave blank rows to indicate separations in data
6. Placing comments or units in cells
Most analysis software can’t see Excel or LibreOffice comments, and would be confused by comments placed within your data cells.
As described above for formatting, create another field if you need to add notes to cells.
Similarly, don’t include units in cells: ideally, all the measurements you place in one column
should have the same unit, but if for some reason they don’t, create another field and specify the unit.
A field value 0.123 g will need to be parsed by a script into 0.123 and g in order to be used
for calculations, don’t add extra work for others.
7. Entering more than one piece of information in a cell
Don’t include more than one piece of information in a cell (like M30, F25, for male age 30 and female 25,
or Red light + Ampicilin + High nitrogen).
This will limit the ways in which you can analyze your data. Design your data sheet to include this information. For example, include one column for age of individuals and a separate column for sex.
8. Inconsistency in used values
Using “synonyms” or alternatives to describe the same values.
For example: E. Coli, EColi, Escherichia coli in the same table
9. Using problematic field names
Choose descriptive field names, but be careful not to include spaces, numbers, or special characters of any kind (including national characters: óęłńöüä). Spaces can be misinterpreted by parsers that use whitespaces as delimiters and some programs don’t like field names that are text strings starting with numbers (e.g. Excel).
Underscores (_) are a good alternative to spaces.
Consider writing names in camel case (like this: ExampleFileName) to improve
readability.
Remember that abbreviations that make sense at the moment may not be so obvious in 6 months, but don’t overdo it with names that are excessively long.
Including the units in the field names avoids confusion and enables others to readily interpret your fields. Or add a separate row to help automatic unit conversions.
Examples
| Good Name | Good Alternative | Avoid |
| Max_temp_C | MaxTemp | Maximum Temp (°C) |
| Precipitation_mm | Precipitation | precmm |
| Mean_year_growth | MeanYearGrowth | Mean growth/year |
| sex | sex | M/F |
| weight | weight | w. |
| cell_type | CellType | Cell Type |
| Observation_01 | first_observation | 1st Obs |
10. Using special characters in data
For example, when writing longer text in a cell, people often include line breaks, em-dashes, etc in their spreadsheet. Also, when copying data from applications such as Word, formatting and ‘fancy’ non-standard characters (such as left- and right-aligned quotation marks) are included. When exporting this data into a coding/statistical environment or into a relational database, dangerous things may occur, such as lines being cut in half and encoding errors being thrown.
General best practice is to avoid adding characters such as new lines, tabs, vertical tabs and sadly, national characters. In other words, treat a text cell as if it were a simple web form that can only contain text and spaces.
11. Values without field labels
It may be obvious for us that a cell Ann Smart and Daniele Hardwork contains authors and
Starch content in Arabidopis T. under different light conditions is a title, but this is not obvious
for a computer program.
Always label values as the column header, or as a first field on the left:
Author  |  Ann Smart  |  Daniele Hardwork
Title   |  Starch content in Arabidopis T. under different light conditions
Exercise 2: Spotting problems (4 min)
Look at the following rows and columns in the problematic table:
- Row 5
- Row 2
- Column C
- Column E
- Column L
which of the problems discussed above can you spot in these rows and column? Here, we list them again:
- Using multiple tables
- Using multiple tabs
- Not filling in zeros
- Using problematic null values
- Using formatting to convey information and organizing data
- Placing comments or units in cells
- Entering more than one piece of information in a cell
- Inconsistency in used values
- Using problematic field names
- Using special characters in data
- Values without field labels
Type the problem number(s) next to the table elements
Solution
- Row 5: 5, 9
- Row 2: 11, 7
- Column C: 8
- Column E: 6, 5
- Column L: 3
Clean data tables make life easier (6 min teaching)
Let’s check the cleaned version of the previous file.
Look how easy it is to calculate the average biomas, and if you have Office365, see how easy it is to get average values per genotype.
Do you think it would take more effort to record data in a cleaned way to start with, in comparison to the ‘bad example’ presented before?
How long do you think it took to “clean” the original, problematic data?
Exercise 3: Outsmarted by Excel (3 min)
Excel has built in autoformatting functions which can make biologist’s life more difficult
Finding the right date
Open Excel and type following values into the cells:
A B C D E F Gene SEPT2 Sample 0013 Record 12/5/4 Mar1 1 March Mar-1 1-3 14/3/20 43904
- Is what you see what you typed?
- Can you force Excel to keep your formatting?
- Do you know which year the dates represent?
(9 min teaching)
A team of Australian researchers analyzed nearly 3,600 genetics papers Ziemann 2016. As is common practice in the field, these papers all came with supplementary files containing lists of genes used in research.
The Australian researchers found that roughly 1 in 5 of these papers included errors in their gene lists that were due to Excel automatically converting gene names to things like calendar dates or random numbers.
Those errors actually forced the renaming of 27 gene symbols including SEPT4 (now SEPTIN4) and MARCH1 (now MARCHF1).
Storing and handling dates is generally problematic even in programming languages, as we tend to use dates in various formats and those formats are region specific.
Have you ever got confused by a meeting date from an American collaborator?
If the dates are “real” data, for example sample collection from a patient or field measurement, preventing misinterpretations is crucial. There are two safe options:
- Store dates in 3 columns for year, month and day:
| Year | Month | Day |
|---|---|---|
| 2021 | 3 | 16 |
| 2021 | 10 | 1 |
- Store the date as an ISO string:
YYYYMMDDe.g.20210316
Even though, normally YYYY-MM-DD format is preferred, it will be sadly reformatted by Excel according
to your locale!
When using text files (.csv, .tsv), You should always document what format you are using to represent dates.
To use or not to use Excel
The Excel file format
.xlsxis now open, widely used and supported by external libraries and thus it could be considered interoperable. Nowadays it is admissible as being FAIR.However, plain text files like comma or tab separated values (.csv, .tsv) can be accessed without any special software. Data in a CSV file can also easily be imported into other formats and environments, such as SQLite and R. We are not tied to a certain version of a certain expensive program when we work with CSV files, so it is a good format to work with for maximum portability, interoperability and endurance. If such files are handled only with text editors or programmatically (R, Python) then they are a safer option as they prevent the autoformatting issues described before.
If you analyse your data with R or Python, or you know that your data are meant to be processed that way you should be using text formats whenever possible, and as soon as you capture your data.
However, if you only use Excel and so does your community, just keep using it. Just be aware of the possible pitfalls discussed, especially when working with gene or protein names and accession numbers.
Cleaning data with Open Refine
There are tools that help you to clean and reorganize existing data.
OpenRefine is a powerful tool for working with messy data: cleaning it; transforming it from one format into another; and extending it with web services and external data.
With OpenRefine you can find and merge synonyms like:
E. Coli,EColi,Escherichia coliinto one, or split values in theNamefield intoFirstNameandLastName.There is a carpentry course available: Data Cleaning with OpenRefine for Ecologists
Exercise 4: Data tables and FAIR (3 min)
Which of the following statements is true/false (T or F):
- Do’s and don’ts help in programmatic re-use:
- Avoiding multiple tabs improves interoperability:
- Having accompanying README file with a table description is not FAIR:
- No ‘spaces’ in columns headers improve readability:
- 2022-07-15 is ISO date format:
- 20220715 date format is better for excel than 2022-07-15:
- “No data” is better than leaving cell “blank” for missing data:
Solution
- Do’s and don’ts help in programmatic re-use: T
- Avoiding multiple tabs improves interoperability: T
- Having accompanying README file with a table description is not FAIR: F
- No ‘spaces’ in columns headers improve readability: F
- 2022-07-15 is ISO date format: T
- 20220715 date format is better for excel than 2022-07-15: T
- “No data” is better than leaving cell “blank” for missing data: F

Key Points
Never use formatting to encode information
Include only one piece of information in a cell
It is easier to store data in the correct form than to clean data for reuse