Developing Multi-Step Workflows
Overview
Teaching: 0 min
Exercises: 0 minQuestions
How can we expand to a multi-step workflow?
Iterative workflow development
Workflows as dependency graphs
How to use sketches for workflow design?
Objectives
explain that a workflow is a dependency graph
use cwlviewer online
generate Graphviz diagram using cwltool
exercise with the printout of a simple workflow; draw arrows on code; hand draw a graph on another sheet of paper
recognise that workflow development can be iterative i.e. that it doesn’t have to happen all at once
understand the flow of data between tools
Multi-Step Workflow
In the previous episode a single step workflow was shown, carrying out a simple RNA read
of the fruitfly genome. In this episode the workflow is extended with an equivalent reverse
RNA read and the next two steps of the RNA-sequencing analysis, trimming the reads and
aligning the trimmed reads, are added.
We will be using the cutadapt and STAR tools for these tasks.
To make a multi-step workflow that can carry all this analysis out, we add more entries
to the steps field. Note that when the quality_control step is duplicated the two
steps are named quality_control_forward and quality_control_reverse, to distinguish
the separate forward and reverse RNA reads. Likewise, the rna_reads_fruitfly input becomes
rna_reads_fruitfly_forward, and an rna_reads_fruitfly_reverse input is added.
rna_seq_workflow_2.cwl
cwlVersion: v1.2
class: Workflow

inputs:
  rna_reads_fruitfly_forward:
    type: File
    format: http://edamontology.org/format_1930  # FASTQ
  rna_reads_fruitfly_reverse:
    type: File
    format: http://edamontology.org/format_1930  # FASTQ
  ref_fruitfly_genome: Directory
  fruitfly_gene_model: File

steps:
  quality_control_forward:
    run: bio-cwl-tools/fastqc/fastqc_2.cwl
    in:
      reads_file: rna_reads_fruitfly_forward
    out: [html_file]

  quality_control_reverse:
    run: bio-cwl-tools/fastqc/fastqc_2.cwl
    in:
      reads_file: rna_reads_fruitfly_reverse
    out: [html_file]

  trim_low_quality_bases:
    run: bio-cwl-tools/cutadapt/cutadapt-paired.cwl
    in:
      reads_1: rna_reads_fruitfly_forward
      reads_2: rna_reads_fruitfly_reverse
      minimum_length: { default: 20 }
      quality_cutoff: { default: 20 }
    out: [ trimmed_reads_1, trimmed_reads_2, report ]

  mapping_reads:
    requirements:
      ResourceRequirement:
        ramMin: 5120
    run: bio-cwl-tools/STAR/STAR-Align.cwl
    in:
      RunThreadN: {default: 4}
      GenomeDir: ref_fruitfly_genome
      ForwardReads: trim_low_quality_bases/trimmed_reads_1
      ReverseReads: trim_low_quality_bases/trimmed_reads_2
      OutSAMtype: {default: BAM}
      SortedByCoordinate: {default: true}
      OutSAMunmapped: {default: Within}
      Overhang: { default: 36 }  # the length of the reads - 1
      Gtf: fruitfly_gene_model
    out: [alignment]

  index_alignment:
    run: bio-cwl-tools/samtools/samtools_index.cwl
    in:
      bam_sorted: mapping_reads/alignment
    out: [bam_sorted_indexed]

outputs:
  quality_report_forward:
    type: File
    outputSource: quality_control_forward/html_file
  quality_report_reverse:
    type: File
    outputSource: quality_control_reverse/html_file
  bam_sorted_indexed:
    type: File
    outputSource: index_alignment/bam_sorted_indexed
The workflow file shows the first 5 steps of the RNA-seq analysis: quality_control_reverse,
quality_control_forward, trim_low_quality_bases, mapping_reads, and index_alignment.
The index_alignment step uses the alignment output of the mapping_reads step.
You do this by referencing the output of the mapping_reads step in the in field of the index_alignment step.
This is similar to referencing the outputs of the different steps in the outputs section.
The mapping_reads step needs some extra information beyond the inputs from the other steps, which
is done by providing default values. If you want, you can read the bio-cwl-tools/STAR/STAR-Align.cwl
file to see how these extra inputs are transformed into command line options to the STAR program.
This information is provided in the in field.
To run the tool better, it needs more RAM than the default. So there is a requirements entry inside
the mapping_reads step definition with a ResourceRequirement to allocate a minimum of
5120 MiB (5 GiB) of RAM.
The newly added mapping_reads step also need an input not provided by any of our other steps,
therefore an additional workflow-level input is added: a directory that contains the reference genome
necessary for the mapping.
This ref_fruitfly_genome is added in the inputs field of the workflow and in the YAML input file,
workflow_input_2.yml.
workflow_input_2.yml
rna_reads_fruitfly_forward:
  class: File
  location: rnaseq/GSM461177_1_subsampled.fastqsanger
  format: http://edamontology.org/format_1930  # FASTQ
rna_reads_fruitfly_reverse:
  class: File
  location: rnaseq/GSM461177_2_subsampled.fastqsanger
  format: http://edamontology.org/format_1930  # FASTQ
ref_fruitfly_genome:
  class: Directory
  location: rnaseq/dm6-STAR-index
fruitfly_gene_model:
  class: File
  location: rnaseq/Drosophila_melanogaster.BDGP6.87.gtf
Exercise
Draw the connecting arrows in the following graph of our workflow. Also, provide the outputs/inputs of the different steps. You can use for example Paint or print out the graph.
Solution
To find out how the inputs and the steps are connected to each other, you look at the
infield of the different steps.
Iterative working
Working on a workflow is often not something that happens all at once. Sometimes you already have a shell script ready that can be converted to a CWL workflow. Other times it is similar to this tutorial, you start with a single-step workflow and extend it to a multi-step workflow. This is all iterative working, a continuous work in progress.
Visualising a workflow
A CWL workflow is a directed acyclic graph (DAG). This means that:
- The workflow has a certain direction, from workflow inputs to step inputs, from step outputs to other step inputs, and from step outputs to workflow outputs and
- The workflow definition has no cycles.
A CWL workflow is a dependency graph. Each input for a step in the workflow depends on either a workflow-level input or a particular output from another step.
To visualise a workflow, a graph can be used. This can be done before a CWL script is written to
visualise how the different steps connect to each other. It is also possible to make a graph after
the CWL script has been written. This graph can be generated using online tools or the built-in
function in cwltool. When a graph is generated, it can be used to visualise the steps taken and
could make it easier to explain a workflow to other researchers.
From CWL script to graph
In this example the workflow is already made, so the graph can be generated using
cwlviewer online or using cwltool. First, let’s have a look at
cwlviewer. To use this tool, the workflow has to be put in a GitHub,
GitLab or Git repository. To view the graph of the workflow enter the URL and click Parse Workflow.
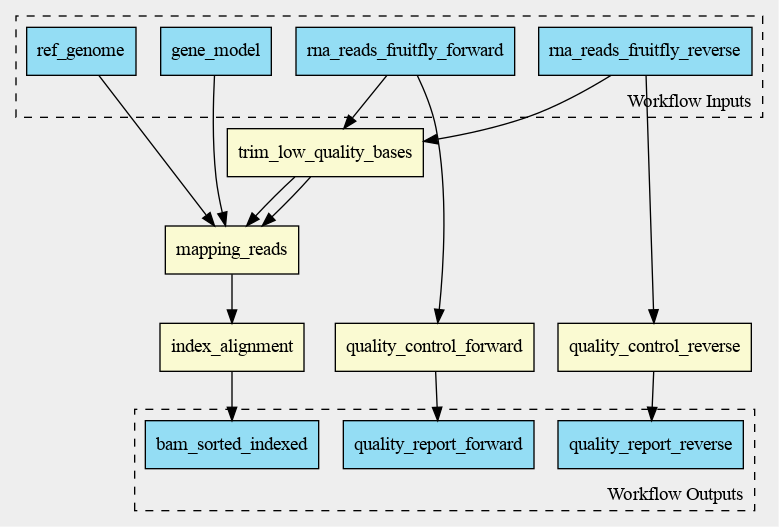
The cwlviewer displays the workflow as a graph, starting with the input. Then the different steps
are shown, each with their input(s) and output(s). The steps are linked to each other using arrows
accompanied by the input of the next step. The graph ends with the workflow outputs.
The graph of the RNA-seq workflow looks a follows:
It is also possible to generate the graph in the command line. cwltool has a function that makes a
graph. The --print-dot option will print a file suitable for Graphviz dot program. This is the
command to generate a Scalable Vector Graphic (SVG) file:
cwltool --print-dot rna_seq_workflow_2.cwl | dot -Tsvg > workflow_graph_2.svg
The resulting SVG file displays the same graph as the one in the cwlviewer. The SVG file can be opened in any web browser and in Inkscape, for example.
Visualisation in VSCode
Benten is an extension in Visual Studio Code (VSCode) that among other things visualises a workflow in a graph. When Benten is installed in VSCode, the tool can be used to visualise the workflow. In the top-right corner of the VSCode window the CWL viewer can be opened, see the screenshot below.
.png)
In VSCode/Benten the inputs are shown in green, the steps in blue and the outputs in yellow. This
graph looks a little bit different from the graph made with cwlviewer or cwltool.
The graph by VSCode/Benten doesn’t show the output-input names between the different steps.
.png)
Key Points
A multi-step workflow has multiple entries under the
stepssectionWorkflow development can be an iterative process
A CWL workflow can be represented as a dependency graph, either to explain your workflow or as a planning tool