Identify the problem and make a plan
Last updated on 2026-05-12 | Edit this page
Estimated time: 70 minutes
Overview
Questions
- What do I do when I encounter an error?
- What do I do when my code outputs something I don’t expect?
- Why do errors and warnings appear in R?
- How can I find which areas of code are responsible for errors?
- How can I fix my code? What other options exist if I can’t fix it?
Objectives
After completing this episode, participants should be able to…
- Describe how the desired code output differs from the actual output
- Categorize an error message (e.g. syntax error, semantic errors, package-specific errors, etc.)
- Describe what an error message is trying to communicate
- Identify specific lines and/or functions generating the error message
- Use R Documentation to look up function syntax and examples
- Quickly fix commonly-encountered R errors using ‘code first aid’
- Identify when a problem is better suited for asking for further
help, including making a
reprex
Let’s take a look in more detail at the first step of the roadmap.
In this episode, we’ll cover what to do when you first encounter an error or undesired output from your code. We’ll cover the basics of identifying errors, fixing them if possible, and determining when to create a reprex. At the end of the lesson, we’ll return to Mickey’s analysis.
The first step in solving a problem is understanding what is going wrong. Sometimes R will help you out by displaying an error message when it is unable to run your code. This is a helpful diagnostic tool that, when interpreted correctly, can quickly lead you to a solution. Other times, R doesn’t encounter any problems running your code, but the output is not what you expected. These problems may require a few extra steps to properly diagnose. We will start with easier scenarios and provide helpful “code first aid” steps as we build up to harder challenges.
Strategy 1: Interpret error messages and change function inputs
R will often let us know there’s a problem by displaying an error message. An error that generates an error message is called a syntax error. Error messages happen when R is not able to run your code (this is in contrast to a warning message, which gives a hint that something could be wrong while the code keeps running). Error messages are sometimes straightforward, but other times they can be very tricky to decipher. In this lesson, will teach some tools for interpreting syntax errors for yourself.
Here’s an example error message. In the last episode, we saw that the
taxa column contains information about the higher-level
taxon of each organism caught, such as “Rodent” or “Bird”. We decide to
look at the distribution of taxa by creating a frequency table.
R
table(taxa)
ERROR
Error: object 'taxa' not foundThis code produces an error. What’s going on?
R is telling us that it can’t find taxa in the local
environment. That’s because we haven’t told it where to look–recall that
taxa is the name of a column in the surveys
dataset.
The information from the error message doesn’t specifically tell us
how to solve the error, but it can help us realize what went wrong. In
this case, we can look back at our previous code and see that we were
able to point R to the column using the $ operator:
R
table(surveys$taxa)
OUTPUT
   Bird  Rabbit Reptile  Rodent
    300      69       4   16148
That’s better! Now, let’s make a barplot of this column to show this same information.
R
# Make a plot of the different taxa in the rodents dataset
ggplot(aes(x = surveys$taxa)) + geom_bar()
ERROR
Error in `fortify()` at ggplot2/R/plot.R:121:3:
! `data` must be a <data.frame>, or an object coercible by `fortify()`,
  or a valid <data.frame>-like object coercible by `as.data.frame()`, not a
  <uneval> object.
ℹ Did you accidentally pass `aes()` to the `data` argument?
It seems like that should have worked, but we got another error message, and this one seems harder to interpret. Once again, let’s go over each part of the error message and see if it provides any clues.
First, we see an error from a function called fortify,
which we didn’t even use! Then, there’s a more helpful informational
message: “Did you accidentally pass aes() to the
data argument?” This does seem to relate to our line of
code, as we do pass aes into the ggplot
function. But what is this “data argument?”
Strategy 2: Read function documentation
Reading the error message gave us some clues, but it wasn’t enough to fix the problem. Let’s try another strategy. Reading the function documentation can improve our understanding of how the function works, and often that can reveal problems with our code.
Let’s access the documentation for the function
ggplot:
R
?ggplot
A Help window pops up in RStudio. [Add discussion of the different
sections of function documentation, in general terms, here?] The “Usage”
and “Arguments” sections tell us that ggplot takes the argument
data, followed by mapping, which uses
aes(). The “Arguments” section tells us that if the object
passed to that first data argument isn’t already a data
frame, ggplot will try to convert it to a data frame using
fortify. That function, fortify, sounds
familiar from the error message! This gives us an important clue. It
looks like we accidentally passed the mapping argument into
the position where ggplot expected data in the form of a
data frame.
The “Examples” section of the function documentation can be
particularly helpful because it shows how functions are used in context.
The “Examples” section in the ggplot documentation, under
“Pattern 1”, shows exactly how ggplot expects the
data and mapping arguments to be written.
Using this information, we can change our code to put the arguments
in the right order–first the name of the dataset for the
data argument, and then the aes() call for the
mapping argument.
R
ggplot(data = surveys, mapping = aes(x = taxa)) + geom_bar()
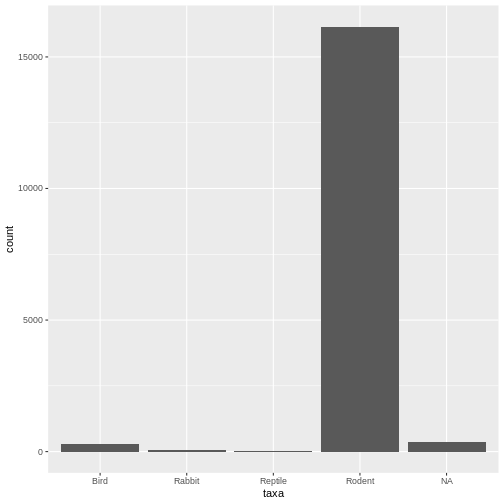
The error message is gone, and it works! Here we see our desired plot. What do you notice about the data?
- Lots of rodents - Some missing values (NAs)
Let’s take a moment to highlight some patterns we’re starting to see in the course of tinkering with our code.
First, we noticed a problem. In this case, the problem was a syntax error, in which the code failed to run and we got an error message.
We carefully read the error message and took a guess at what might be wrong. We changed the inputs to the function accordingly and tried again.
When we encountered another error message, we looked through the function documentation to find more clues about how to fix the error. This helped us see that we were missing an argument.
Another strategy we could have tried would be to copy and paste the error message into a search engine or a generative LLM for more interpretable explanations. And, when all else fails, we can prepare our code into a reproducible example for expert help.
Let’s see if we can use the strategies we’ve learned so far to address a new problem. Here they are, for reference:
Code first aid strategies
- Interpret error messages and tweak inputs
- Look at the function documentation
- Put the error message into a search engine or a generative LLM
Exercise 1: Applying code first aid
Below we see an error message pop up when trying to quantify the
counts of genus and species in our dataset.
Which of the following interpretations of the error message most aptly
describes the problem (hint: look at the ?tally
documentation if you’re stuck!)
R
surveys %>% tally(genus, species)
ERROR
Error in `tally()` at magrittr/R/pipe.R:136:3:
ℹ In argument: `n = sum(genus, na.rm = TRUE)`.
Caused by error in `sum()`:
! invalid 'type' (character) of argumenttallydoes not accept'type' (character)arguments. We should change genus and species to factors or numbers and run this line again.tallydoes not accept'type' (character)arguments. There is no way to quantify these data with this function.tallydoes not accept'type' (character)arguments. We need to assign a weight (e.g. 1) to each row so it knows how much to numerically weigh each observation.tallydoes not accept'type' (character)arguments. This function is not intended togroup_bytwo variables and a different function (count) is required instead.
d is the correct answer!
R
surveys %>% count(genus, species)
OUTPUT
# A tibble: 36 × 3
   genus            species             n
   <chr>            <chr>           <int>
 1 Ammospermophilus harrisi           136
 2 Amphispiza       bilineata         223
 3 Baiomys          taylori             3
 4 Calamospiza      melanocorys        13
 5 Callipepla       squamata           16
 6 Campylorhynchus  brunneicapillus    23
 7 Chaetodipus      penicillatus      382
 8 Crotalus         scutalatus          1
 9 Crotalus         viridis             1
10 Dipodomys        merriami         5675
# ℹ 26 more rows
Semantic errors
Let’s go back to our rodent analysis. We would like to subset the
data to include only the Rodent taxon (as opposed to the
other taxa included in the dataset: Bird, Rabbit, Reptile or NA). Let’s
quickly check to see how much data we’d be throwing out by doing so:
R
table(surveys$taxa)
OUTPUT
   Bird  Rabbit Reptile  Rodent
    300      69       4   16148
We’re interested in the rodents, and thankfully it seems like a majority of our observations will be maintained when subsetting to rodents. But wait… In the barplot above, we could clearly see that there were some NA values. Why don’t we see them here?
This is a new type of problem, called a semantic error: the R code ran without any error messages, but it produced an unexpected output. Because there is no error message, semantic errors can be sneaky and hard to notice!
We can’t use our first code first aid strategy here, since there is no error message to read. So let’s jump straight to strategy 2, reading the function documentation.
R
?table
OUTPUT
Help on topic 'table' was found in the following packages:

  Package               Library
  vctrs                 /home/runner/.local/share/renv/cache/v5/linux-ubuntu-jammy/R-4.5/x86_64-pc-linux-gnu/vctrs/0.7.3/2dcde2d30d3ad67bf1d3a37177457b87
  base                  /home/runner/.cache/R/renv/sandbox/linux-ubuntu-jammy/R-4.5/x86_64-pc-linux-gnu/9a444a72


Using the first match ...
The documentation for table provides some clues. The
“Usage” and “Arguments” sections show us an argument called
useNA that accepts “no”, “ifany”, and “always”, but it’s
not immediately apparent which one we should use to show our NA values.
When we look at “Examples”, we find something else that looks
helpful:
R
table(a)                 # does not report NA's
table(a, exclude = NULL) # reports NA's
Aha! So it looks like we can use exclude = NULL to
report NAs in our table. Let’s try that.
R
table(surveys$taxa, exclude = NULL)
OUTPUT
   Bird  Rabbit Reptile  Rodent    <NA>
    300      69       4   16148     357
Problem solved! Now the NA values show up in the table. We see that by subsetting to the “Rodent” taxa, we would losing about 357 NAs, which themselves could be rodents! However, in this case, it seems a small enough portion to safely omit. Let’s subset our data to the rodent taxon.
R
# Just rodents
rodents <- surveys %>% filter(taxa == "Rodent")
Exercise 2: Syntax vs. semantic errors
There are 3 lines of code below, and each attempts to create the same plot. Identify which produces a syntax error, which produces a semantic error, and which correctly creates the plot (hint: this may require you inferring what type of graph we’re trying to create!)
ggplot(rodents) + geom_bin_2d(aes(month, plot_type))ggplot(rodents) + geom_tile(aes(month, plot_type), stat = "count")ggplot(rodents) + geom_tile(aes(month, plot_type))
In this case, A correctly creates the graph, plotting as colors in the tile the number of times an observation is seen. It essentially runs the following lines of code:
R
rodents_summary <- rodents %>% group_by(plot_type, month) %>% summarize(count=n())
OUTPUT
`summarise()` has grouped output by 'plot_type'. You can override using the
`.groups` argument.
R
ggplot(rodents_summary) + geom_tile(aes(month, plot_type, fill=count))
B is a syntax error, and will produce the following error:
R
ggplot(rodents) + geom_tile(aes(month, plot_type), stat = "count")
ERROR
Error in `geom_tile()`:
! Problem while computing stat.
ℹ Error occurred in the 1st layer.
Caused by error in `setup_params()` at ggplot2/R/ggproto.R:197:17:
! `stat_count()` must only have an x or y aesthetic.
Finally, C is a semantic error. It does produce a plot, which is rather meaningless:
R
ggplot(rodents) + geom_tile(aes(month, plot_type))
The steps to identifying the problem and in code first aid matches what we’ve seen above. However, here seeing the problem arise in our code may be much more subtle, and comes from us recognizing output we don’t expect or know to be wrong. Even if the code is run, R may give us warning or informational messages which pop up when executing your code. Most of the time, however, it’s up to the coder to be vigilant and be sure steps are running as they should. Interpreting the problem may also be more difficult as R gives us little or no indication about how it’s misinterpreting our intent.
Generally, the more your code deviates from just using base R
functions, or the more you use specific packages, both the quality of
documentation and online help available from search engines and Googling
gets worse and worse. While base R errors will often be solvable in a
couple of minutes from a quick ?help check or a long online
discussion and solutions on a website like Stack Overflow, errors
arising from little-used packages applied in bespoke analyses might
merit isolating your specific problem to a reproducible example for
online help, or even getting in touch with the developers! Such
community input and questions are often the way packages and
documentation improves over time.
Identifying the problem
In the previous section, it was evident which function was causing a syntax or semantic error. But sometimes, identifying the problem may be trickier. It may be difficult to determine which lines or sections of code are producing the error.
Let’s take a look at another code example. Our goal: to see which k-rat species appear in different plot types over the years.
The misspelling of “Dipodomys” below is deliberate!
R
# Example: identifying a more complex error

# Just k-rats
krats <- rodents %>% filter(genus == "Dipadomys") #filter the dataset to just include the kangaroo rat genus

# plot a histogram of how many observations are seen in each plot type over an x axis of years.
ggplot(krats, aes(year, fill = plot_type)) +
  geom_histogram() +
  facet_wrap(~species)
ERROR
Error in `combine_vars()` at ggplot2/R/facet-wrap.R:186:5:
! Faceting variables must have at least one value.
Uh-oh. Another error here, when we try to make a ggplot. But what is “combine_vars?” And then: “Faceting variables must have at least one value” What does that mean?
This is not an easily interpretable error message from
ggplot, and our code looks like it should run.
This time we put the data argument in the right place, we
included aes(), and we didn’t misspell anything.
Considering this chunk of code, let’s take a step back. Is it
possible that we’re looking at the wrong code? What if the error isn’t
in the ggplot code itself? Let’s look at the krats dataset
to make sure it looks normal.
R
krats
OUTPUT
# A tibble: 0 × 13
# ℹ 13 variables: record_id <dbl>, month <dbl>, day <dbl>, year <dbl>,
#   plot_id <dbl>, species_id <chr>, sex <chr>, hindfoot_length <dbl>,
#   weight <dbl>, genus <chr>, species <chr>, taxa <chr>, plot_type <chr>
It’s empty! Something must have gone wrong not with
ggplot, but with the code we used to create the
krats object.
Strategy 4: Using print() to show information
We can use a print statement to see which genera are
included in the original rodents dataset.
R
print(rodents %>% count(genus))
OUTPUT
# A tibble: 12 × 2
   genus                n
   <chr>            <int>
 1 Ammospermophilus   136
 2 Baiomys              3
 3 Chaetodipus        382
 4 Dipodomys         9573
 5 Neotoma            904
 6 Onychomys         1656
 7 Perognathus        553
 8 Peromyscus        1271
 9 Reithrodontomys   1412
10 Rodent               4
11 Sigmodon           103
12 Spermophilus       151
This tells us two things. For one, we noticed that we have misspelled Dipodomys, which we can now fix.
Our print() call also tells us that we should expect a
data frame with 9573 values after subsetting to the genus
Dipodomys. This will be useful to check our work after fixing
the misspelling.
R
# Example: identifying a more complex error

# Just k-rats
krats <- rodents %>% filter(genus == "Dipodomys") #filter the dataset to just include the kangaroo rat genus (fixed misspelling)

# check dimensions of krats
dim(krats) # 9573, as expected!
OUTPUT
[1] 9573 13R
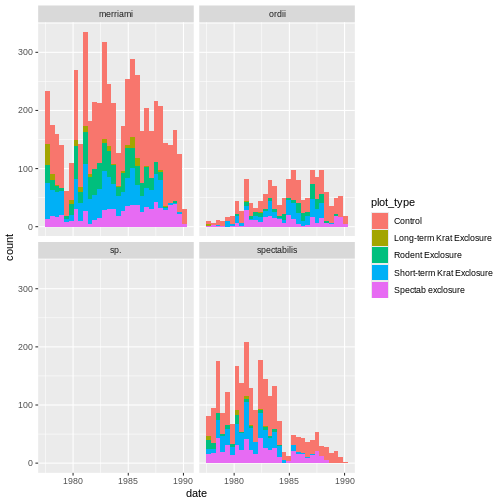
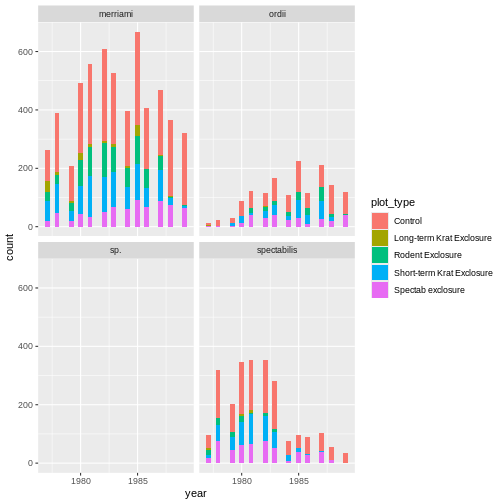
# plot a histogram of how many observations are seen in each plot type over an x axis of years.
ggplot(krats, aes(year, fill = plot_type)) +
  geom_histogram() +
  facet_wrap(~species)
OUTPUT
`stat_bin()` using `bins = 30`. Pick better value with `binwidth`.
Our improved code here looks good. Checking the dimensions of our
subsetted data frame using dim() function confirms we now
have all the Dipodomys observations, and our plot is looking
better.
Routinely printing out information about your dataset can be a good way to check that your intermediate results make sense.
Summary: Code first aid
Let’s update our list of code first aid strategies:
Code first aid strategies, detailed version
- Identify the problem area
- add print statements immediately upstream or downstream of problem areas
- check the desired output from functions
- see whether any intermediate output can be further isolated and examined separately
- Act on parts of the error we can understand
- interpreting error messages
- changing input to a function
- checking on the control flow of code (e.g. for loops, if/else)
- Reading the R documentation for relevant functions
- reading the documentation’s Description, Usage, Arguments, Details
- testing out code from the Examples section
- Quick online help with a search engine / generative LLM
- Copying error messages for more interpretable explanations
- Describing your error in the hopes of an already-solved solution
- Seeing if an LLM generates equivalent error-free code solving the same goal
We can now understand these steps as a continuous cycle of zeroing in on the problem more and more precisely. Whenever one of the first aid steps helps us identify a part of the code that is failing, we can zoom in on that piece of code and restart the checklist.
If the first aid steps are enough to solve the problem, great! If not, we can stop trying once we get stuck or don’t understand anymore how the code is failing. At that point, we can isolate the specific code area and use it to create a reprex in order to get help from someone else. We’ll delve more into the process of creating a reprex in the next episode.
Exercise 3: Isolating the problem
The following lines of code are not working correctly.
A. What type of error is this? B. Using the toolbox of code first aid strategies, can you isolate the problem area?
R
# Goal: run a chi square test to see whether kangaroo rat observations in the `control` plot type differ significantly between different plot_ids (hopefully not!)

control_plot_data <-  krats %>% filter(plot_type == "Control")

n_control_plots <- length(control_plot_data$plot_id)
exp_proportions <- rep(1/n_control_plots, n_control_plots)

plot_counts <- control_plot_data %>% group_by(plot_id) %>% summarize(n = n())

# Chisq test -- do count values vary significantly by plot id?

chisq.test(plot_counts$n, p = exp_proportions)
ERROR
Error in chisq.test(plot_counts$n, p = exp_proportions): 'x' and 'p' must have the same number of elementsAn isolated version of the problem area might look like:
R
n_control_plots <- length(control_plot_data$plot_id)
exp_proportions <- rep(1/n_control_plots, n_control_plots)

# Chisq test -- do count values vary significantly by plot id?

chisq.test(plot_counts$n, p = exp_proportions)
ERROR
Error in chisq.test(plot_counts$n, p = exp_proportions): 'x' and 'p' must have the same number of elementsIf we decide to move the plot_counts line right after the first
control_plot_data line, as plot_counts seems to be calculated correctly.
Here, we can see there’s probably something wrong with the
p argument: exp_proportions is very long, much longer than
the number of control plots! Let’s solve the problem.
R
n_control_plots <- length(unique(control_plot_data$plot_id))
exp_proportions <- rep(1/n_control_plots, n_control_plots)

# Chisq test -- do count values vary significantly by plot id?

chisq.test(plot_counts$n, p = exp_proportions)
OUTPUT
	Chi-squared test for given probabilities

data:  plot_counts$n
X-squared = 79.977, df = 7, p-value = 1.392e-14
We can see that some plots have significantly more or fewer counts than others! Observations of kangaroo rats are not random – rather, some plots seem to attract the kangaroo rats more than others.
When should I prepare my code for a reprex?
If you’ve isolated the problem area and tried using code first aid strategies, but the error persists, it may be time to get some help.
In a classroom setting, we may be used to raising our hand, pointing at our code, and saying “I’m not sure what’s wrong.” But outside of the classroom, helpers have limited time, bandwidth, and requisite knowledge to help. That’s why reproducing the problem with a reproducible example is an essential skill to getting unstuck: it allows you to ask for expert help with a problem that’s clearly identified, self-contained, and reproducible, and allows the expert to quickly see whether they’ve got the requisite skills to answer your question!
Back to our analysis: Mickey tries to get unstuck
Back in the lab, Mickey is happily coding along, exploring the data. Let’s follow their analysis and see how they use code first aid and prepare the code for a reprex.
Mickey is interested in understanding how kangaroo rat weights differ across species and sexes, so they create a quick visualization.
R
# Barplot of rodent species by sex
ggplot(surveys, aes(x = species, fill = sex)) +
  geom_bar()
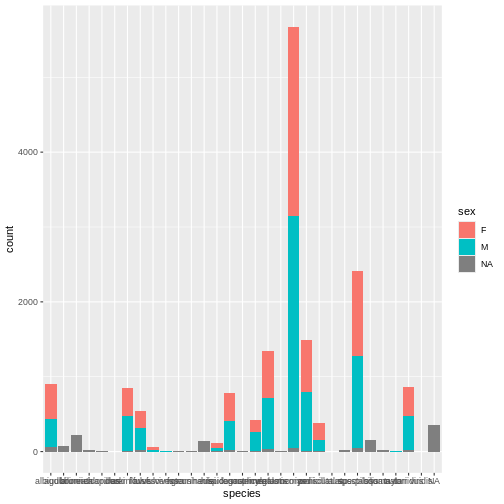
Whoa, this is really overwhelming! Mickey forgot that the dataset includes data for a lot of different species, not just kangaroo rats. Mickey is only interested in two kangaroo rat species: Dipodomys ordii (Ord’s kangaroo rat) and Dipodomys spectabilis (Banner-tailed kangaroo rat).
Mickey also notices that there are three categories for sex: F, M, and what looks like a blank field when there is no sex information available. For the purposes of comparing weights, Mickey wants to focus only rodents of known sex.
Mickey filters the data to include only the two focal species and only rodents whose sex is F or M.
R
# Filter to focal species and known sex
rodents_subset <- surveys %>%
  filter(species == c("ordii", "spectabilis"),
         sex == c("F", "M"))
Because these scientific names are long, Mickey also decides to add
common names to the dataset. They start by creating a data frame with
the common names, which they will then join to the
rodents_subset dataset:
R
# Add common names
common_names <- data.frame(species = unique(rodents_subset$species), common_name = c("Ord's", "Banner-tailed"))
common_names
OUTPUT
      species   common_name
1 spectabilis         Ord's
2       ordii Banner-tailed
But looking at the common names dataset reveals a
problem! The common names are not properly matched to the scientific
names. For example, the genus Ordii should correspond to Ord’s
kangaroo rat, but currently, it is matched with the Banner-tailed
kangaroo rat instead.
Challenge
- Is this a syntax error or a semantic error? Explain why.
- What “code first aid” steps might be appropriate here? Which ones are unlikely to be helpful?
Mickey re-orders the names and tries the code again. This time, it
works! The common names are joined to the correct scientific names.
Mickey joins the common names to rodents_subset.
R
# Try again, re-ordering the common names
common_names <- data.frame(species = sort(unique(rodents_subset$species)), common_name = c("Ord's", "Banner-Tailed"))
rodents_subset <- left_join(rodents_subset, common_names, by = "species")
Now, Mickey is ready to start learning about kangaroo rat weights.
They start by running a quick linear regression to predict
weight based on species and
sex.
R
# Explore k-rat weights
weight_model <- lm(weight ~ species + sex, data = rodents_subset)
summary(weight_model)
OUTPUT
Call:
lm(formula = weight ~ species + sex, data = rodents_subset)

Residuals:
     Min       1Q   Median       3Q      Max
-109.531   -7.991    3.239   11.469   48.469

Coefficients: (1 not defined because of singularities)
                   Estimate Std. Error t value Pr(>|t|)
(Intercept)          47.991      1.136   42.23   <2e-16 ***
speciesspectabilis   73.540      1.420   51.79   <2e-16 ***
sexM                     NA         NA      NA       NA
---
Signif. codes:  0 '***' 0.001 '**' 0.01 '*' 0.05 '.' 0.1 ' ' 1

Residual standard error: 20.58 on 910 degrees of freedom
  (31 observations deleted due to missingness)
Multiple R-squared:  0.7466,	Adjusted R-squared:  0.7464
F-statistic:  2682 on 1 and 910 DF,  p-value: < 2.2e-16
The negative coefficient for common_nameOrd's tells
Mickey that Ord’s kangaroo rats are significantly less heavy than
Banner-tailed kangaroo rats.
But something is wrong with the coefficients for sex. Why are there
NA values for sexM? Let’s directly visualize weight by
species and sex to see.
R
# Weight by species and sex
rodents_subset %>%
  ggplot(aes(y = weight, x = species, fill = sex)) +
  geom_boxplot()
WARNING
Warning: Removed 31 rows containing non-finite outside the scale range
(`stat_boxplot()`).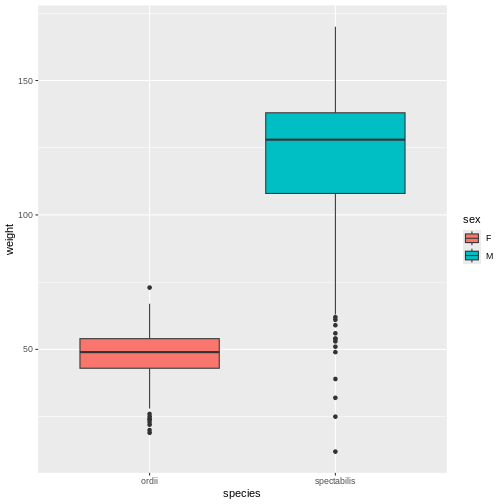
When Mickey visualizes the data, they see a problem in the graph, too. As the model showed, Ord’s kangaroo rats are significantly smaller than Banner-tailed kangaroo rats. But something is definitely wrong! Because the boxes are colored by sex, we can see that all of the Banner-tailed kangaroo rats are male and all of the Ord’s kangaroo rats are female. That can’t be right! What are the chances of catching all one sex for two different species?
To verify that the problem comes from the data, not from the plot
code, Mickey creates a two-way frequency table, which confirms that
there are no observations of female spectabilis or male
ordii in rodents_subset. Something definitely
seems wrong. Those rows should not be missing.
R
# Subsetted dataset
table(rodents_subset$sex, rodents_subset$species)
OUTPUT
    ordii spectabilis
  F   333           0
  M     0         610
To double check, Mickey looks at the original dataset.
R
# Original dataset
table(rodents$sex, rodents$species)
OUTPUT
    albigula eremicus flavus fulvescens fulviventer harrisi hispidus
  F      474      372    222         46           3       0       68
  M      368      468    302         16           2       0       42

    leucogaster maniculatus megalotis merriami ordii penicillatus  sp.
  F         373         160       637     2522   690          221    4
  M         397         248       680     3108   792          155    5

    spectabilis spilosoma taylori torridus
  F        1135         1       0      390
  M        1232         1       3      441
Not only were there originally males and females present from both ordii and spectabilis, but the original numbers were way, way higher! It looks like somewhere along the way, Mickey lost a lot of observations.
While we don’t have the time today, let’s assume Mickey worked their way through the code first aid steps, but weren’t able to solve the problem.
They decide to return to Remy’s road map to figure out what to do next.

Since code first aid was not enough to solve this problem, it looks like it’s time to ask for help using a reprex.
- The first step to getting unstuck is identifying a problem, isolating the problem area, and interpreting the problem
- Often, using “code first aid” – acting on error messages, looking at data, inputs, etc., pulling up documentation, asking a search engine or LLM, can help us to quickly fix the error on our own.
- If code first aid doesn’t work, we can ask for help and prepare a reproducible example (reprex) with a defined problem and isolated code
- We’ll cover future steps to prepare a reproducible example (reprex) in future episodes.