Asking your question
Last updated on 2026-05-12 | Edit this page
Overview
Questions
- How can I verify that my example is reproducible?
- How can I easily share a reproducible example with a mentor or helper, or online?
- What information should I include when asking a question?
Objectives
- Use the {reprex} package to test whether an example is reproducible.
- Use the {reprex} package to format reprexes for posting online.
- Understand the benefits and drawbacks of different help forums.
- Have a road map to follow when posting a question to make sure it’s a good question.
- Understand what the {reprex} package does and doesn’t do.
In the previous episodes, we have worked on creating a minimal reproducible example, also known as a “reprex”, to help our researcher friend Mickey debug a problem with their code.
We learned how to 1) identify the problem and try some preliminary fixes, 2) minimize the code, and 3) include a minimal dataset.
In this episode, we will introduce a tool, the reprex package, that we can use to verify that we’ve successfully created a minimal reproducible example. The {reprex} package will also help format the code nicely for posting online or sending to a colleague.
When preparing to share a reprex with other people, it is important to remember three principles:
- Reproducibility
- Formatting
- Context
1. Reproducibility
Haven’t we already talked a lot about reproducibility?
Yes! We have discussed variables and packages, minimal datasets, and making sure that the problem is meaningfully replicated by the data that you choose. But there are some reasons that a code snippet that appears reproducible in your own R session might not actually be runnable by someone else.
You forgot to account for the origins of some functions and/or variables. We went through our code methodically, but what if we missed something? It would be nice to confirm that the code is as self-contained as we thought it was.
Your code depends on some particular characteristic of your R or RStudio environment that is not the same as your helper’s environment. For example, you might be using an older version of a package, and the problem could be fixed by reinstalling a newer version. Another package you have loaded could have a function with a conflicting name. Maybe something is up with your operating system, time zone, R version, or RStudio preferences that a helper can’t necessarily replicate.
Checking all of these possible causes of errors feels overwhelming, and it may not be obvious how to do it. Even experienced R coders do not always feel comfortable changing their RStudio settings, managing package versions, or accessing hidden configuration files.
Especially for complex problems, it is useful to have a way to double check that our painstakingly-prepared reprexes are actually minimal and reproducible, without manually testing out every contingency in R!
Luckily, the {reprex} package will help you test your reprexes in a clean, isolated environment to make sure they’re actually reproducible.
The most important function in the reprex package is
called reprex(), and using it looks a little different from
functions in many other packages. reprex() automatically
recognizes code that you have copied to your computer’s
clipboard and uses it to create a nicely formatted
reprex, which it puts onto the clipboard for you to paste elsewhere.
Because this happens invisibly, it can be a little hard to keep track
of. Here’s what’s happening behind the scenes.
[DIAGRAM OF THE CLIPBOARD HERE]
Your computer uses the clipboard every time you copy and paste
something! What makes reprex() different is that it
automatically reads and writes from the keyboard; you don’t have to
manually paste the code into the reprex() function.
Let’s try it out. We’ll first create a very minimal reproducible example, such as this one from the reprex package documentation.
R
y <- 1:4
mean(y)
OUTPUT
[1] 2.5To turn this code into a reprex, we can highlight the code and copy
it to your clipboard. (e.g. Cmd + C on Mac, or
Ctrl + C on Windows).
Finally, in your console, type reprex(). Leave the
parentheses empty. You don’t have to paste anything. Hit
Enter/Return.
# (with the target code snippet copied to your clipboard already...)
# In the console:
reprex()
reprex will grab the code that you copied to your
clipboard and run that code in an isolated environment. It will
return a nicely formatted reproducible example that includes your code
and and any results, plots, warnings, or errors generated.
Callout: The reprex package
workflow
The reprex package workflow takes some getting used to.
Instead of copying your code into the function, you simply copy
it to the clipboard (a mysterious, invisible place to most of us) and
then let the blank, empty reprex() function go over to the
clipboard by itself and find it.
And then the completed, rendered reprex replaces the original code on the clipboard and all you need to do is paste, not copy and paste.
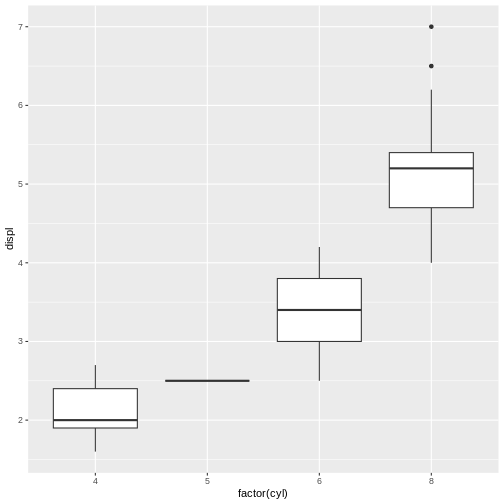
Let’s practice this one more time. Here’s some code that makes a boxplot:
R
library(ggplot2)
library(dplyr)
mpg %>%
  ggplot(aes(x = factor(cyl), y = displ))+
  geom_boxplot()

Once again, we can highlight the code snippet, copy it to the
clipboard, and then run reprex() in the console.
# In the console:
reprex()
The result, which was automatically placed onto my clipboard and which I pasted here, looks like this:
R
library(ggplot2)
library(dplyr)
#>
#> Attaching package: 'dplyr'
#> The following objects are masked from 'package:stats':
#>
#>     filter, lag
#> The following objects are masked from 'package:base':
#>
#>     intersect, setdiff, setequal, union
mpg %>%
  ggplot(aes(x = factor(cyl), y = displ))+
  geom_boxplot()

Created on 2024-12-29 with reprex v2.1.1
Nice and neat! It even includes the plot produced, so I don’t have to take screenshots and figure out how to attach them to an email.
{reprex} as a debugging collaborator
The formatting is great, but {reprex} really shines when you treat it as a helpful collaborator in your process of building a reproducible example.
Exercise 1: Using {reprex} to find problems with a minimal reproducible example
If you run the code from the previous example without running the
library(ggplot2)line, does it still work? Why?Make a prediction: What will happen if you forget to include
library(ggplot2)in your minimal reproducible example? Try it with the {reprex} package and see. Why did this happen? ::: solution
R
library(dplyr)
#>
#> Attaching package: 'dplyr'
#> The following objects are masked from 'package:stats':
#>
#>     filter, lag
#> The following objects are masked from 'package:base':
#>
#>     intersect, setdiff, setequal, union
mpg %>%
  ggplot(aes(x = factor(cyl), y = displ))+
  geom_boxplot()
#> Error in ggplot(., aes(x = factor(cyl), y = displ)): could not find function "ggplot"
Created on 2024-12-29 with reprex v2.1.1
:::
We get an error message indicating that R cannot find the function
ggplot! That’s because we forgot to load the
ggplot2 package in the reprex.
This happened even though we had ggplot2 already loaded
in our own current RStudio session. reprex deliberately
ignores any packages already loaded, running the code in a clean,
isolated R session that’s different from the R session we’ve been
working in. This simulates the experience of someone else trying to
run your reprex on their own computer.
Testing it out
Now that we’ve met our new reprex-making collaborator, let’s use it to test out the reproducible example we created in the previous episode.
Here’s the code we wrote:
R
# Mickey's reprex (1 approach)

# Required packages to run the code
library(readr)
library(dplyr)

set.seed(1) # ensures accurate data replication

# Create a mock dataset
sample_data <- data.frame(
  record_id = 1:10,
  sex = sample(c('M','F', NA), 10, replace=T)
)

# The problematic code snippet
sample_subset <- sample_data %>%
  filter(sex == c("F", "M"))

# Subsetted sample dataset - how many individuals for each sex?
table(sample_subset$sex)
It’s time to verify if our example is actually reproducible! Let’s
copy it to the clipboard and run reprex().
# In the console:
reprex()
It worked!
R
# Mickey's reprex (1 approach)

# Required packages to run the code
library(readr)
library(dplyr)
#>
#> Attaching package: 'dplyr'
#> The following objects are masked from 'package:stats':
#>
#>     filter, lag
#> The following objects are masked from 'package:base':
#>
#>     intersect, setdiff, setequal, union

set.seed(1) # ensures accurate data replication

# Create a mock dataset
sample_data <- data.frame(
  record_id = 1:10,
  sex = sample(c('M','F', NA), 10, replace=T)
)

# The problematic code snippet
sample_subset <- sample_data %>%
  filter(sex == c("F", "M"))

# Subsetted sample dataset - how many individuals for each sex?
table(sample_subset$sex)
#>
#> F
#> 1
Created on 2025-09-11 with reprex v2.1.1
Now we have a beautifully-formatted reprex that includes runnable code and all the context needed to reproduce the problem.
This also would have been a good way for Mickey to discover that they needed to create minimal data earlier! Look what would have happened if we had put the example from the end of episode 3 into {reprex}:
R
library(readr)
library(dplyr)
#>
#> Attaching package: 'dplyr'
#> The following objects are masked from 'package:stats':
#>
#>     filter, lag
#> The following objects are masked from 'package:base':
#>
#>     intersect, setdiff, setequal, union

surveys <- read_csv("data/surveys_complete_77_89.csv")
#> Error: 'data/surveys_complete_77_89.csv' does not exist in current working directory ('/private/var/folders/xy/lqbp515s27q8v1drkll9gynw0000gr/T/RtmpJX7W20/reprex-76216582aaa-irate-booby').

# Filter to known sex
rodents_subset <- surveys %>%
  filter(sex == c("F", "M"))
#> Error: object 'surveys' not found

# Subsetted dataset
table(rodents_subset$sex, rodents_subset$species)
#> Error: object 'rodents_subset' not found

# Original dataset
table(surveys$sex, surveys$species) # still missing a lot of rows!
#> Error: object 'surveys' not found
Created on 2025-09-11 with reprex v2.1.1
Including information about your R session
Another nice thing about {reprex} is that you can choose to include
information about your R session, in case your error has something to do
with your R settings rather than the code itself. You can do that using
the session_info argument to reprex().
For example, try running the following reprex, setting session_info = TRUE, and observe what happens.
R
library(ggplot2)
library(dplyr)
mpg %>%
  ggplot(aes(x = factor(cyl), y = displ))+
  geom_boxplot()

# In the console:
reprex(session_info = TRUE)
2. Formatting
Two things about the formatting of the {reprex} output make it even easier to ask for help.
Displaying output
First, you’ll notice that the formatted reprex contains not only the
lines of code, but also their output. The output lines are commented out
and prefaced with a >, to differentiate them from the
code.
For example:
R
y <- 1:4
mean(y)
#> [1] 2.5
Created on 2025-09-11 with reprex v2.1.1
The whole point of a reprex is to allow the helper to run the code for themselves–if they need or want to. But when we also display the output, we make things even easier for the helper, by giving them as many tools as possible to understand our code. In some cases, the helper might even be able to diagnose the problem without running the code, just by seeing the output.
Different output formats
Second, {reprex} can provide the output in several different formats. By default, the reprex is rendered in markdown, which can easily be copied and pasted into many sites or apps. However, different places have slightly different formatting conventions for markdown. {reprex} allows you to customize the output of your reprex according to where you’re planning to post it.
The default, venue = "gh", gives you “GitHub-Flavored Markdown”,
perfect for posting on GitHub. There are other markdown “flavors” for
Slack, StackOverflow, and others.
There are some other formats, too. Specifying
venue = "r" gives you a runnable R script, with commented
output interleaved with pieces of code.
Mickey isn’t planning to post their reprex on any forums; they just
want to send it to Remy as an R script. Therefore, they render their
reprex using venue = "r".
# Mickey's reprex (1 approach)

# Required packages to run the code
library(readr)
library(dplyr)
#>
#> Attaching package: 'dplyr'
#> The following objects are masked from 'package:stats':
#>
#>     filter, lag
#> The following objects are masked from 'package:base':
#>
#>     intersect, setdiff, setequal, union

set.seed(1) # ensures accurate data replication

# Create a mock dataset
sample_data <- data.frame(
  record_id = 1:10,
  sex = sample(c('M','F', NA), 10, replace=T)
)

# The problematic code snippet
sample_subset <- sample_data %>%
  filter(sex == c("F", "M"))

# Subsetted sample dataset - how many individuals for each sex?
table(sample_subset$sex)
#>
#> F
#> 1Exercise 2: Exploring reprex formatting
Prepare a simple reprex. Render it using
reprex(venue = ). Try a few different formats. You can find
more information about the different formats in the help file:
?reprex.
Callout: reprex can’t do
everything for you
People often mention {reprex} as a useful tool for creating reproducible examples, but it can’t do the work of crafting the example for you! The package doesn’t locate the problem, pare down the code, create a minimal dataset, or automatically include package dependencies.
A better way to think of {reprex} is as a tool to check your work as you go through the process of creating a reproducible example, and to help you polish up the result.
3. Context
So, we’ve established that a good minimal reproducible example should be minimal, reproducible, and formatted nicely so that helpers can easily access and read it.
But there’s one more thing to consider. Helpers won’t be thrilled if they’re presented with some code without any indication of what you’re trying to do, what went wrong, and what kind of help you need.
Let’s give them some context!
When providing context with your reprex, you should:
- Tell the helper a little bit about your problem. One sentence should be enough. What domain are you working in? What are these data about? What do the relevant variables mean?
This is particularly important if you have provided a subset of your own data instead of creating a minimal dataset from scratch. Your helper will need to interpret the column names and understand what type of data they are looking at.
Make sure to keep it minimal. Provide only the information that’s necessary to understand the problem at hand.
- Explain what you expected to happen, or what you were trying to achieve, and how it is different from what happened instead.
Remember how we diagnosed the problem in the previous episodes, identifying which lines of code showed us that something was wrong? Let’s explain to the helper what has gone wrong.
The contrast between what happened and what was supposed to happen is particularly important for semantic errors, in which the “error” is not always obvious when running the code. The code ran–but you have decided that the output is “wrong” somehow, or that it “didn’t work”. Why? How do you know that? Your helper needs to know that what you got was not what you expected, and they need to know what you expected in order to help you achieve that outcome.
Here’s an example where context is key. Imagine you’re a helper, and
someone sends you the following reprex, which includes the code to make
a boxplot from the mpg dataset.
R
library(ggplot2)
library(dplyr)
#>
#> Attaching package: 'dplyr'
#> The following objects are masked from 'package:stats':
#>
#>     filter, lag
#> The following objects are masked from 'package:base':
#>
#>     intersect, setdiff, setequal, union
mpg %>%
  ggplot(aes(x = class, y = displ, color = class))+
  geom_boxplot()

Created on 2025-09-11 with reprex v2.1.1
This example is minimal and reproducible–it’s brief, it loads all necessary packages, it uses a built-in dataset, and it is formatted nicely. But there is no obvious error! Clearly, the person asking for help has encountered a semantic error; their code runs, but it doesn’t produce what they expect. But unless they tell you how this plot differs from what they wanted, you won’t be able to help.
You ask for further context, and eventually the person seeking help replies: “I want to make a boxplot where each of the categories has its own color. But even though I set color = class here, only the outlines of the boxplots got colored in, and the inside is still white. How do I change this so that the whole box is colored in?”
Now that you know what the problem is, you can start trying to help.
Exercise 3: What makes a good description?
For each of the following reprexes, improve the description given.
“I’m trying to plot the displacements of different cars. I made this boxplot, but the boxes are showing up in the wrong order. How do I fix this? Here is my minimal reproducible example.”
R
library(ggplot2)
library(dplyr)
mpg %>%
  ggplot(aes(x = class, y = displ, color = class))+
  geom_boxplot()
“I’m working with this data about cars. The class column
refers to the type of car–for example,”compact” class means that the car
is quite small, while “pickup” would be a pickup truck. For each car, I
also have information about the city and highway mileage, and the
transmission, and the number of cylinders, as well as the displacement.
This dataset has 234 rows and 11 columns, although this is an example
dataset because my real dataset is much larger and has more like 500,000
rows. Anyway, in this example, I want to make a boxplot of displacement
where each of the categories has its own color. But even though I set
color = class here, only the outlines of the boxplots got colored in,
and the inside is still white. How do I make the inside a different
color? Here’s a reprex.”
R
library(ggplot2)
library(dplyr)
mpg %>%
  ggplot(aes(x = class, y = displ, color = class))+
  geom_boxplot()

“Help, my code isn’t working! It says I have too many elements. I made a reprex so you can see the data and the error message. I hope that’s helpful. Thank you so much!”
R
library(ggplot2)
table(mpg)
ERROR
Error in table(mpg): attempt to make a table with >= 2^31 elementsLet’s help Mickey add some context to their reprex so they’ll be ready to send it to Remy.
Exercise 4: Adding context
Working with the person next to you, write a brief description of Mickey’s problem that they could include with their reprex when they post it online.
Make sure that the description gives a little bit of background, describes what Mickey was trying to achieve, and describes what happened instead.
When you’re done, compare notes between the groups and see if you can come up with a final reprex for Mickey!
Exercise 5: Putting it all together
Create a reprex (using Mickey’s example or your own brief idea). Post
it, following your instructor’s directions. Be sure to provide
appropriate context and use the appropriate venue
argument.
- The
reprexpackage makes it easy to format and share your reproducible examples. - The
reprexpackage helps you test whether your reprex is reproducible, and also helps you prepare the reprex to share with others. - Following a certain set of steps will make your questions clearer and likelier to get answered.