What is a reprex and why is it useful?
Last updated on 2026-05-12 | Edit this page
Overview
Questions
- What steps can you take to solve problems in your code?
- What is a minimal reproducible example?
- Why are minimal reproducible examples important?
- What is the Portal Project dataset?
Objectives
- Describe a minimal reproducible example and its requirements.
- Recognize how creating a minimal reproducible example can help you solve problems in your code.
- List the key steps to creating a minimal reproducible example.
- Explain the benefits of creating a minimal reproducible example both for you and for others.
- Load in the rodent survey data and briefly explain its contents.
One of the most frustrating parts of learning to code is getting stuck and not knowing what to do! Maybe R gives you an angry red error message you don’t understand, or your code doesn’t seem to be doing what you were expecting and you don’t know why. Maybe you try to use Google to find answers but you can’t quite find the same problem out there. What to do?
Luckily, there are many people in the R and data science communities who are happy to help. However, in order for them to do so, you must give them the right information. Figuring out how to ask a good question can be hard.
Many helpers or forums may ask you to provide example data or a minimal reproducible example (commonly abbreviated as a “reprex”). What even is that? Wouldn’t it be nice if you could just hand over your computer so a helper can see exactly what is happening? That’s exactly what the reprex is for.
What is a reprex?
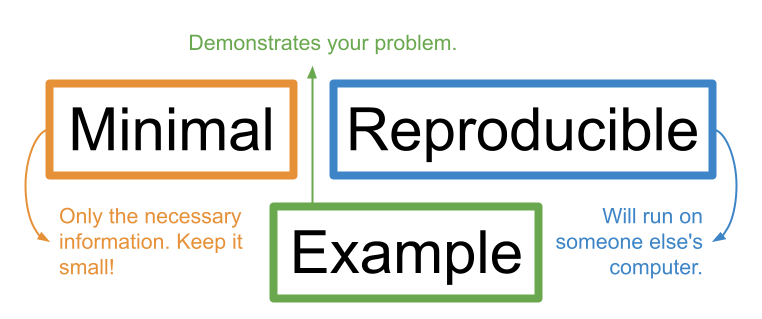
A reprex is essentially a simplified version of your problematic code that clearly demonstrates the problem you are facing (includes only the necessary information to show the problem, nothing more) and will run easily on anyone’s computer.
The Tidyverse documentation puts it simply:
“The goal of a reprex is to package your problematic code in such a way that other people can run it and feel your pain. Then, hopefully, they can provide a solution and put you out of your misery.” - Get help! (Tidyverse)
Why use a reprex?
Reprexes are very important tools to get help when you’re stuck on a coding problem. You may be asked to provide a reprex when you’re working with a statistical consultant (often available at universities) or when posting a question to online help forums (such as StackOverflow or the Posit Community).
As the name suggests, a minimal reproducible example needs to be minimal and reproducible.
Stripping the code and data down to their essential (minimal) parts makes it easy for a helper to zero-in on what might be going wrong.
Making your example reproducible allows a helper to run your code on their own computer so they can easily “tinker” with it to fix it. This makes them more likely to help you.
Helpers
There are lots of people who might help you with your code: friends, colleagues, mentors, or total strangers online. In this lesson, we will use the term “helper” to refer to the person who is helping you to debug your code. Helpers are the target audience for your minimal reproducible example.
But there’s another hidden reason to make a reprex! The process of making a reprex often leads to a better understanding of your own code. Therefore, you might end up solving the problem yourself without asking for help.
Rubber duck debugging
The phenomenon of solving one’s own problem during the process of trying to explain it to someone else is often called “rubber duck debugging.” This is a reference to a story about programmers who would explain the problem they were having with their code to a rubber duck they would keep on their desk. Jenny Bryan refers to reprexes as “basically the rubber duck in disguise,” because they force you to unpack your problem to explain it more clearly.
Jenny Bryan shares many other insights about reprexes in her 2018 talk “Help me help you: Creating reproducible examples.”

Making a reprex can be an excellent learning opportunity, but the process can feel daunting when you are not sure where to begin. In this lesson, we will walk through a step by step roadmap you can use whenever you feel stuck, including some first steps for debugging your code and the process of creating a reprex. We’ll talk about each of the steps and provide a workflow that you can follow when you get stuck in the future. At the end, we’ll introduce you to the {reprex} package, a useful tool for creating good minimal reproducible examples. By the end of the lesson you will have gained a better understanding of how to approach error and warning messages, you will feel more confident in your ability to make a reprex, and you will feel more comfortable asking for formal help.
Meet Mickey, your learning companion
Mickey is an ecology grad student who just joined a new lab. Mickey’s lab has been working for many years with data from the Portal Project, a long-term research study of rodents in Portal, Arizona. Mickey would like to explore this data for their research, so they reach out to Remy, a fifth-year grad student who is very familiar with this project. To get Mickey started, Remy sends Mickey an archival dataset of rodent surveys from 1977-1989, and tells Mickey to “play around” with the data in RStudio to get familiar with it.
Mickey has some past experience in R. They attended the “Data Analysis and Visualization in R for Ecologists” Carpentries workshop, and they feel comfortable with the fundamentals of coding in R. Still, Mickey is a little rusty and nervous about their skills and the unfamiliar data.
Prerequisites and target audience
This workshop assumes some prior experience with working in R and RStudio. We will assume you’ve taken the equivalent of the Data Analysis and Visualization in R for Ecologists workshop and are comfortable with basic commands, and we won’t necessarily explain every line of code in detail.
If you’re much more experienced in R, this workshop is still for you! Even expert coders may not always know how to get unstuck. We hope this workshop will be useful to people with a variety of coding backgrounds.
Mickey starts by loading the data so they can begin to explore it. They also load the {tidyverse}, a set of packages that will be useful for wrangling and visualizing the data.
Let’s go over to RStudio. Make sure that you’re in the RStudio project that you created for this lesson, and that you’ve downloaded the data as a csv and saved it in the “data/” folder.
As a reminder: Make sure you’re coding in your RStudio project. You can open the project you created by double-clicking the “.Rproj” file from your Finder/File Explorer. Or, from inside of RStudio, navigate to the upper right corner of the screen, click on the blue cube icon, choose “Open Project”, and then select your project to open a new session of RStudio.
Now, we can load in the dataset with the following code:
R
# Loading the tidyverse package
library(tidyverse)
R
# Uploading the dataset that is currently saved in the project's data folder
surveys <- read_csv("data/surveys_complete_77_89.csv")
OUTPUT
Rows: 16878 Columns: 13
── Column specification ────────────────────────────────────────────────────────
Delimiter: ","
chr (6): species_id, sex, genus, species, taxa, plot_type
dbl (7): record_id, month, day, year, plot_id, hindfoot_length, weight

ℹ Use `spec()` to retrieve the full column specification for this data.
ℹ Specify the column types or set `show_col_types = FALSE` to quiet this message.
Mickey loads in the dataset and takes a look at it to find out what type of data was collected during these surveys.
R
# Take a look at the data
glimpse(surveys)

# or you can use
str(surveys)
OUTPUT
Rows: 16,878
Columns: 13
$ record_id       <dbl> 1, 2, 3, 4, 5, 6, 7, 8, 9, 10, 11, 12, 13, 14, 15, 16,…
$ month           <dbl> 7, 7, 7, 7, 7, 7, 7, 7, 7, 7, 7, 7, 7, 7, 7, 7, 7, 7, …
$ day             <dbl> 16, 16, 16, 16, 16, 16, 16, 16, 16, 16, 16, 16, 16, 16…
$ year            <dbl> 1977, 1977, 1977, 1977, 1977, 1977, 1977, 1977, 1977, …
$ plot_id         <dbl> 2, 3, 2, 7, 3, 1, 2, 1, 1, 6, 5, 7, 3, 8, 6, 4, 3, 2, …
$ species_id      <chr> "NL", "NL", "DM", "DM", "DM", "PF", "PE", "DM", "DM", …
$ sex             <chr> "M", "M", "F", "M", "M", "M", "F", "M", "F", "F", "F",…
$ hindfoot_length <dbl> 32, 33, 37, 36, 35, 14, NA, 37, 34, 20, 53, 38, 35, NA…
$ weight          <dbl> NA, NA, NA, NA, NA, NA, NA, NA, NA, NA, NA, NA, NA, NA…
$ genus           <chr> "Neotoma", "Neotoma", "Dipodomys", "Dipodomys", "Dipod…
$ species         <chr> "albigula", "albigula", "merriami", "merriami", "merri…
$ taxa            <chr> "Rodent", "Rodent", "Rodent", "Rodent", "Rodent", "Rod…
$ plot_type       <chr> "Control", "Long-term Krat Exclosure", "Control", "Rod…
spc_tbl_ [16,878 × 13] (S3: spec_tbl_df/tbl_df/tbl/data.frame)
 $ record_id      : num [1:16878] 1 2 3 4 5 6 7 8 9 10 ...
 $ month          : num [1:16878] 7 7 7 7 7 7 7 7 7 7 ...
 $ day            : num [1:16878] 16 16 16 16 16 16 16 16 16 16 ...
 $ year           : num [1:16878] 1977 1977 1977 1977 1977 ...
 $ plot_id        : num [1:16878] 2 3 2 7 3 1 2 1 1 6 ...
 $ species_id     : chr [1:16878] "NL" "NL" "DM" "DM" ...
 $ sex            : chr [1:16878] "M" "M" "F" "M" ...
 $ hindfoot_length: num [1:16878] 32 33 37 36 35 14 NA 37 34 20 ...
 $ weight         : num [1:16878] NA NA NA NA NA NA NA NA NA NA ...
 $ genus          : chr [1:16878] "Neotoma" "Neotoma" "Dipodomys" "Dipodomys" ...
 $ species        : chr [1:16878] "albigula" "albigula" "merriami" "merriami" ...
 $ taxa           : chr [1:16878] "Rodent" "Rodent" "Rodent" "Rodent" ...
 $ plot_type      : chr [1:16878] "Control" "Long-term Krat Exclosure" "Control" "Rodent Exclosure" ...
 - attr(*, "spec")=
  .. cols(
  ..   record_id = col_double(),
  ..   month = col_double(),
  ..   day = col_double(),
  ..   year = col_double(),
  ..   plot_id = col_double(),
  ..   species_id = col_character(),
  ..   sex = col_character(),
  ..   hindfoot_length = col_double(),
  ..   weight = col_double(),
  ..   genus = col_character(),
  ..   species = col_character(),
  ..   taxa = col_character(),
  ..   plot_type = col_character()
  .. )
 - attr(*, "problems")=<externalptr>
Looking over Mickey’s shoulder, Remy explains that the dataset is
made up of many individual rodent records (record_id). The
date of each record is given by the month,
day, and year columns.
The dataset includes data from a number of different study plots that
had different treatments applied: plot IDs are given by the
plot_id column, and the type of treatment is specified in
plot_type.
There is information about the genus and
species of each individual caught. There is a
species_id column that identifies the species of each
individual caught.
In addition, there is a column called taxa that contains
higher-level taxonomic information. Most of the observations are
rodents, but there are also some birds, rabbits, and reptiles.
R
table(surveys$taxa)
OUTPUT
   Bird  Rabbit Reptile  Rodent
    300      69       4   16148
For each individual caught, the field crew took weight,
sex and hindfoot_length measurements when
possible, so values are sometimes missing.
Overall, the dataset contains 16,878 rodent observations ranging across years from 1977 through 1989.
With a clear understanding of the data, Mickey is now free to explore on their own. However, Remy notices that Mickey still looks nervous and decides to share a tool they recently found useful: a roadmap to getting unstuck in R by making a reprex.

Remy’s roadmap outlines four key steps for making a reprex. It is also intended to help the user better understand their problem and potentially find a solution along the way. Remy follows these steps any time they get stuck while coding. Indeed, the first portion of the roadmap, which Remy likes to call “code first aid,” includes preliminary steps to help identify and diagnose the problem, such as determining the type of error, reading function documentation, interpreting error messages, and running through the code line by line.
Remy explains that sometimes, these first aid steps are enough to solve code problems. But if not, the rest of the roadmap will lead Mickey through strategies to better understand the problem and demonstrate it to others in a minimal reproducible example (“reprex”).
Remy emphasizes to Mickey that they are happy to keep helping, but they will be very busy trying to finish writing their dissertation. If Mickey can first follow the steps outlined in this roadmap, then Remy can more easily help with whatever Mickey is struggling to resolve.
With an introduction to the dataset and a roadmap to guide them if they get stuck, Mickey feels ready to start coding!
- Throughout this lesson, we will be walking through a “roadmap” to getting unstuck in R by creating a minimal reproducible example (“reprex”).
- A reprex is a simplified version of your problematic code that clearly demonstrates the problem you are facing and will run on anyone’s computer.
- A reprex should contain only the minimum required to replicate the problem from any device so that helpers can more easily tinker and debug your code.
- The process of building a reprex helps you better understand your code, your data, and your problem so that you will often find the solution yourself!
- The
surveysdataset includes records of rodents captured in a variety of experimental plots over a 12-year period, including some data about each rodent’s sex and morphology.