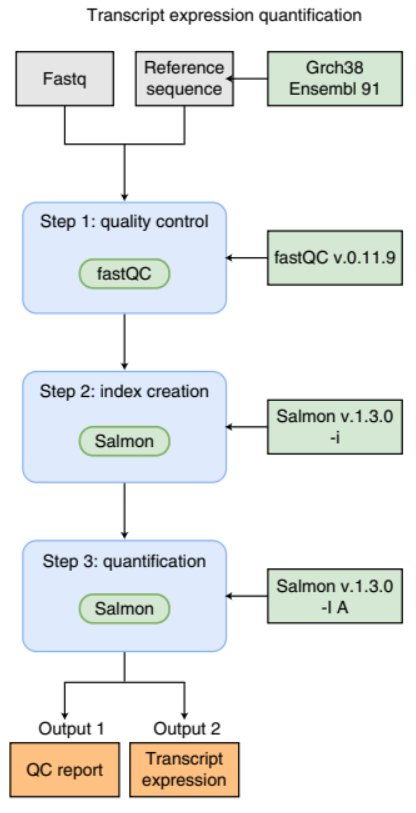
Image 1 of 1: ‘Flowchart illustrating a simple bioinformatics RNA-Seq pipeline for transcript expression quantification. The process begins with inputs at the top: 'Fastq' files, a 'Reference sequence', and 'Grch38 Ensembl 91' annotations. The first step is 'quality control', using 'fastQC' software version 0.11.9. The second step is 'index creation' with 'Salmon' software version 1.3.0 using the '-i' option. The third step is 'quantification', again with 'Salmon' version 1.3.0, this time using the '-l A' option. There are two outputs from this process: 'Output 1' is a 'QC report' and 'Output 2' is 'Transcript expression' data.’
An example of a simple bioinformatics RNA-Seq pipeline.
Figure 2
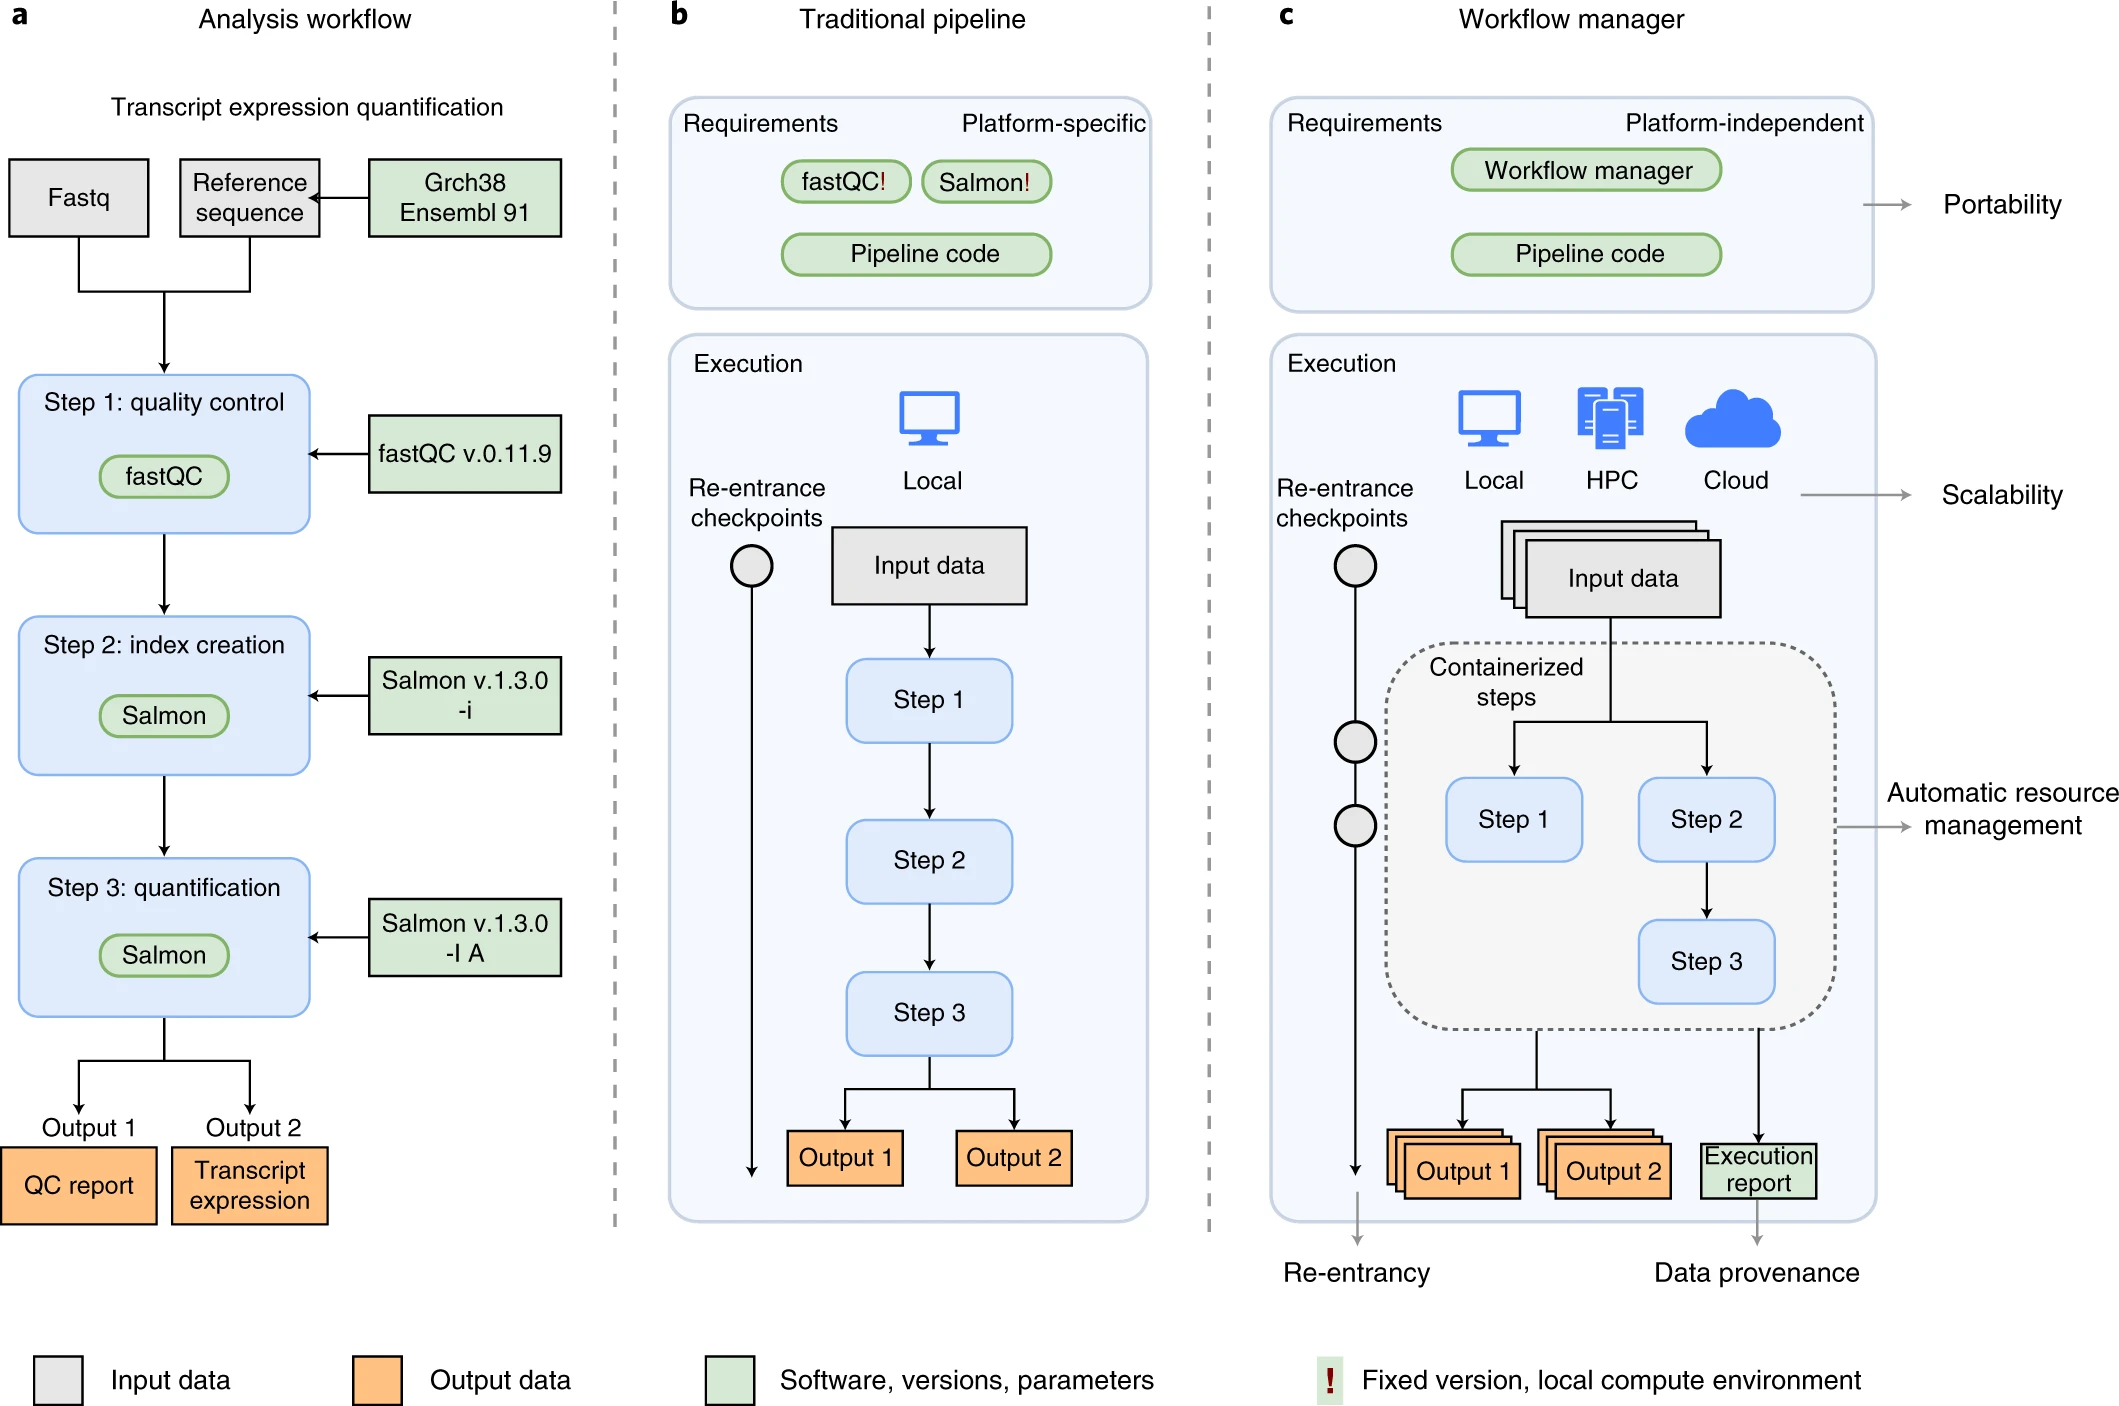
Image 1 of 1: ‘A comparison of three bioinformatics pipeline diagrams. Panel A shows an 'Analysis workflow' for transcript expression quantification with three main steps: 1) quality control using fastQC v0.11.9, 2) index creation with Salmon v.1.3.0, and 3) quantification also using Salmon v.1.3.0. Inputs include Fastq files, a Reference sequence, and Grch38 Ensembl 91, leading to outputs of a QC report and transcript expression data. Panel B illustrates a 'Traditional pipeline' emphasizing platform-specific requirements and local execution with steps leading to two outputs. Panel C depicts a 'Workflow manager', highlighting platform-independent requirements, portability, local and cloud execution options, scalability, and containerized steps for automatic resource management, leading to an output and an execution report. The color-coding indicates input data (gray), output data (yellow), and software, versions, parameters (green and blue)’
An example of differences between running a specific analysis
workflow using a traditional pipeline or a WfMS-based pipeline. Source:
Wratten, L., Wilm, A. & Göke, J. Reproducible, scalable, and
shareable analysis pipelines with bioinformatics workflow managers. Nat
Methods 18, 1161–1168 (2021). https://doi.org/10.1038/s41592-021-01254-9
Figure 3
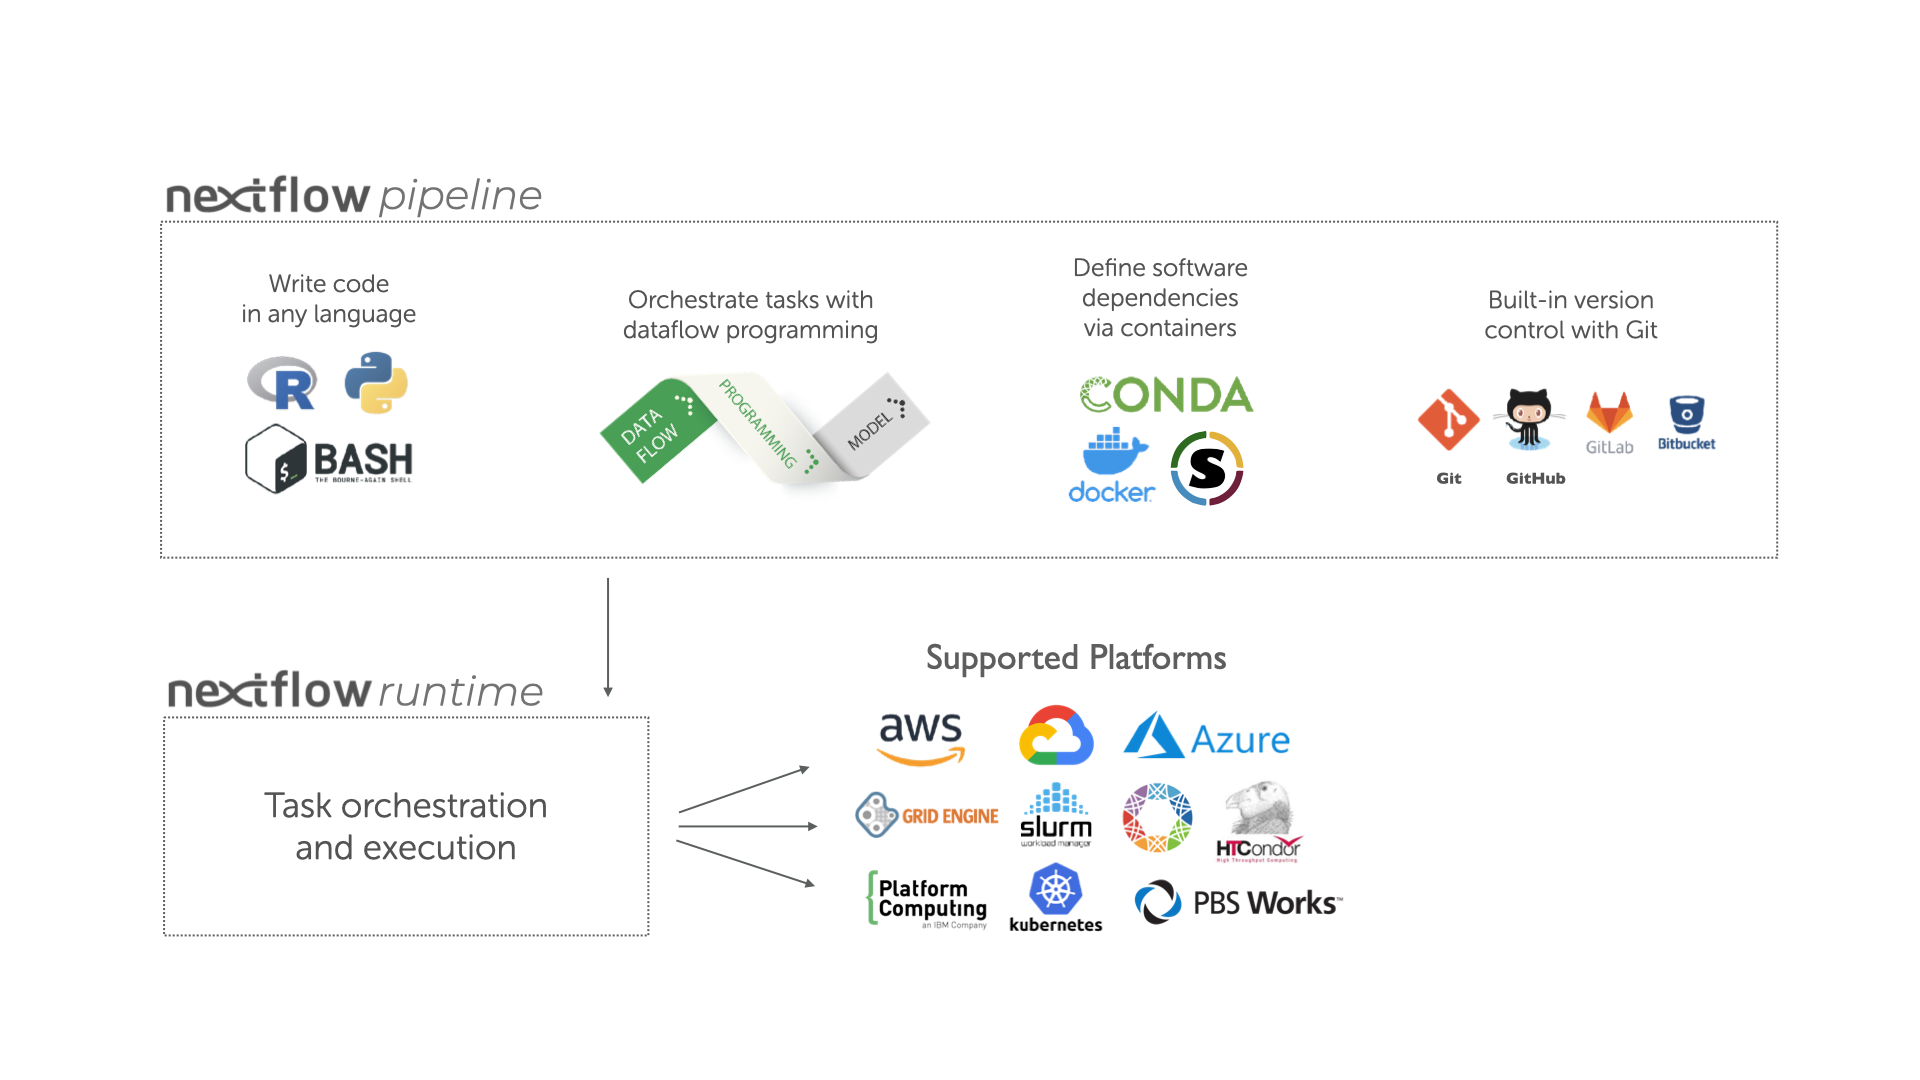
Image 1 of 1: ‘Infographic illustrating the components and supported platforms of a nextflow pipeline. The top section 'nextflow pipeline' is divided into three: writing code in any language (represented by R, Python, and Bash icons), orchestrating tasks with dataflow programming (represented by papers marked 'Data Flow' and 'Programming Model'), and defining software dependencies via containers (represented by Conda, Docker, and Singularity icons) and built-in version control with Git (represented by Git, GitHub, GitLab, and Bitbucket icons). Below, in the 'nextflow runtime' section, is 'Task orchestration and execution'. Arrows point downwards to the 'Supported Platforms' section, showcasing various platforms such as AWS, Google Cloud, Azure, Grid Engine, Slurm, HTCondor, Platform Computing, Kubernetes, and PBS Works.’
Overview of Nextflow core features.
Figure 4
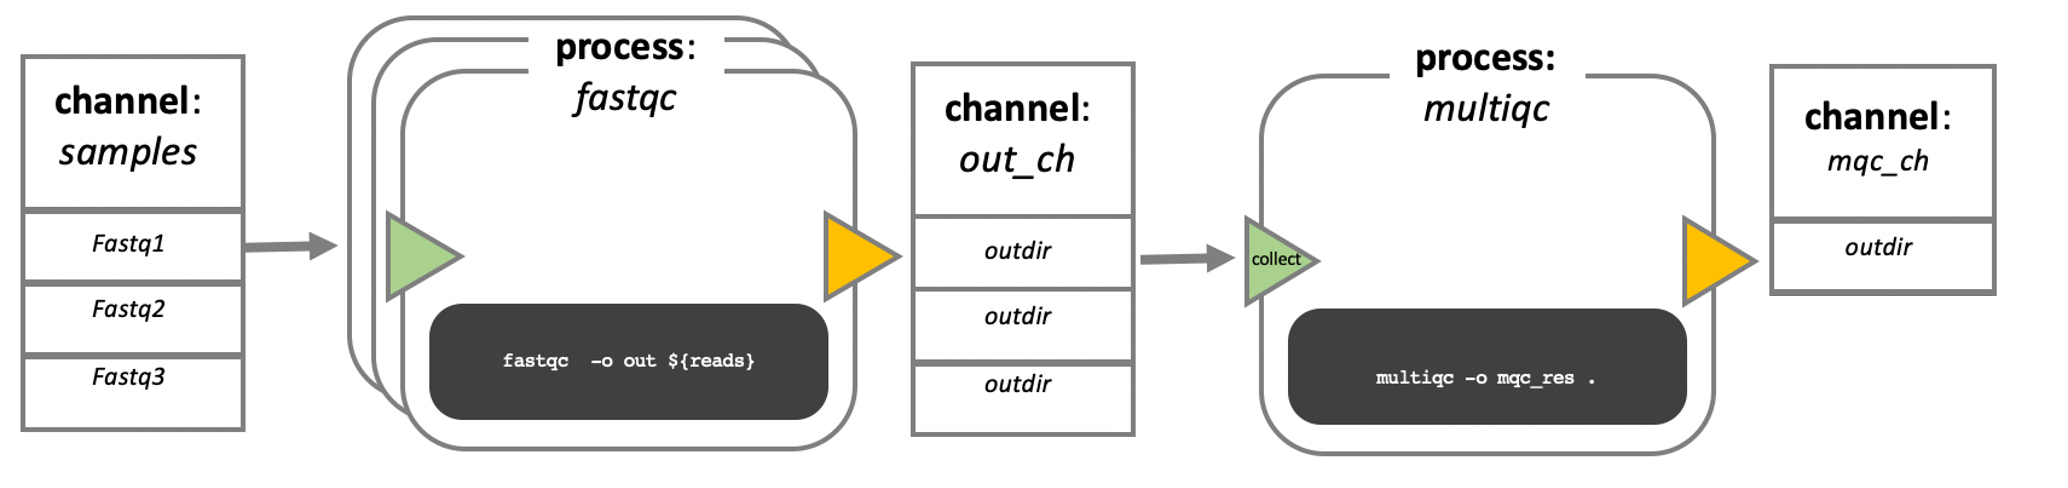
Image 1 of 1: ‘Diagram depicting part of a bioinformatics data processing workflow. On the left, there is a 'channel' labeled 'samples' containing three items: Fastq1, Fastq2, and Fastq3. This channel flows into a 'process' called 'fastqc' represented by a rounded rectangle containing the command 'fastqc -o out ${reads}'. The output of this process goes into a channel named 'out_ch', which lists 'outdir' three times as its contents. This channel then flows into a channel operator 'collect' and then into another 'process' called 'multiqc', indicated by a rounded rectangle with the command 'multiqc -o mqc_res .'. The output of 'multiqc' goes into a channel called 'mqc_ch', which also lists 'outdir' one time.’
Nextflow process flow diagram.
Figure 5
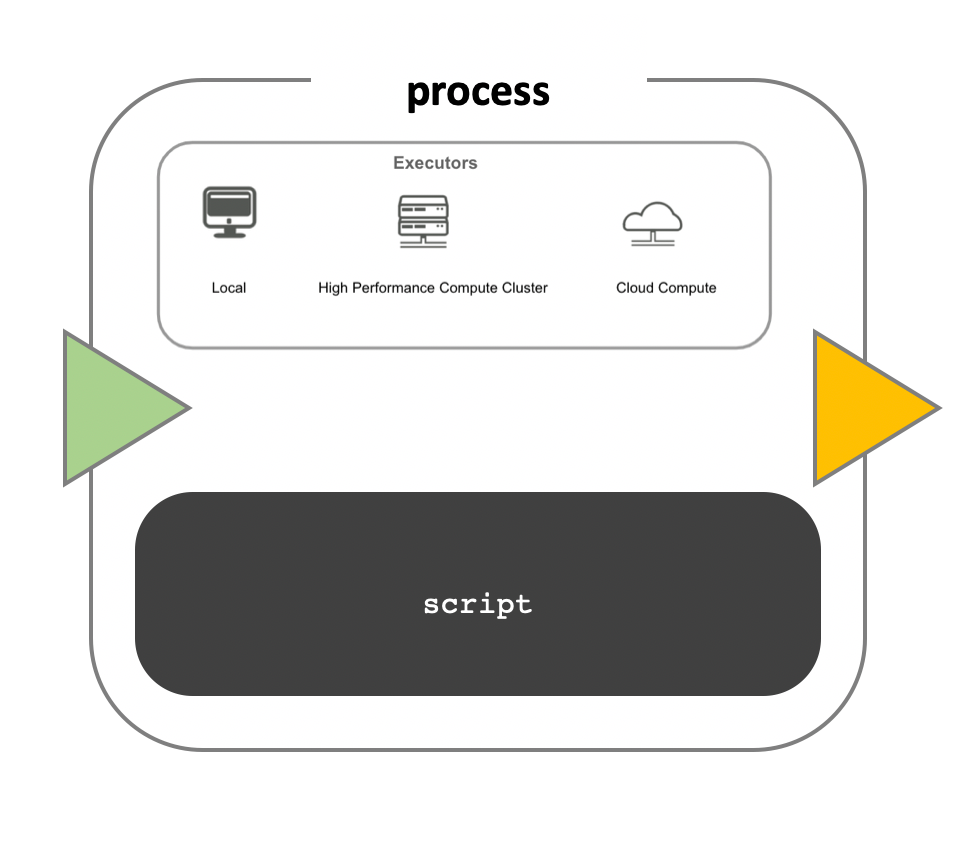
Image 1 of 1: ‘Diagram of a computational process within a bioinformatics workflow. The image features a large, central, rounded rectangle labeled 'process' with a smaller rectangle inside it labeled 'script', indicating the code or commands that are being executed. Above the script box, there is a smaller inset labeled 'Executors' with three icons: a desktop computer labeled 'Local', a stack of servers labeled 'High Performance Compute Cluster', and a cloud symbol labeled 'Cloud Compute'. These represent the different computing environments where the script can be executed. To the left of the process box is a green left-pointing arrowhead, suggesting input into the process, and to the right is a yellow right-pointing arrowhead, indicating the direction of output from the process.’
Image 1 of 1: ‘A diagram illustrating the different executors available in Nextflow. The diagram shows a configuration file feeding into Nextflow, which has both local and grid executors. The local executor connects to the Local OS and a standalone computer, while the grid executor connects to a batch scheduler and NFS, which further connects to various computing resources such as UNIVA, SLURM, Platform Computing, PBS Works, Kubernetes, and Amazon Web Services.’
A diagram illustrating the different executors
available in Nextflow. The diagram shows a configuration file feeding
into Nextflow, which has both local and grid executors. The local
executor connects to the Local OS and a standalone computer, while the
grid executor connects to a batch scheduler and NFS, which further
connects to various computing resources such as UNIVA, SLURM, Platform
Computing, PBS Works, Kubernetes, and Amazon Web Services.
The INDEX process should be the longest running process.
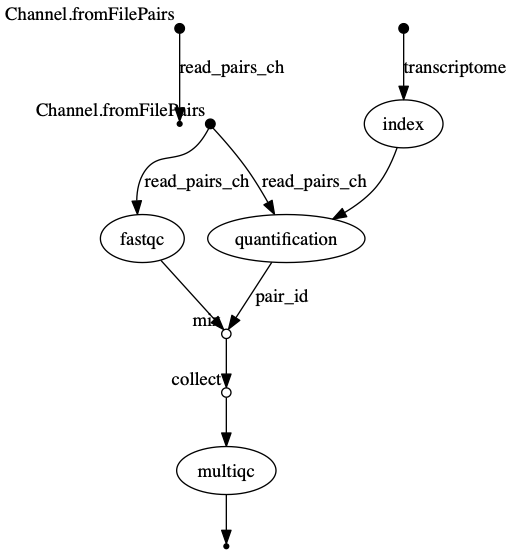
dag.png The vertices in the graph
represent the pipeline’s processes and operators, while the edges
represent the data connections (i.e. channels) between them.
Image 1 of 1: ‘A diagram showcasing the key aspects of nf-core, a community effort to provide best-practice analysis pipelines. The diagram is divided into three sections: Deploy, Participate, and Develop. The Deploy section includes features like Stable pipelines, Centralized configs, List and update pipelines, and Download for offline use. The Participate section highlights Documentation, Slack workspace, Twitter updates, and Hackathons. The Develop section emphasizes the Starter template, Code guidelines, CI code linting and tests, and Helper tools.’
A diagram showcasing the key aspects of nf-core,
a community effort to provide best-practice analysis pipelines. The
diagram is divided into three sections: Deploy, Participate, and
Develop. The Deploy section includes features like Stable pipelines,
Centralized configs, List and update pipelines, and Download for offline
use. The Participate section highlights Documentation, Slack workspace,
Twitter updates, and Hackathons. The Develop section emphasizes the
Starter template, Code guidelines, CI code linting and tests, and Helper
tools.
Figure 2
Image 1 of 1: ‘A diagram explaining the structure and hierarchy of nextflow.config files. The diagram shows that the default ‘base’ config is always loaded. It also includes core profiles, such as docker, conda, and test, and server profiles from nf-core/config. Additionally, it highlights that your local config files, located in $HOME/.nextflow/config or specified with -c custom.config, are also considered.’
A diagram explaining the structure and hierarchy
of nextflow.config files. The diagram shows that the default ‘base’
config is always loaded. It also includes core profiles, such as docker,
conda, and test, and server profiles from nf-core/config. Additionally,
it highlights that your local config files, located in
$HOME/.nextflow/config or specified with -c custom.config, are also
considered.

 The vertices in the graph
represent the pipeline’s processes and operators, while the edges
represent the data connections (i.e. channels) between them.
The vertices in the graph
represent the pipeline’s processes and operators, while the edges
represent the data connections (i.e. channels) between them.
