All Images
Introduction
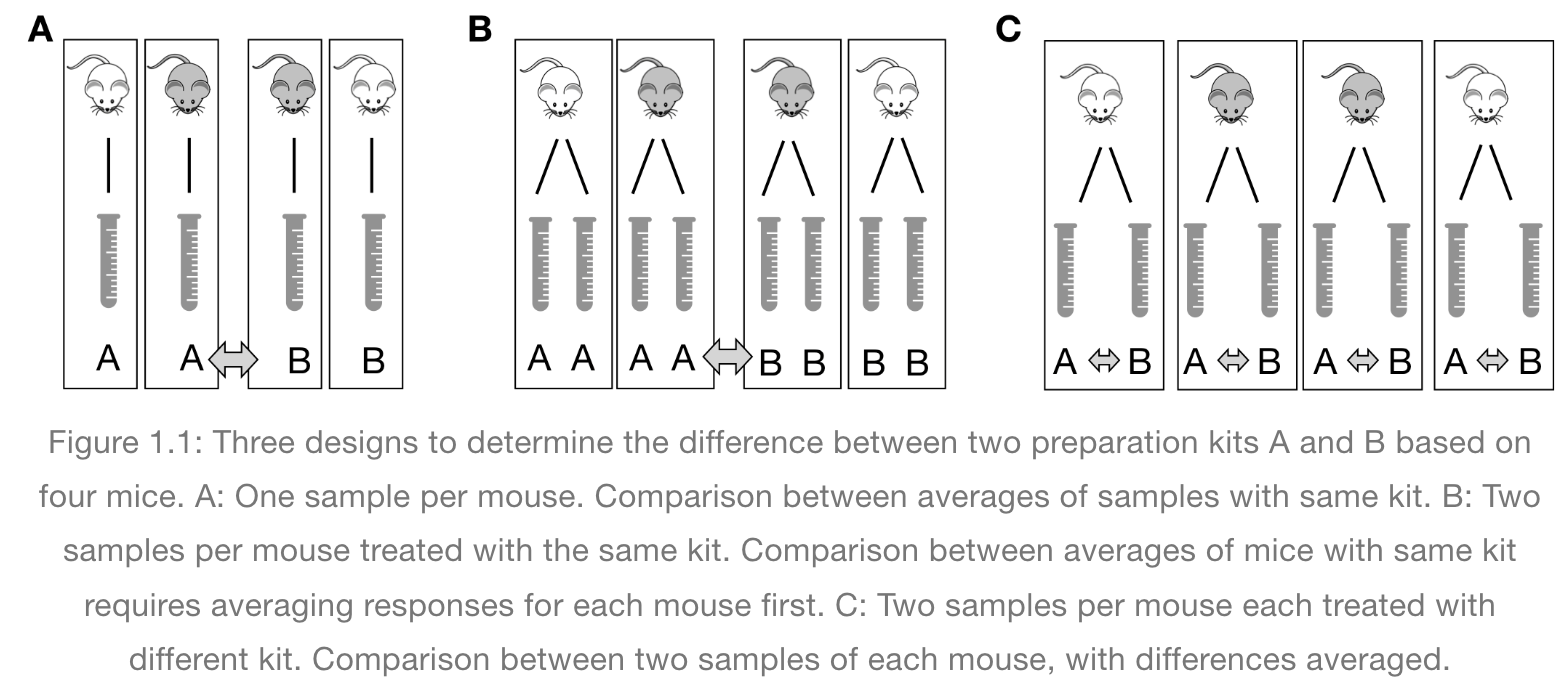
Figure 1

graphic of design and analysis
Essential Features of a Comparative Experiment
Figure 1
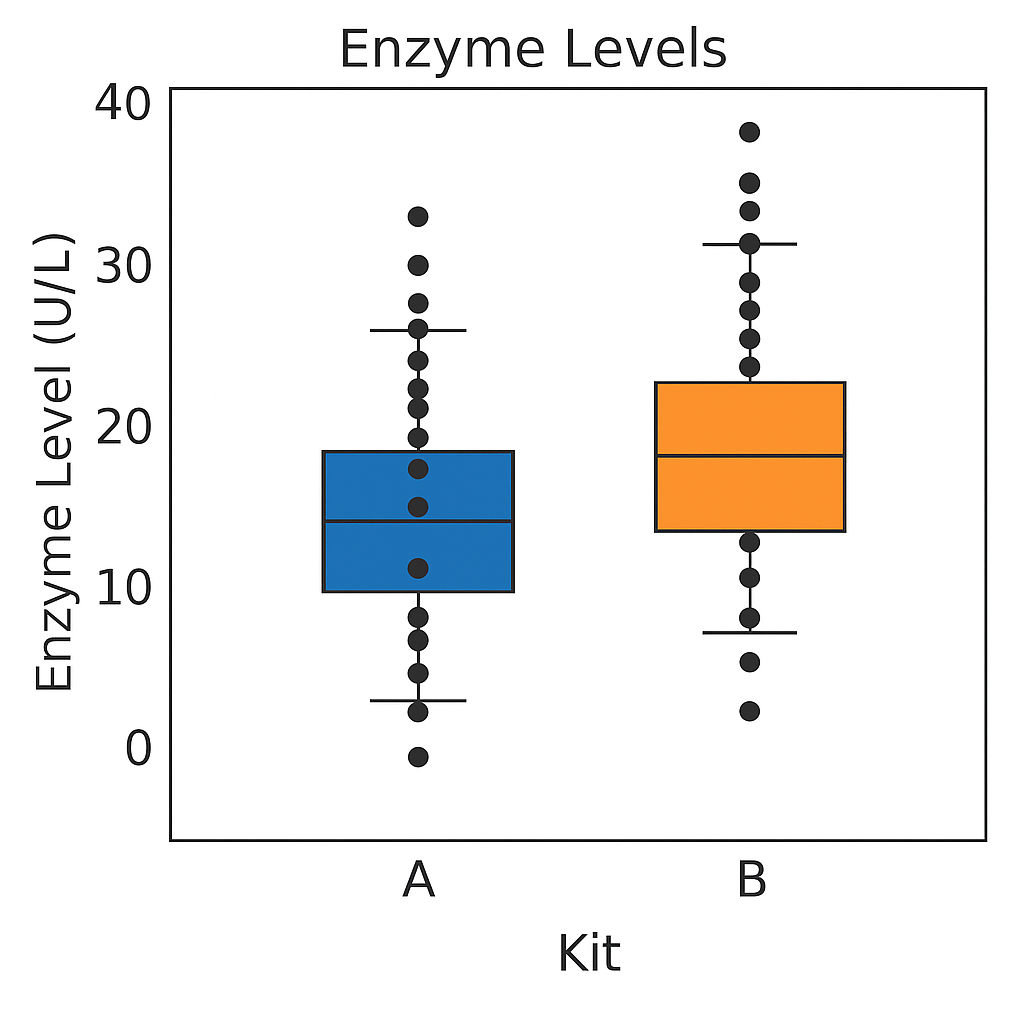
boxplots of enzyme levels in kits A and B
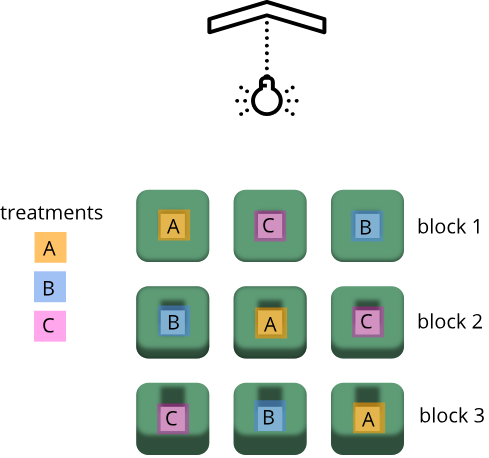
Figure 2

experimental design for Generation 100
study
Experimental Design Principles
Figure 1

Figure 2
 Excerpted
from Statistical Design and Analysis of Biological Experiments by
Hans-Michael Kaltenbach
Excerpted
from Statistical Design and Analysis of Biological Experiments by
Hans-Michael Kaltenbach
Figure 3
Statistics in Data Analysis
Figure 1

Figure 2
Figure 3
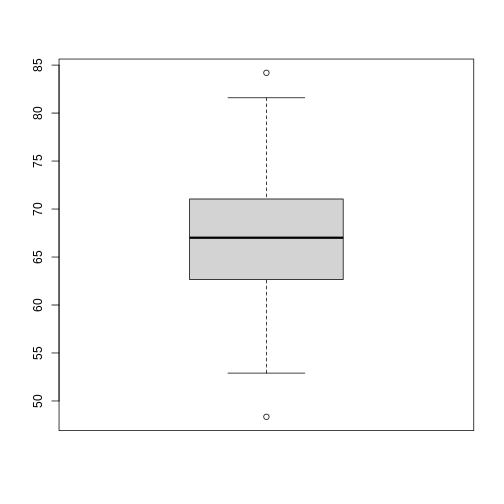
Figure 4
Figure 5
Figure 6
Figure 7
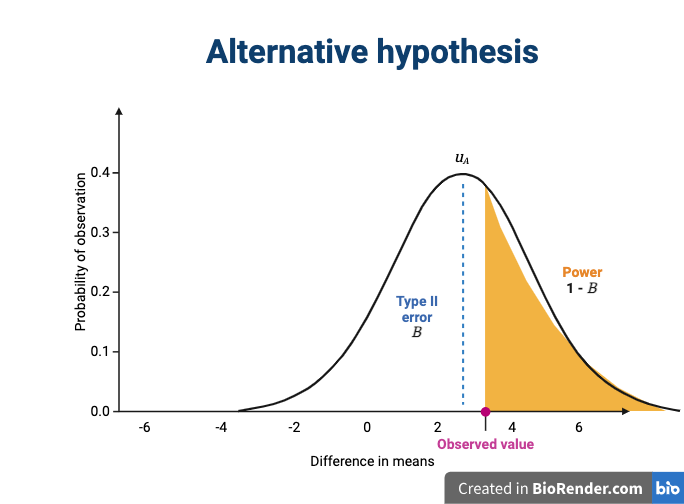
Figure 8
Figure 9
Figure 10
Figure 11
Figure 12
Figure 13
Figure 14
Figure 15
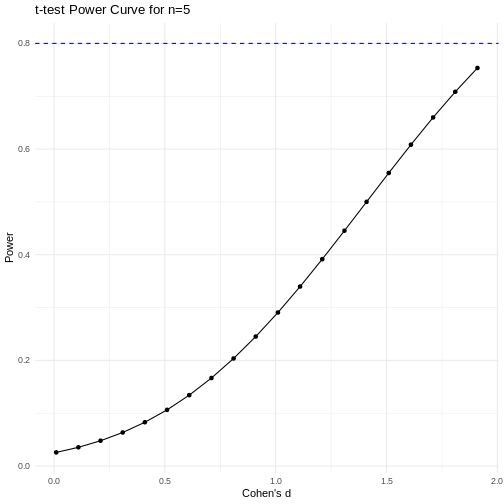
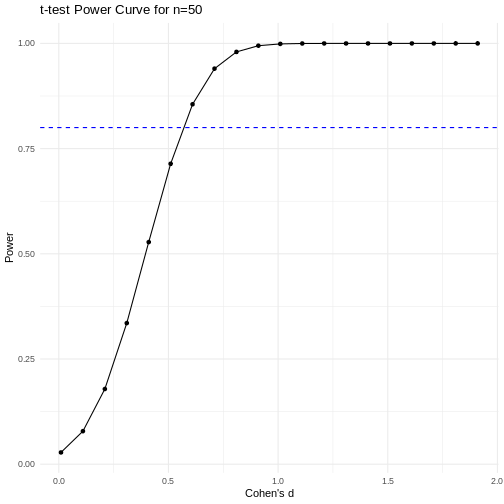
 Code adapted from Power
Curve in R by Cinni Patel.
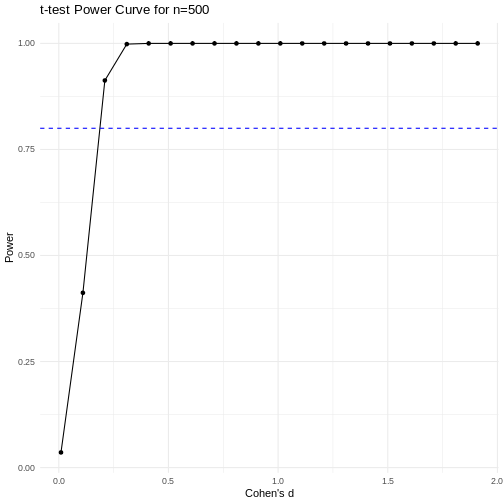
Code adapted from Power
Curve in R by Cinni Patel.
Figure 16
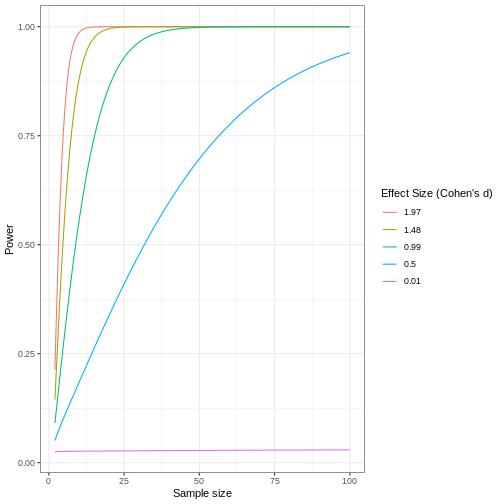 Code adapted from How
to Create Power Curves in ggplot by Levi Baguley
Code adapted from How
to Create Power Curves in ggplot by Levi Baguley
Completely Randomized Designs
Figure 1
Figure 2
Figure 3
Figure 4
Completely Randomized Design with More than One Treatment Factor
Figure 1
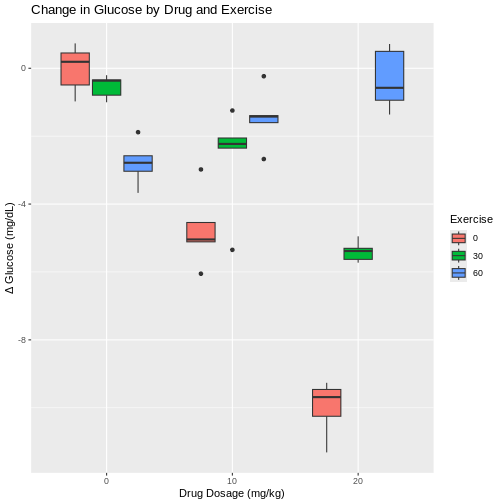
Figure 2
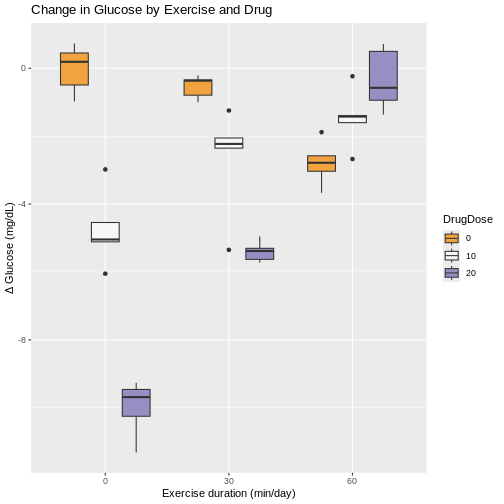
Figure 3
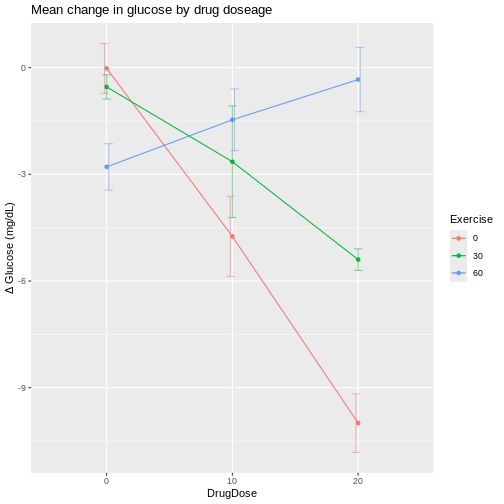
Figure 4
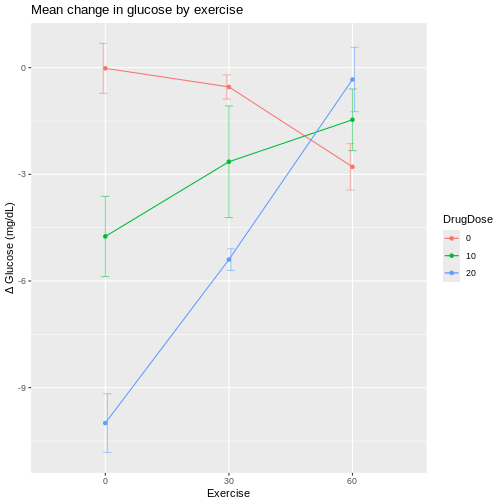
Figure 5

Randomized Complete Block Designs
Figure 1
Figure 2
Figure 3
 Excerpted
from Statistical Design and Analysis of Biological Experiments by
Hans-Michael Kaltenbach
Excerpted
from Statistical Design and Analysis of Biological Experiments by
Hans-Michael Kaltenbach