Draw a Rectangle
Overview
Teaching: 0 min
Exercises: 0 minQuestions
How do I draw a rectangle?
Objectives
Create rectangles using ggplot2.
Set aesthetics (e.g. color, opacity) of drawn object.
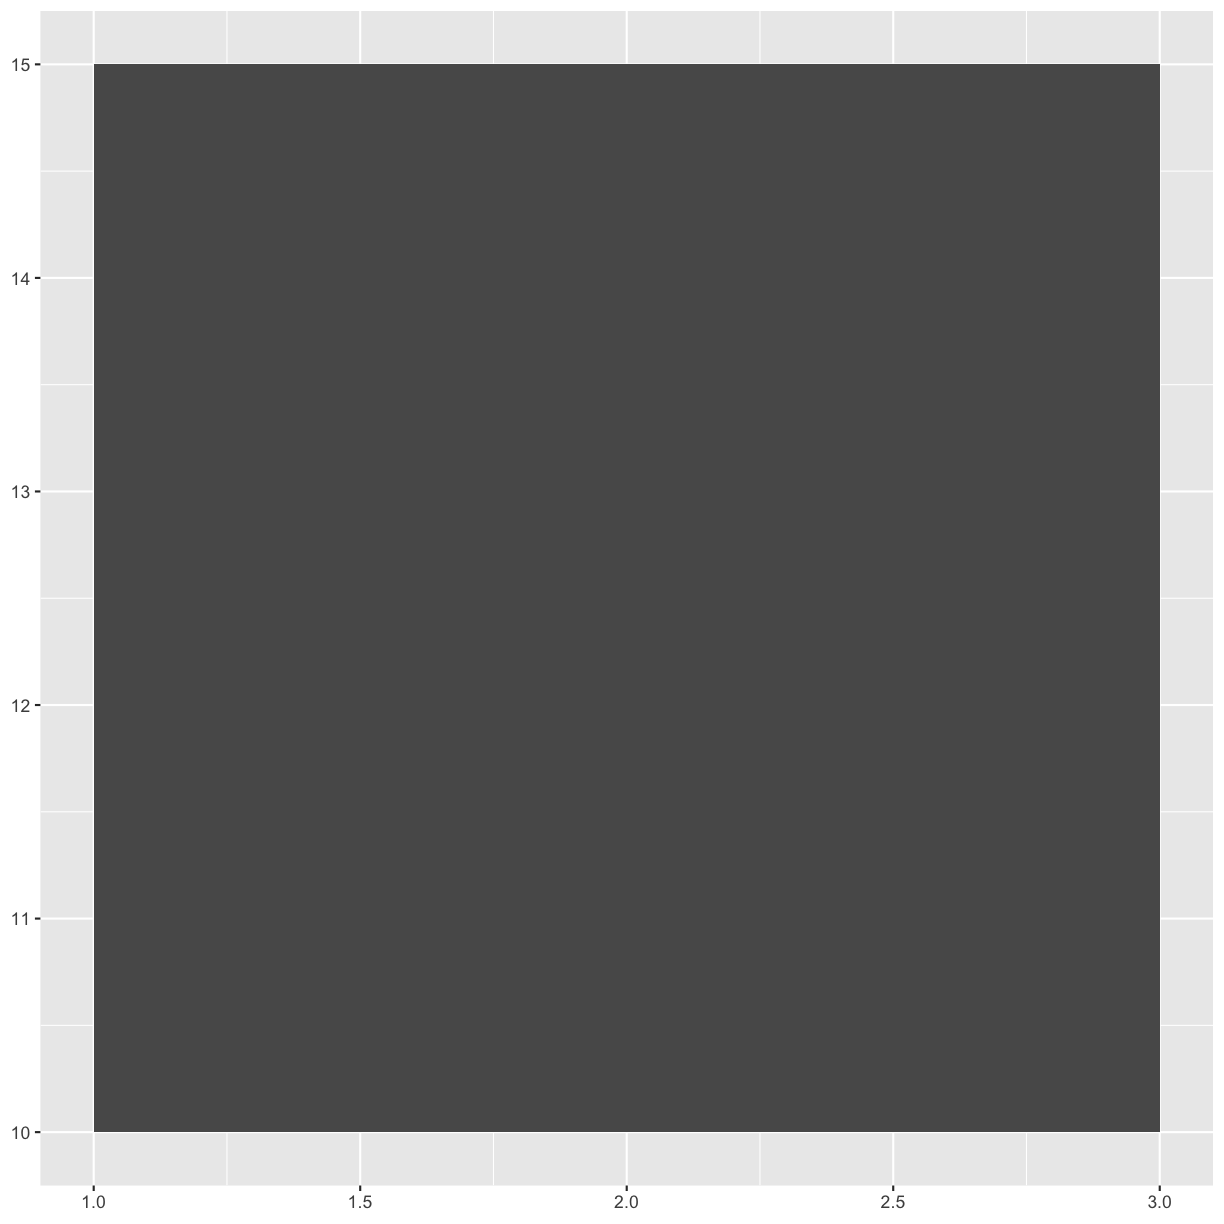
library(ggplot2)
ggplot() +
  geom_rect(aes(xmin = 1, xmax = 3, ymin = 10, ymax = 15))
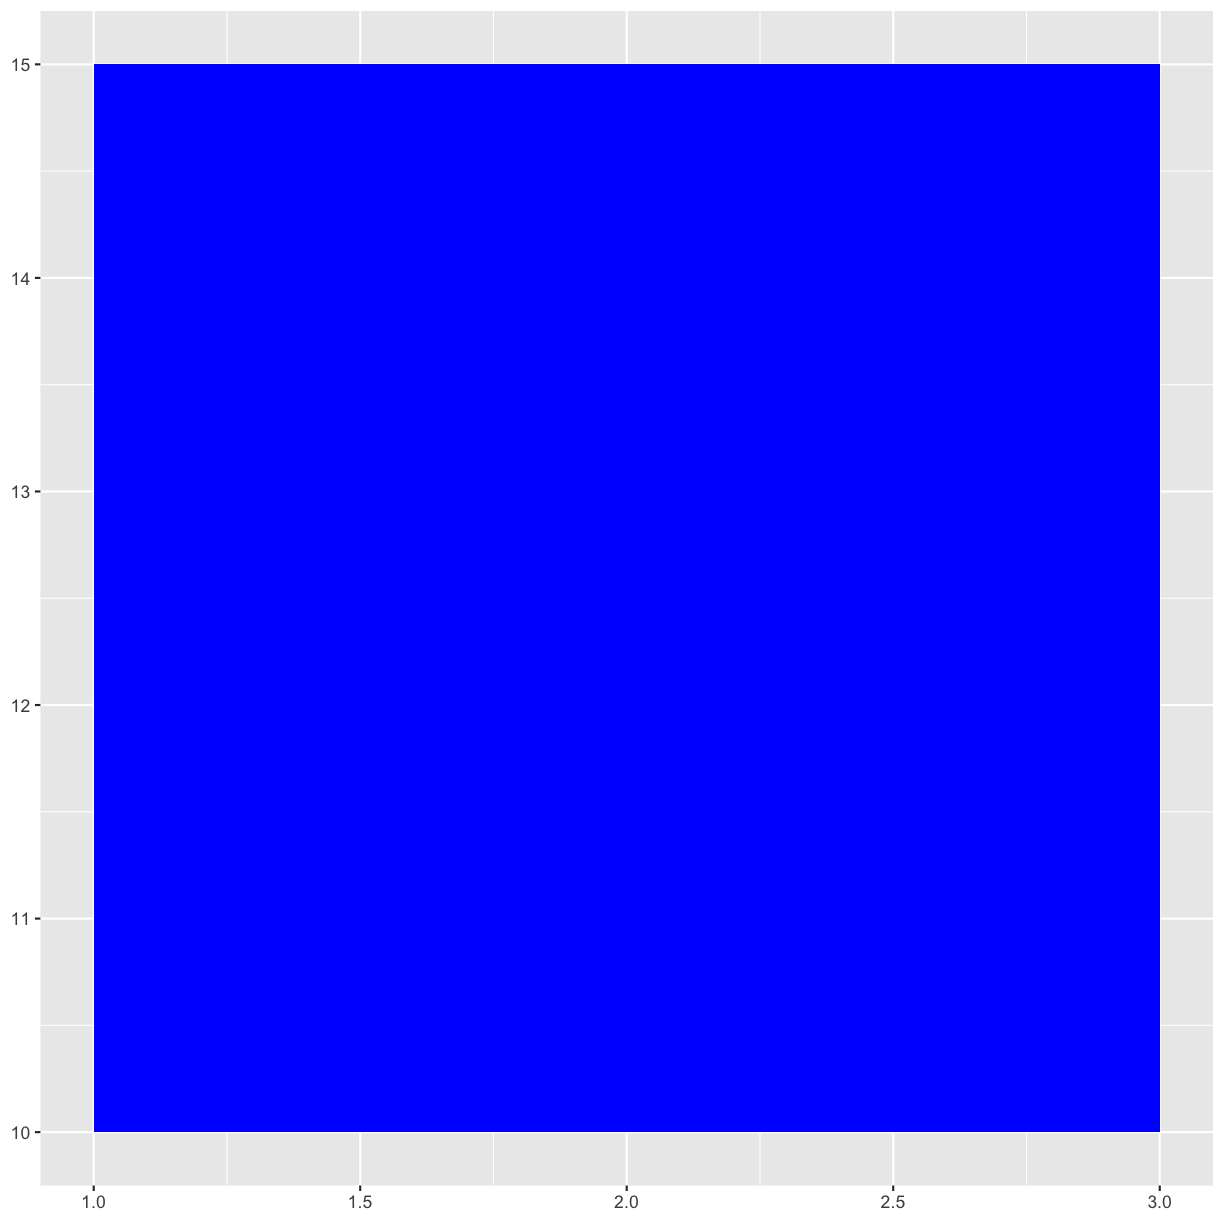
ggplot() +
  geom_rect(aes(xmin = 1, xmax = 3, ymin = 10, ymax = 15),
            fill = "blue")
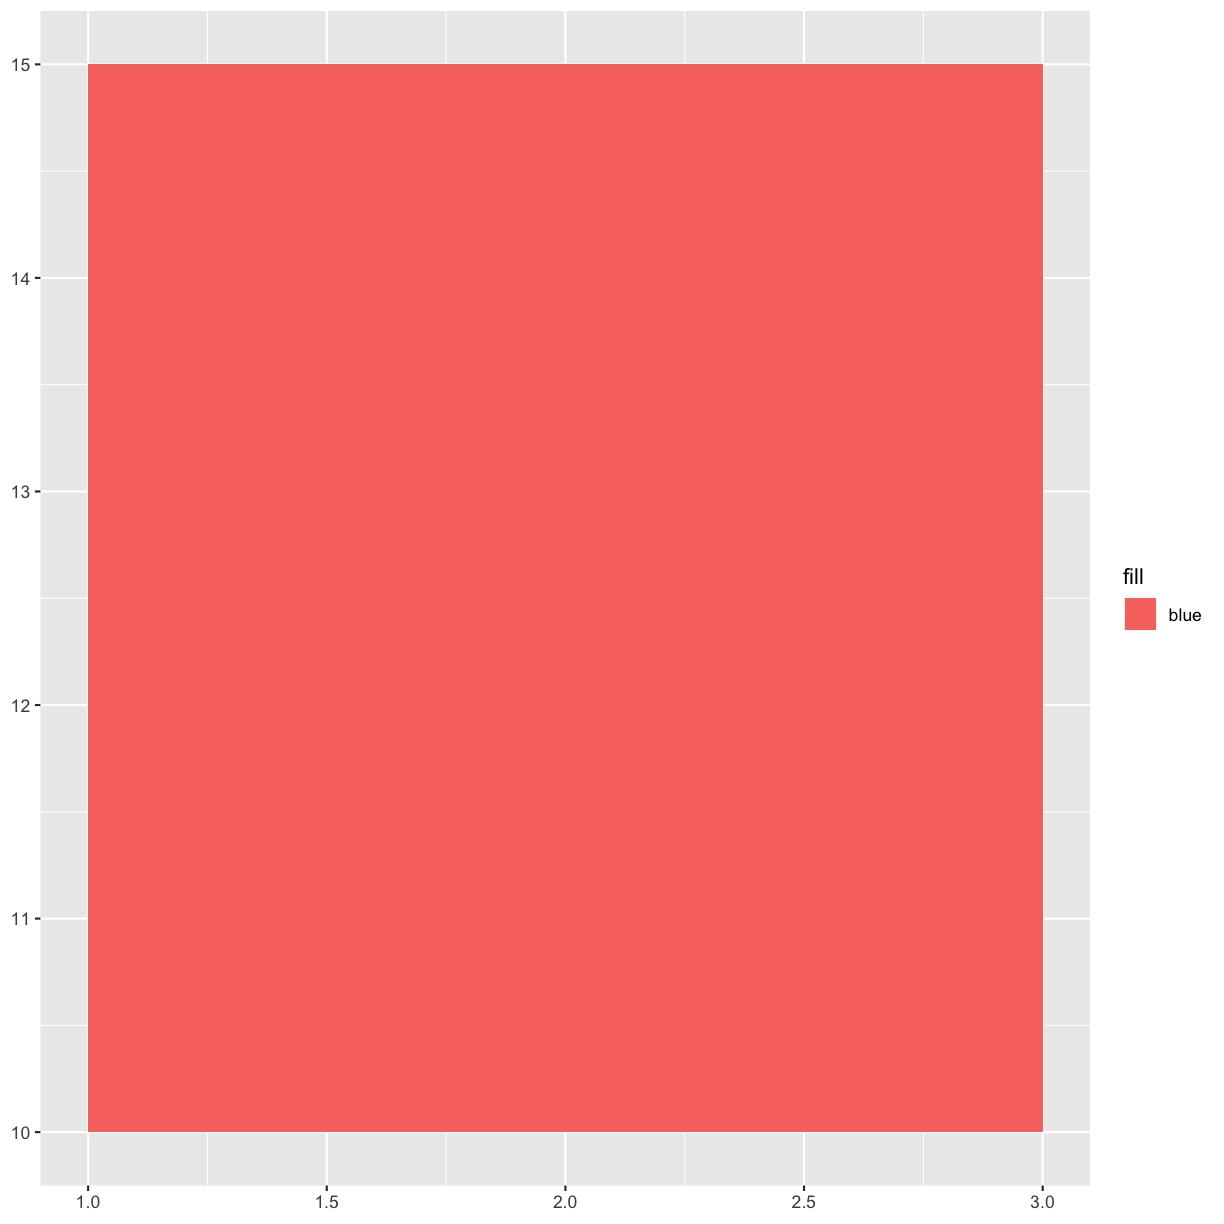
Warning
ggplot() +
  geom_rect(aes(xmin = 1, xmax = 3, ymin = 10, ymax = 15, fill = "blue"))
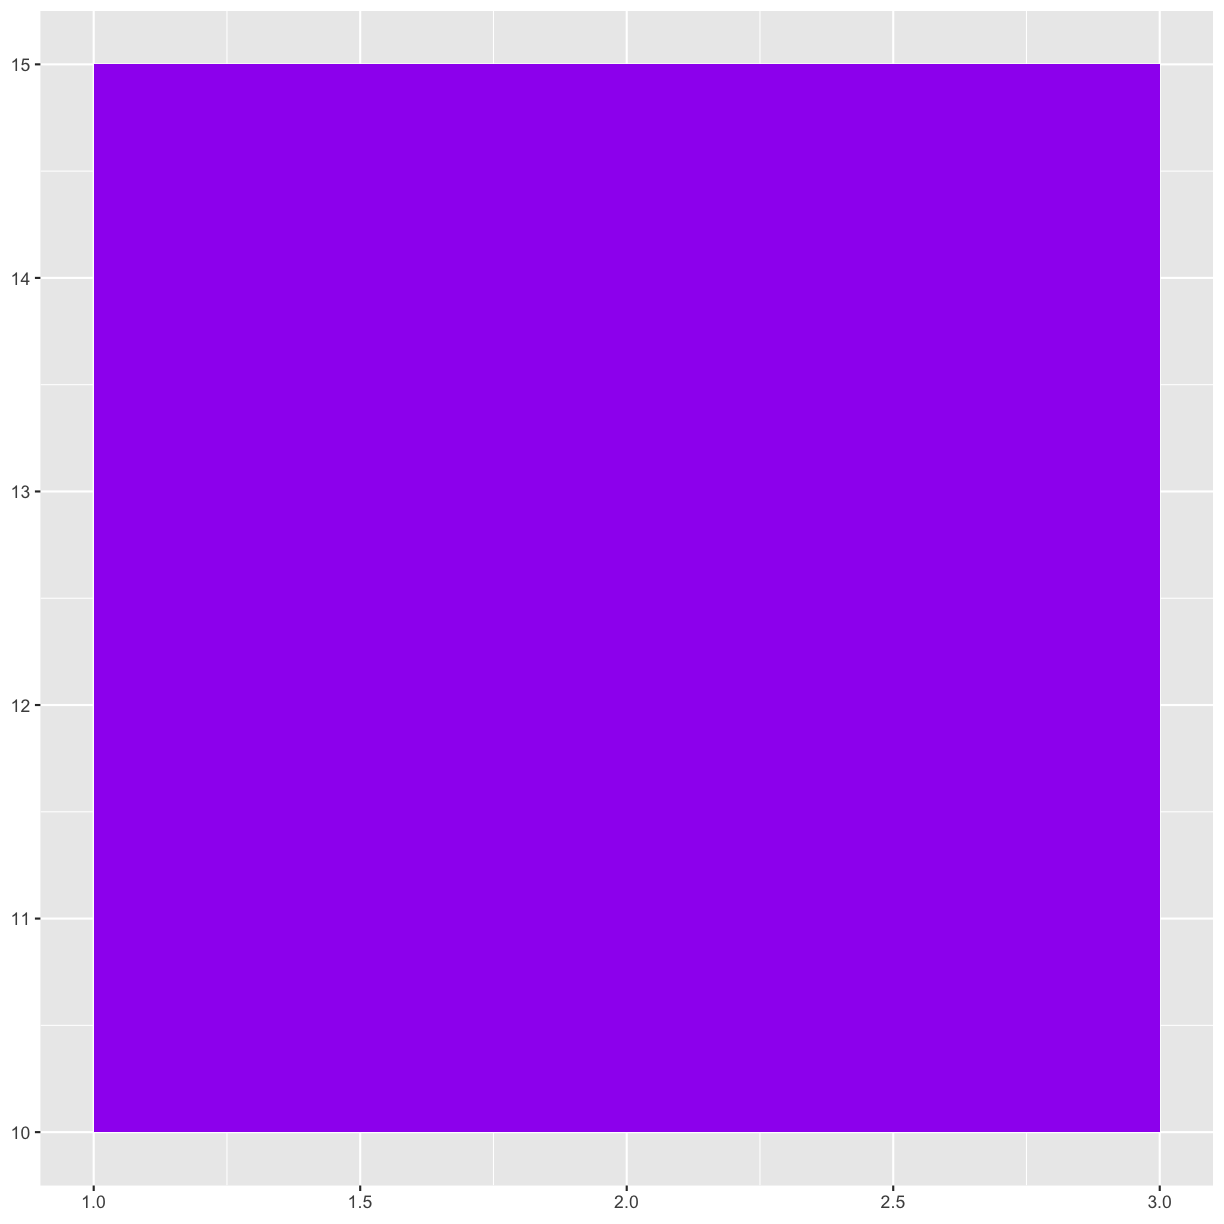
Your Favorite Color
ggplot() +
geom_rect(aes(xmin = 1, xmax = 3, ymin = 10, ymax = 15), fill = "purple")
ggplot() +
  geom_rect(aes(xmin = 1, xmax = 3, ymin = 10, ymax = 15),
            fill = "blue", alpha = 0.4)
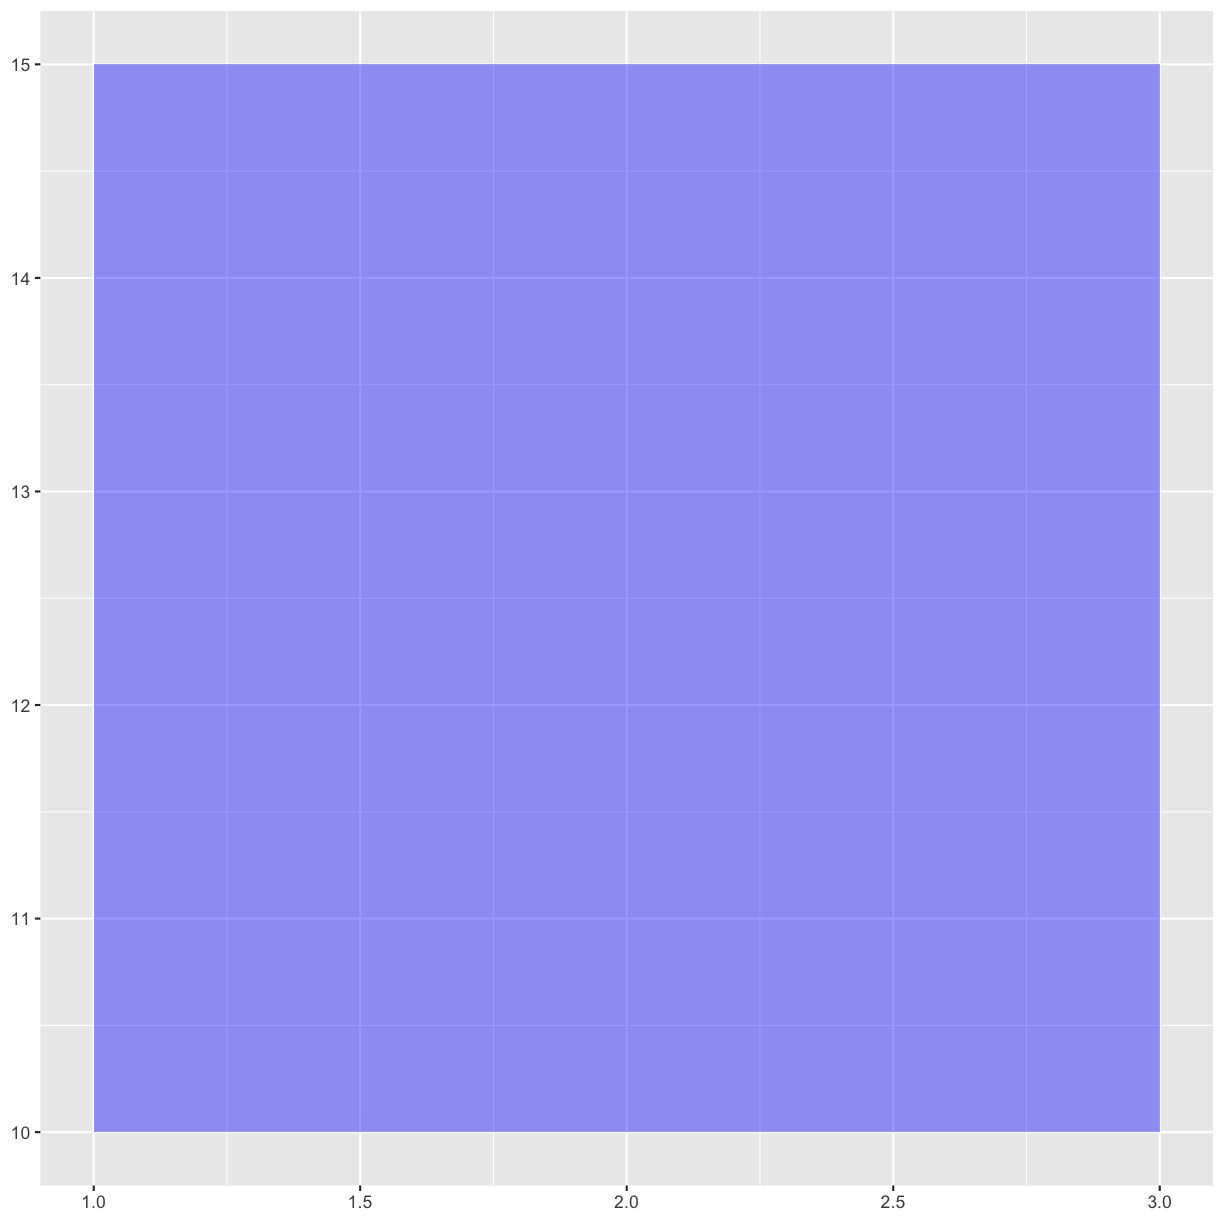 Higher alpha is more opaque (less transparent).
ggplot() +
  geom_rect(aes(xmin = 1, xmax = 3, ymin = 10, ymax = 15),
            fill = "blue", alpha = 0.4, color = "black")
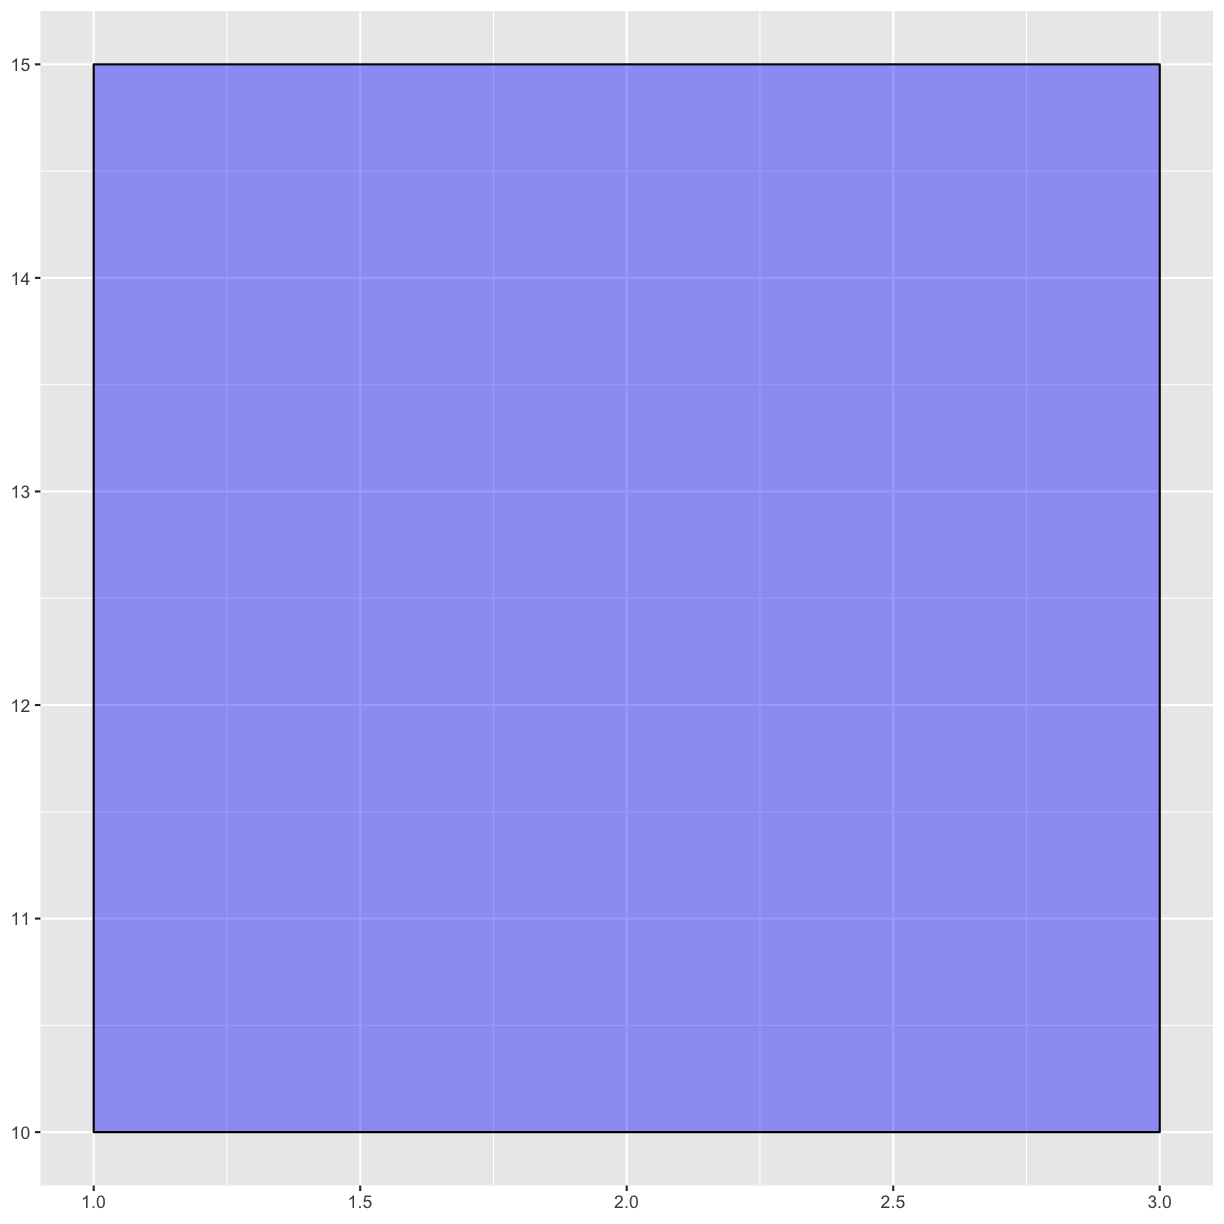
ggplot() +
  geom_rect(aes(xmin = 1, xmax = 3, ymin = 10, ymax = 15),
            fill = "blue", alpha = 0.4, color = "black") +
  theme_void()
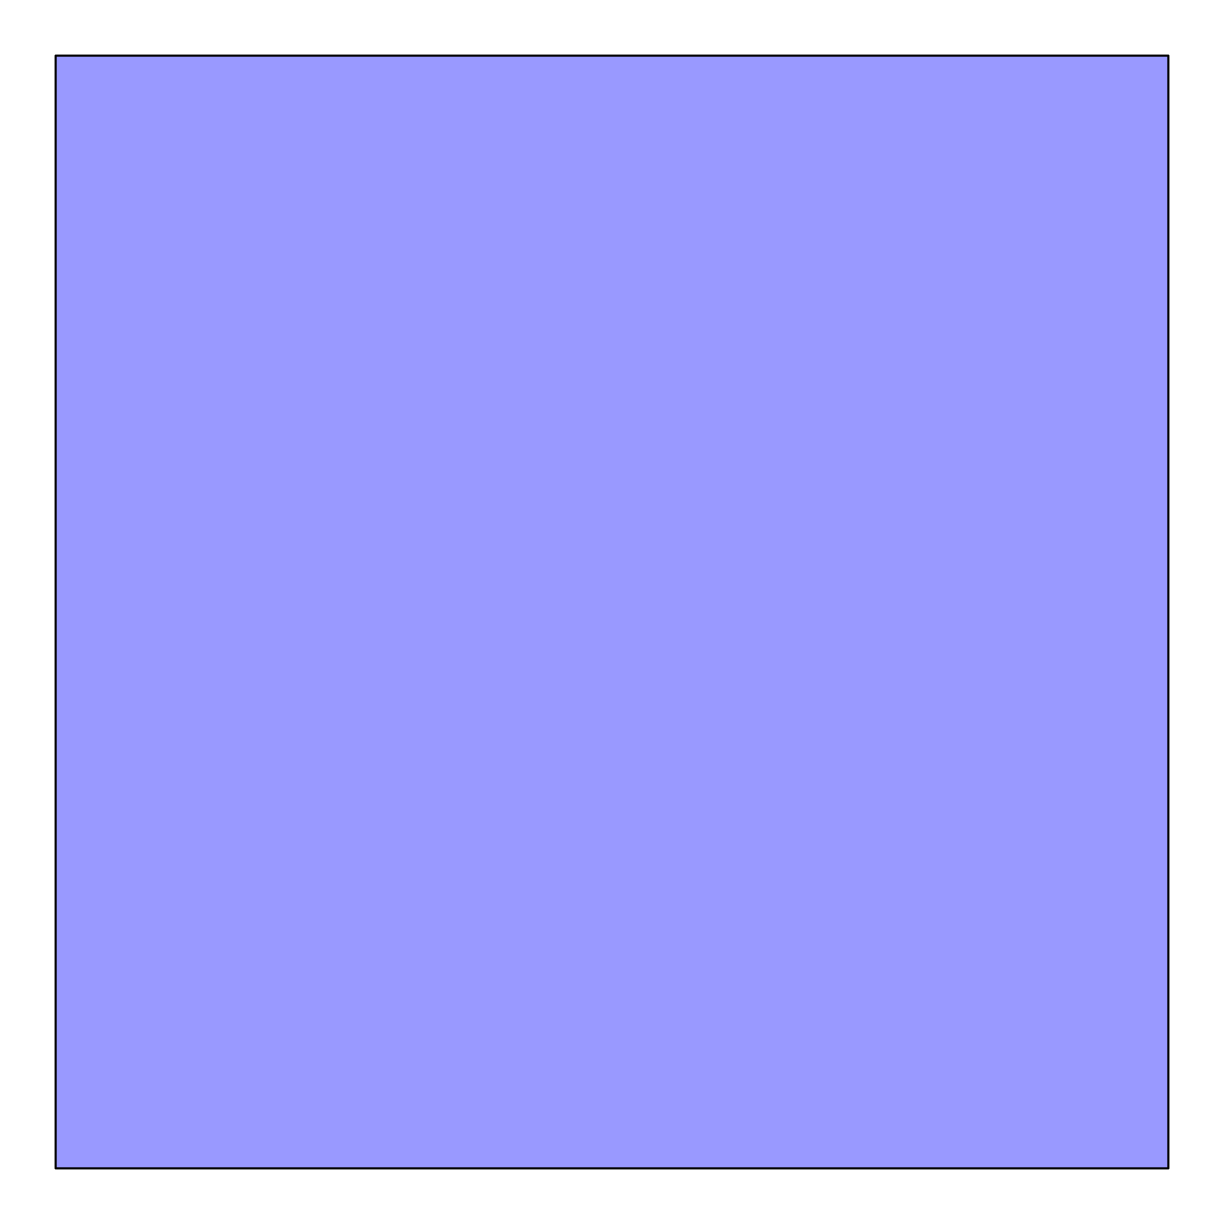
ggplot() +
  geom_rect(aes(xmin = 1, xmax = 3, ymin = 10, ymax = 15),
            fill = "blue", alpha = 0.4, color = "black") +
  geom_rect(aes(xmin = 2, xmax = 5, ymin = 3, ymax = 10),
            fill = "orange", alpha = 1, color = "black") +
  theme_void()
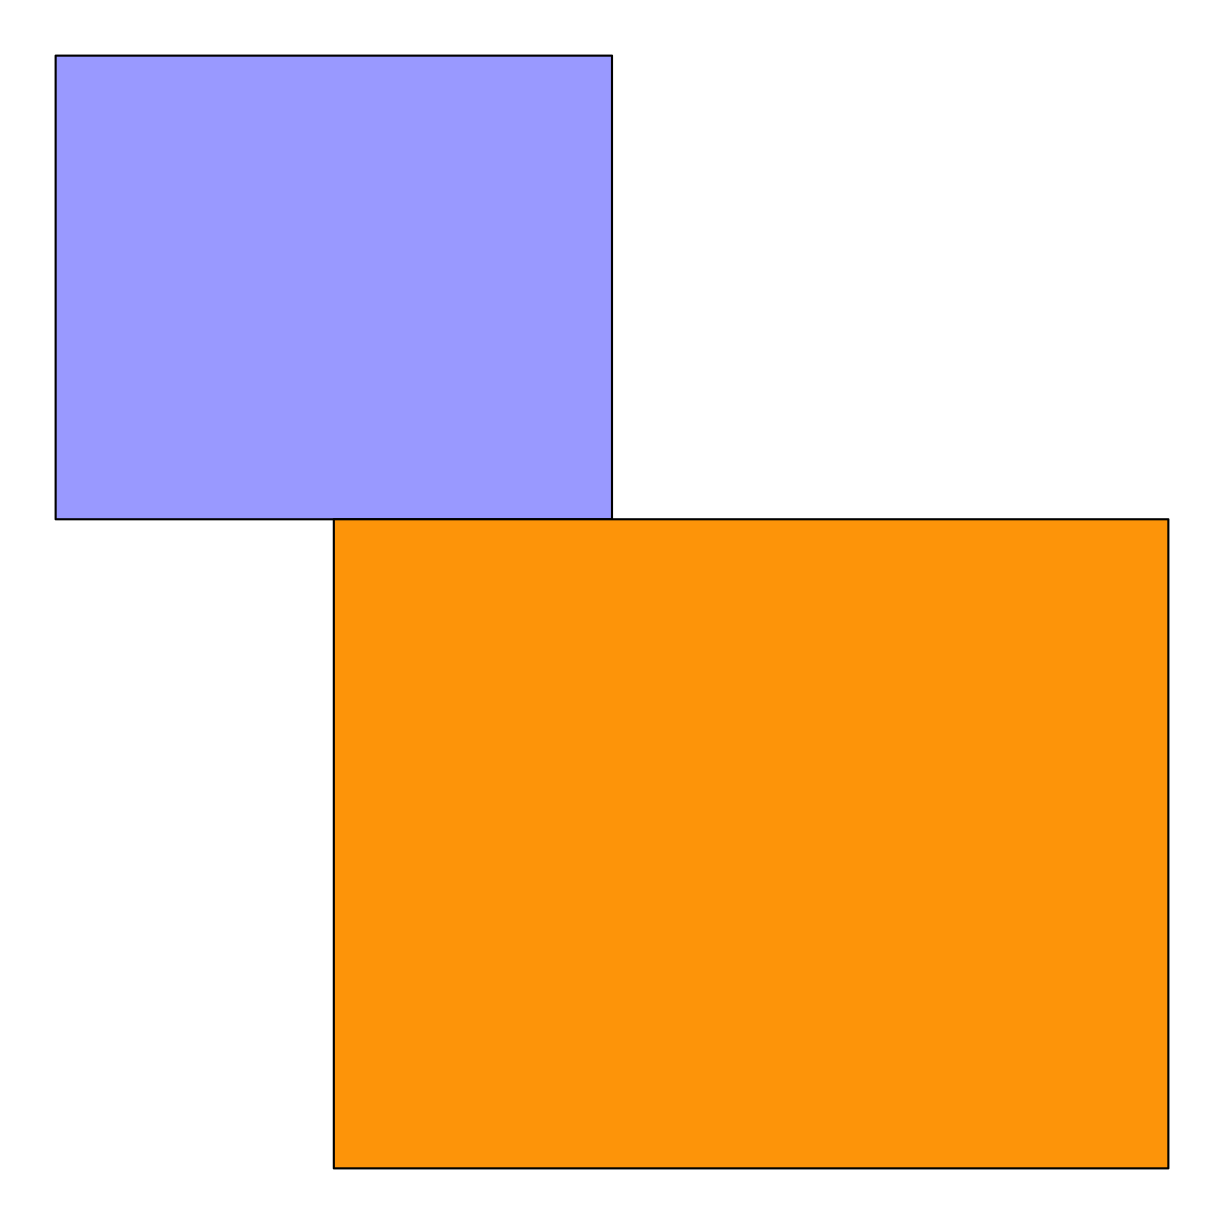 Possible to add each rectangle with a separate line of code (i.e. a separate
call to the
 geom_rect() function), but labor intensive and repetitive.
Instead, we can create a table-like data structure to hold the values we want
to use for each rectangle and iterate through each row of that table with
a single line of code.
Key Points
First key point. Brief Answer to questions. (FIXME)
