All Images
Image 1 of 1: ‘An infographic showing some of the relationships between AI, ML, and DL’
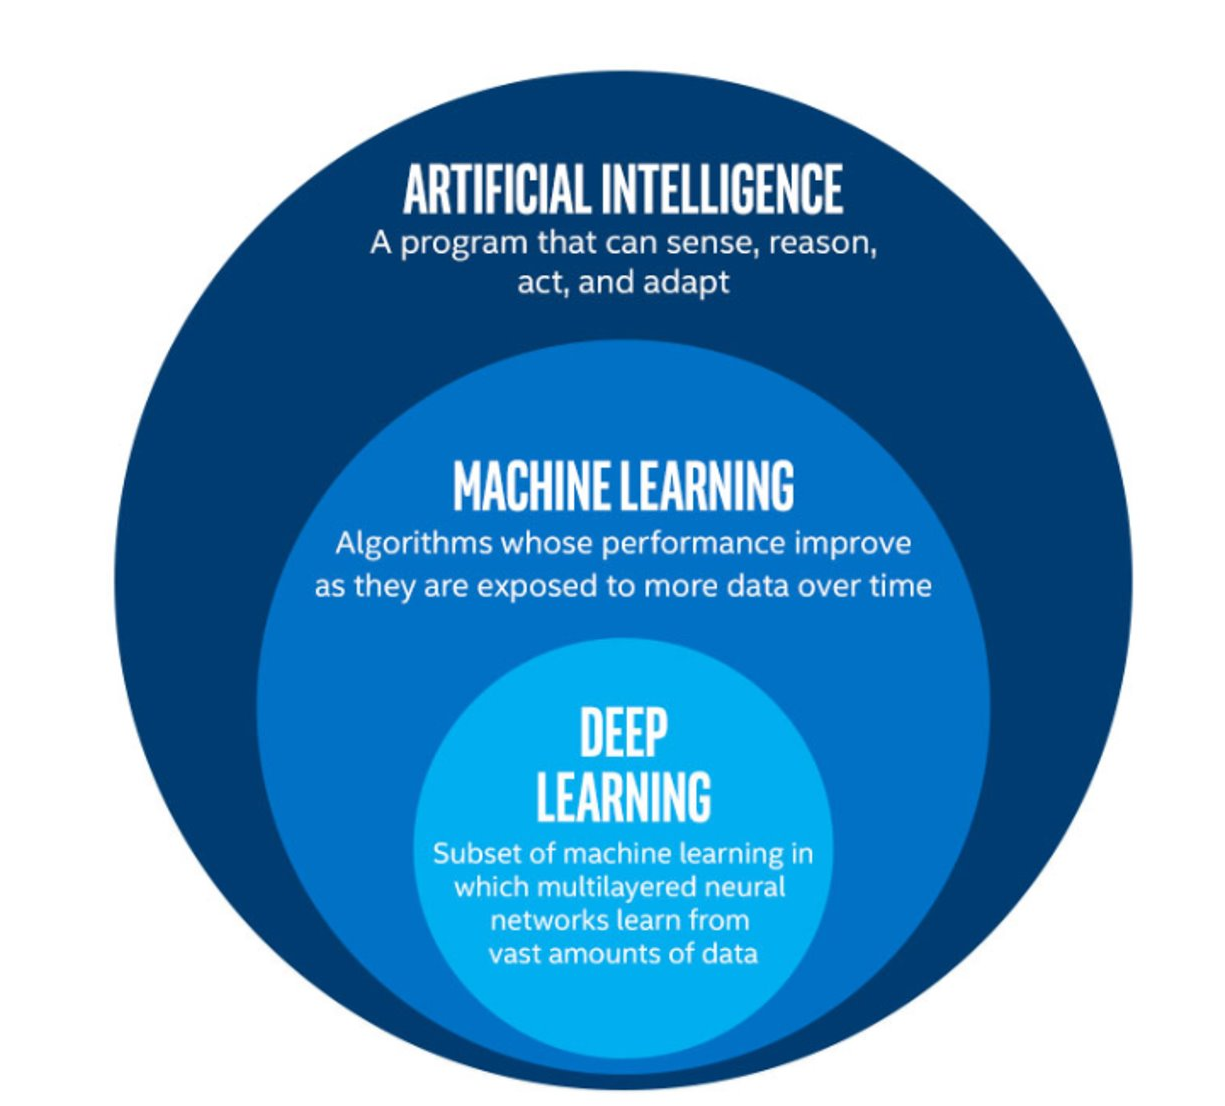 The image above is by Tukijaaliwa, CC BY-SA 4.0, via Wikimedia Commons,
original source
The image above is by Tukijaaliwa, CC BY-SA 4.0, via Wikimedia Commons,
original source
Image 1 of 1: ‘Types of Machine Learning’
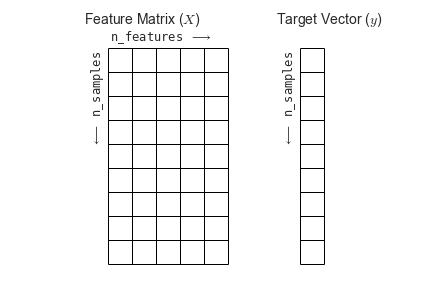 Figure from the Python Data
Science Handbook
Figure from the Python Data
Science Handbook
Image 1 of 1: ‘Types of Machine Learning’
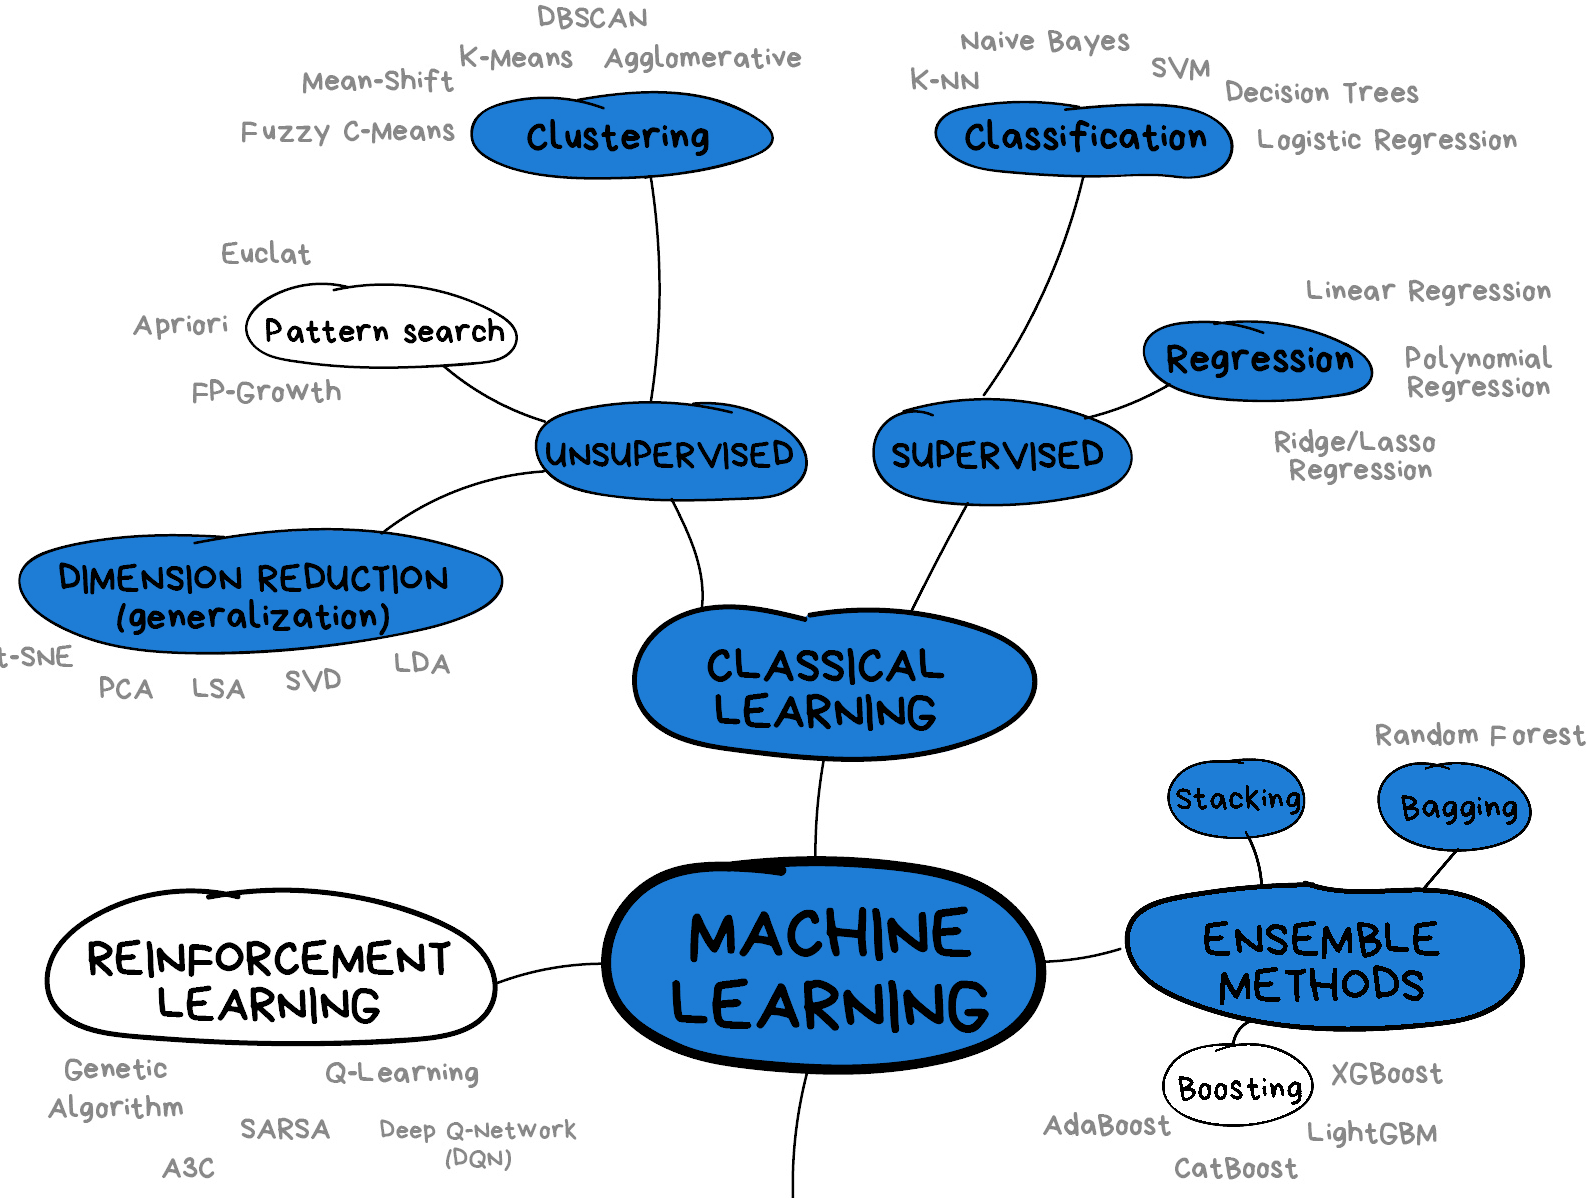 Image from Vasily
Zubarev via their blog with modifications in blue to denote lesson
content.
Image from Vasily
Zubarev via their blog with modifications in blue to denote lesson
content.
Image 1 of 1: ‘Example of linear and polynomial regressions’
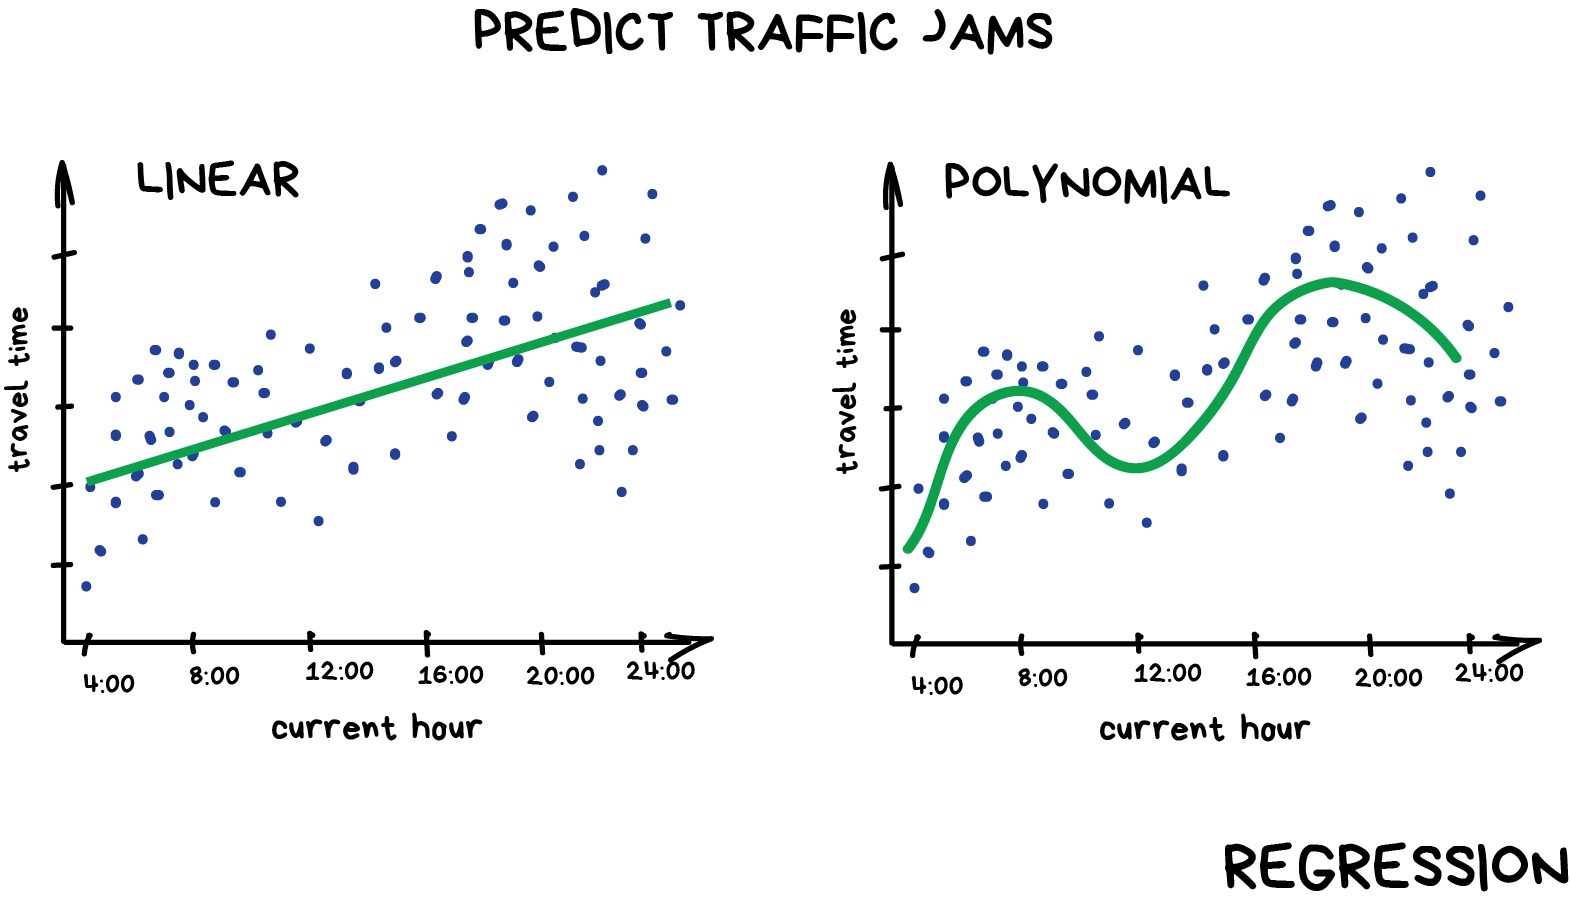
Image 1 of 1: ‘Artwork by @allison_horst’
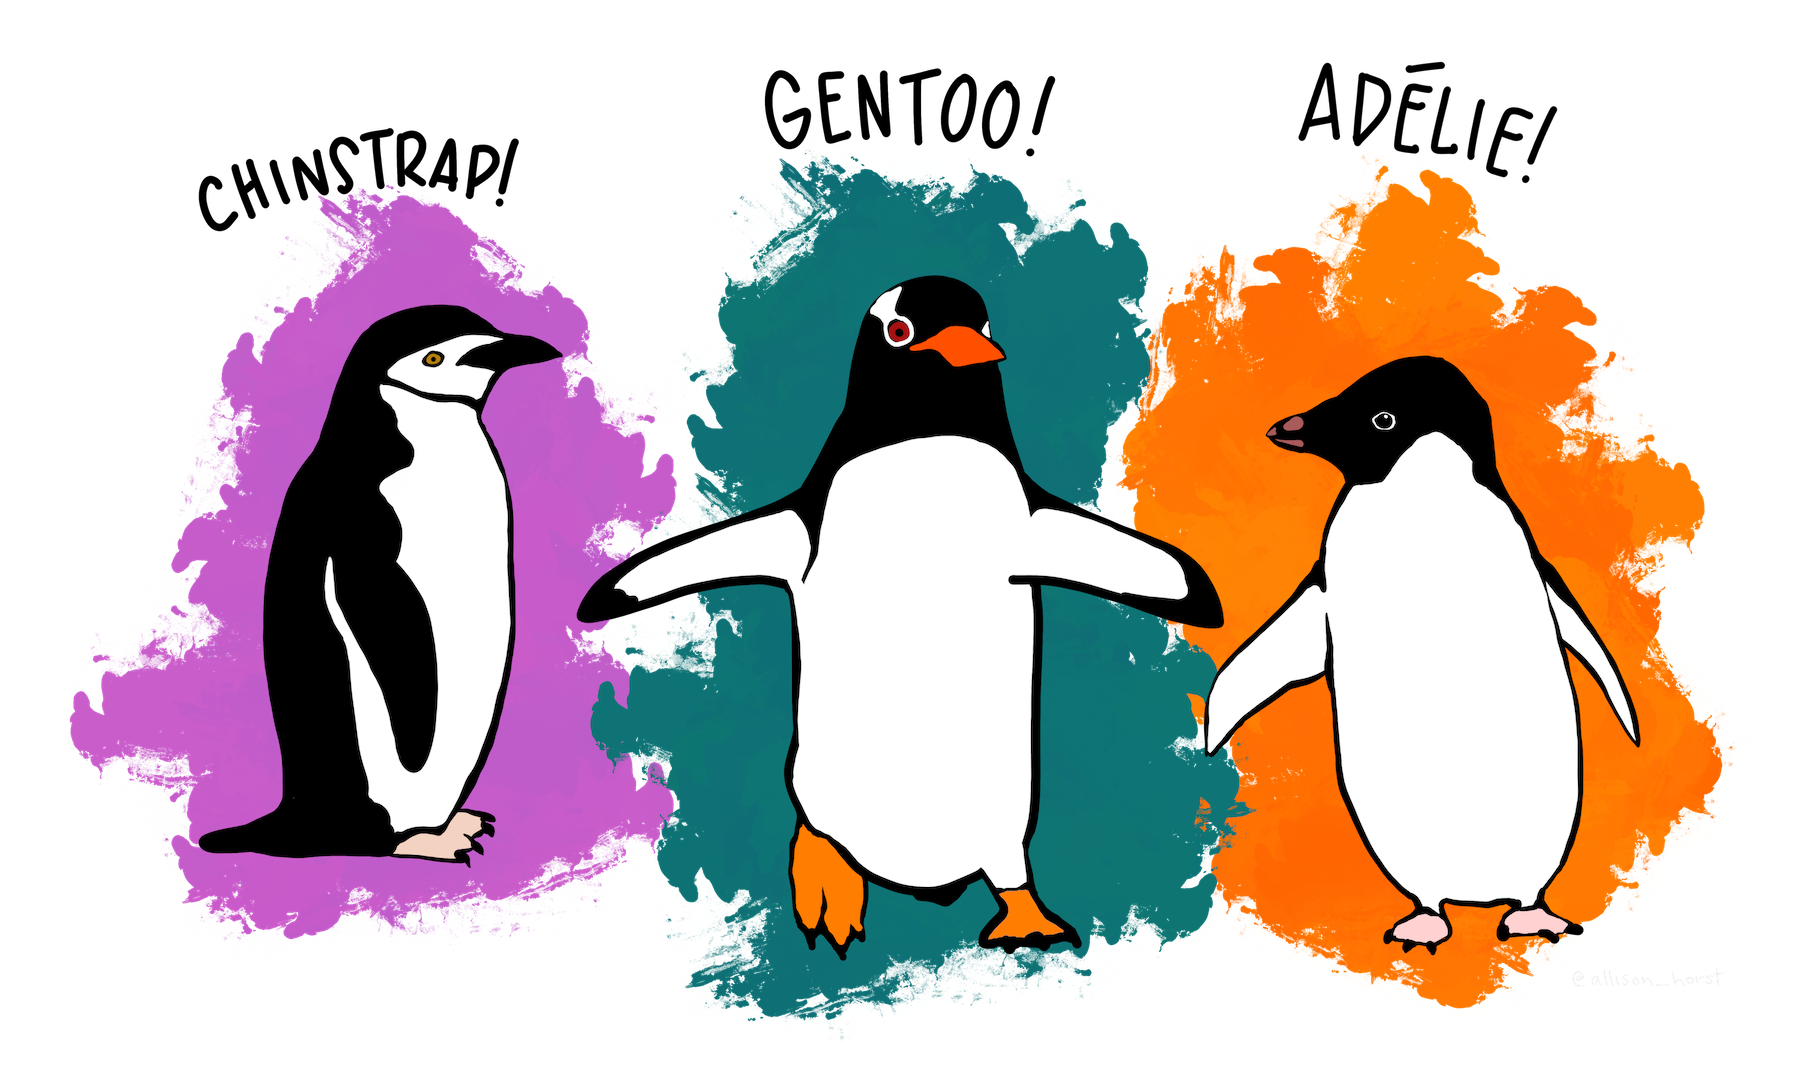
Image 1 of 1: ‘Artwork by @allison_horst’
The physical attributes measured are flipper length, beak length,
beak width, body mass, and sex. 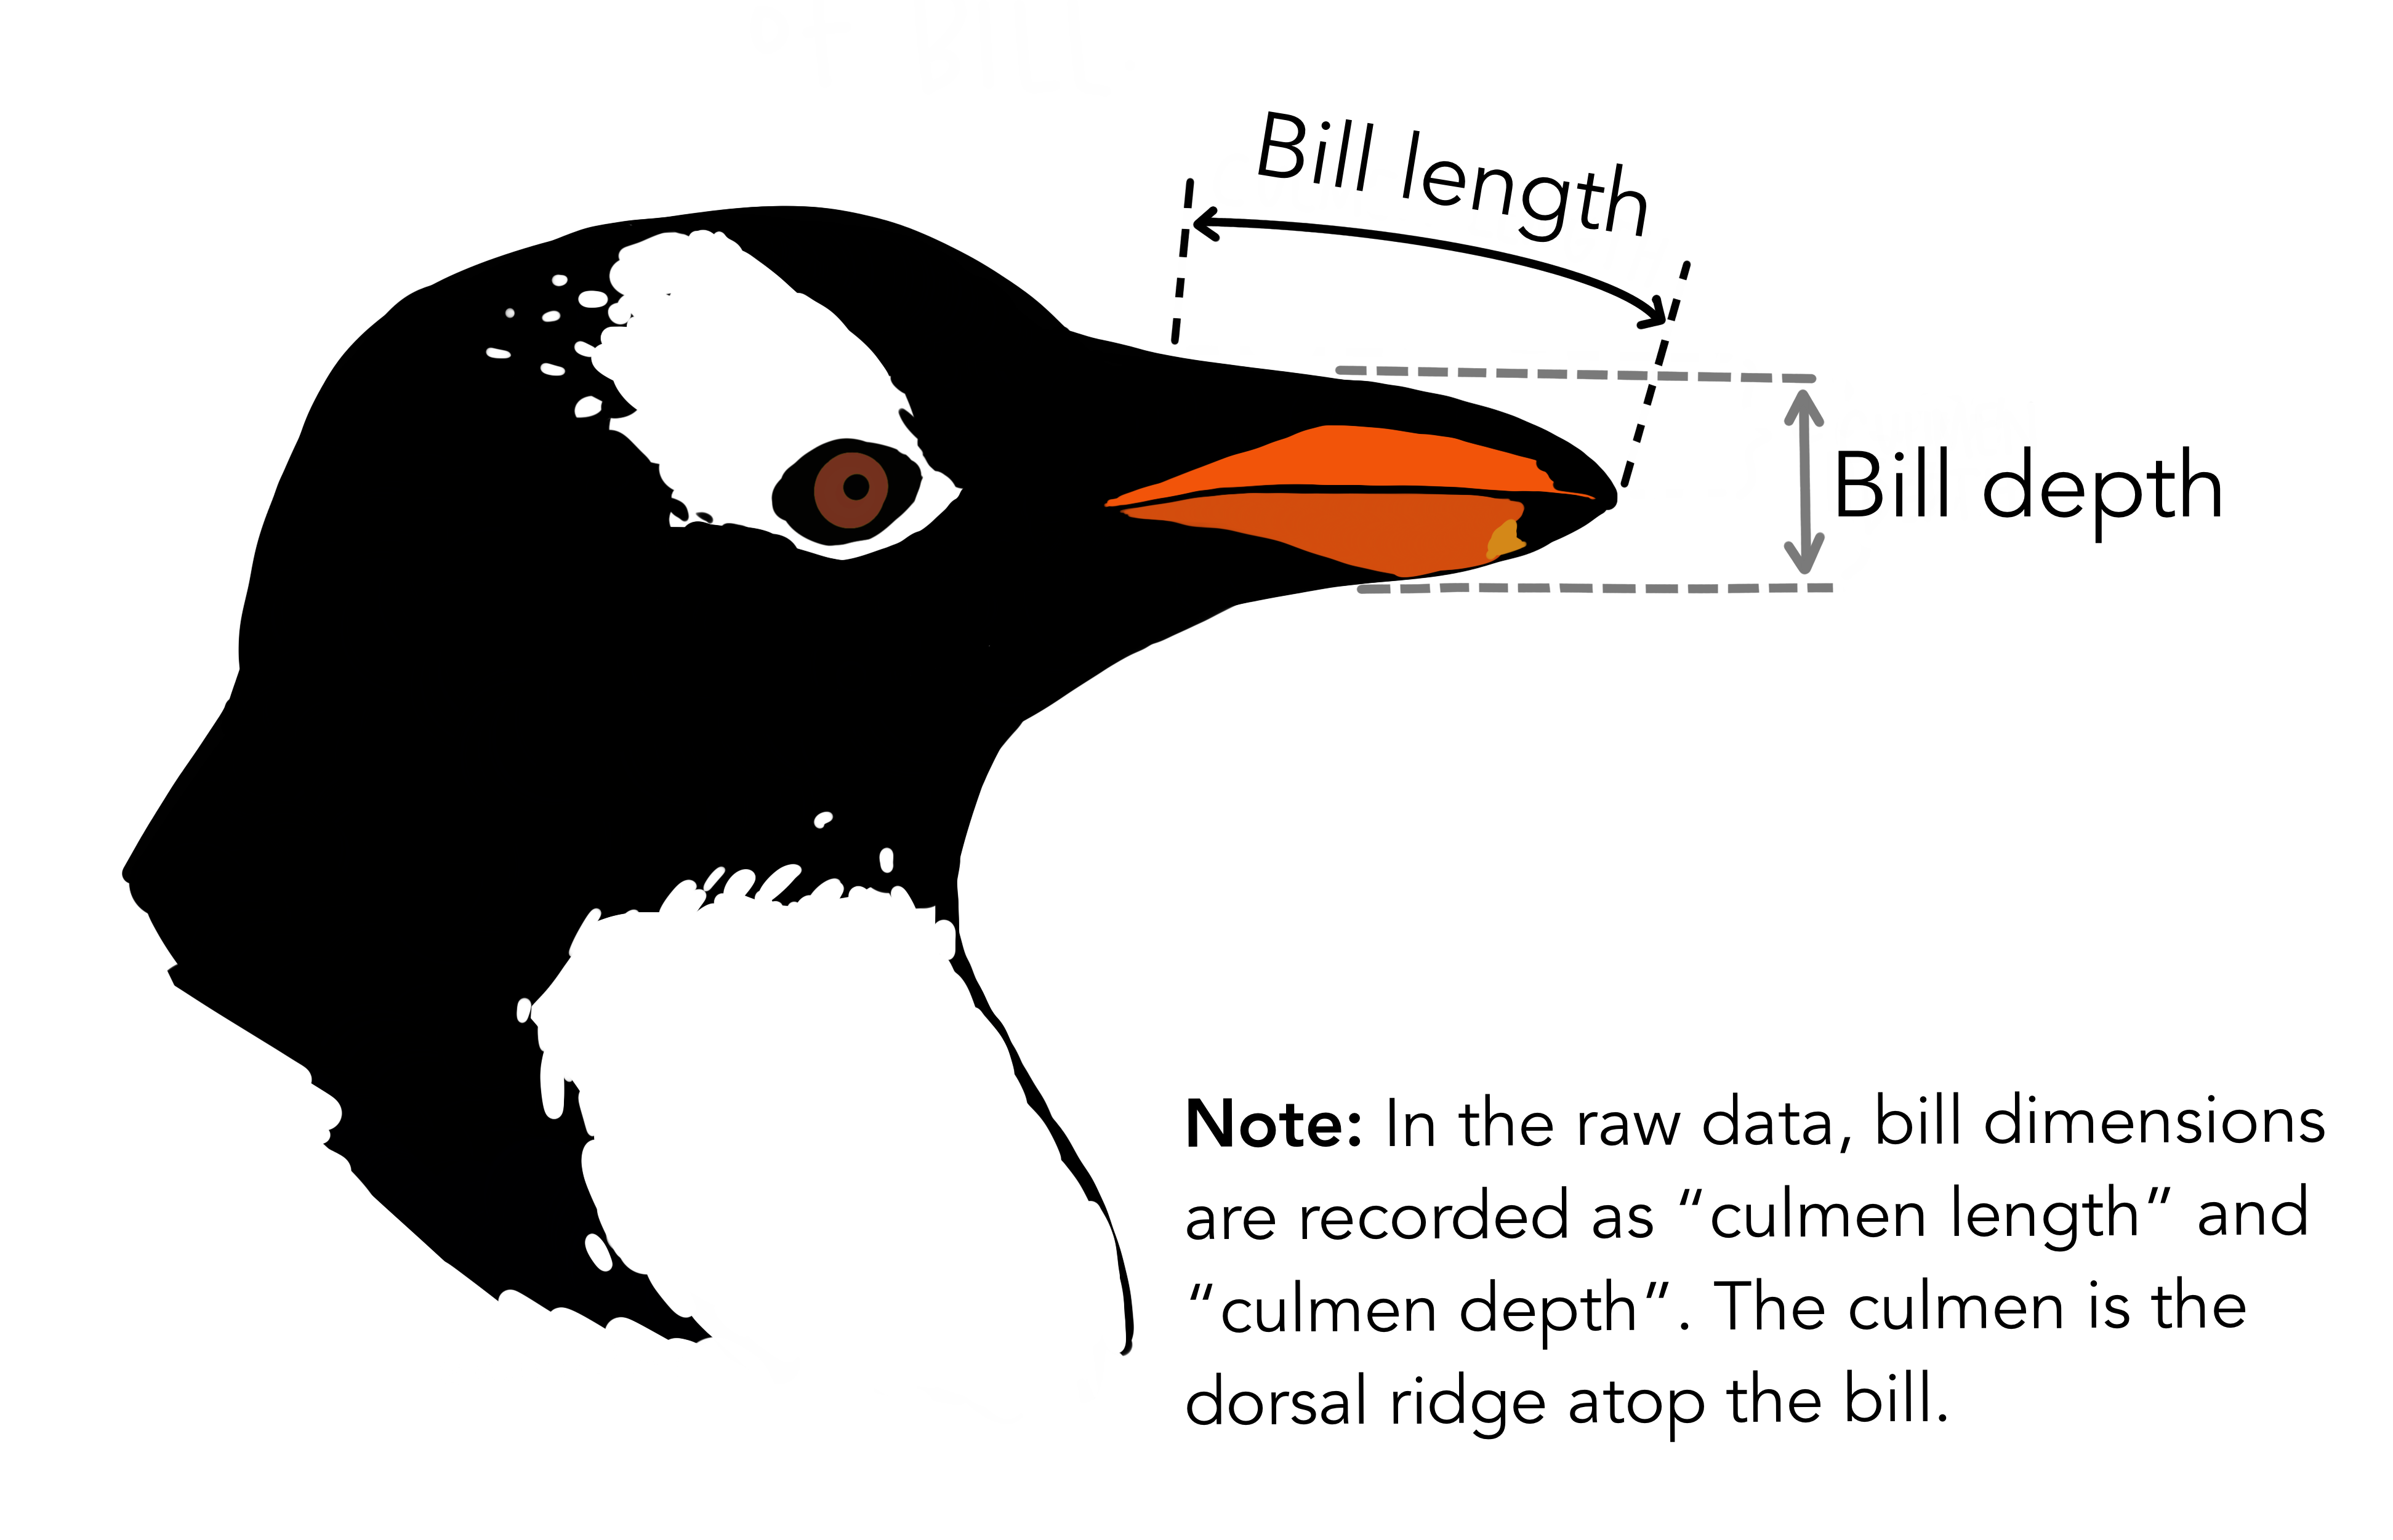
Image 1 of 1: ‘Comparison of the regressions of our dataset’
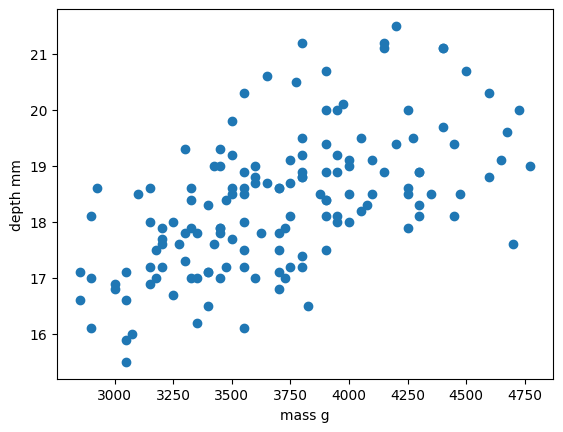
Image 1 of 1: ‘Comparison of the regressions of our dataset’
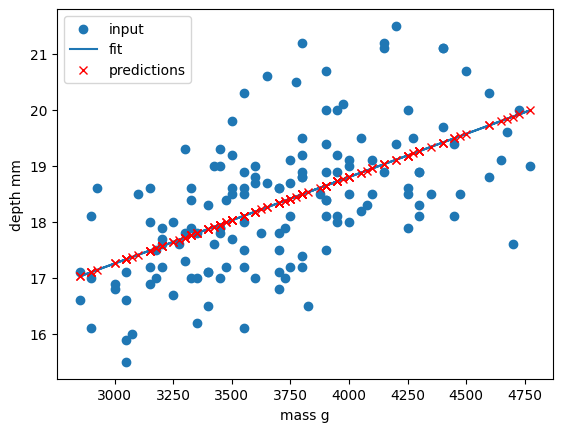
Image 1 of 1: ‘Comparison of the regressions of our dataset’
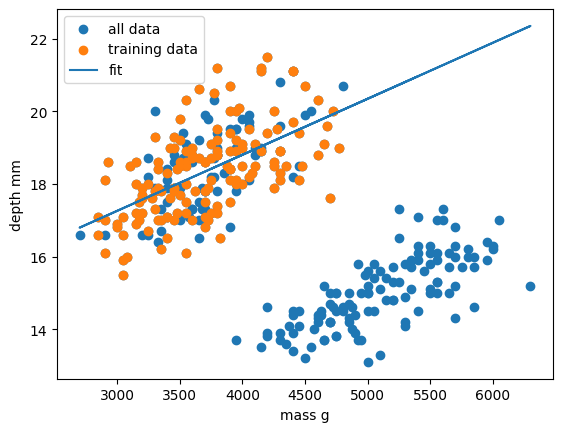
Image 1 of 1: ‘Comparison of the regressions of our dataset’
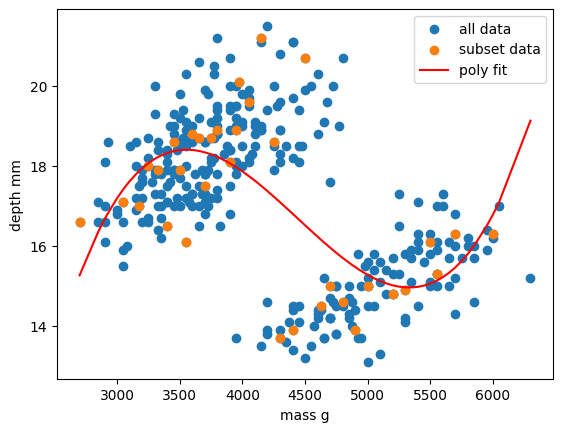
Image 1 of 1: ‘Comparison of several polynomial fits to the data.’
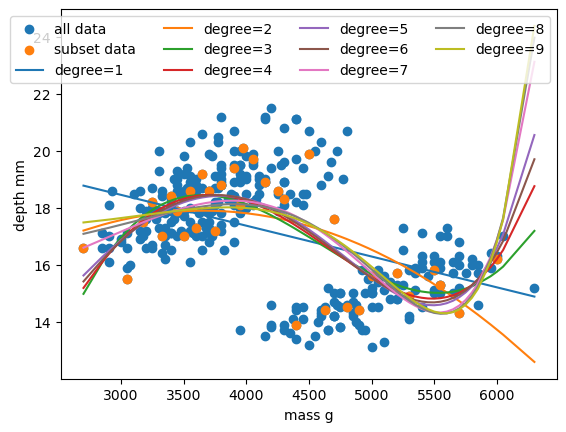
Image 1 of 1: ‘Visualising the penguins dataset’
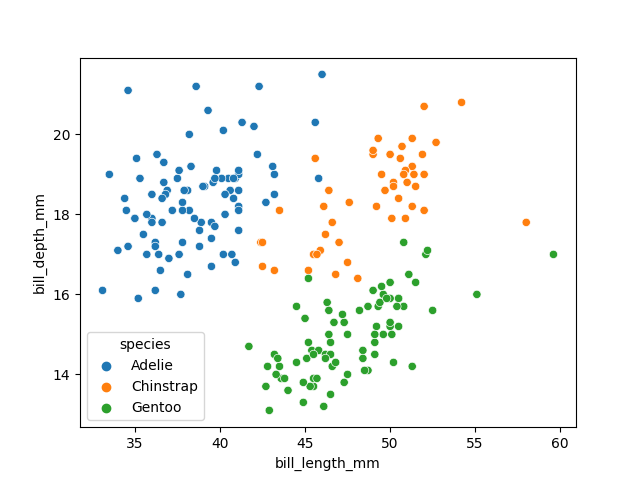
Image 1 of 1: ‘Visualising the penguins dataset’
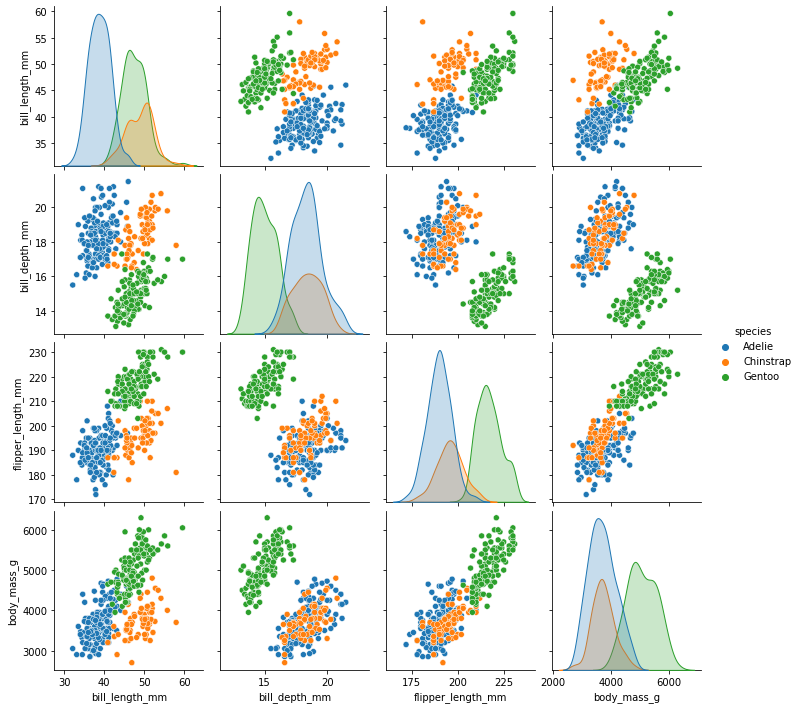
Image 1 of 1: ‘Decision tree for classifying penguins’
Image 1 of 1: ‘Decision tree for classifying penguins’
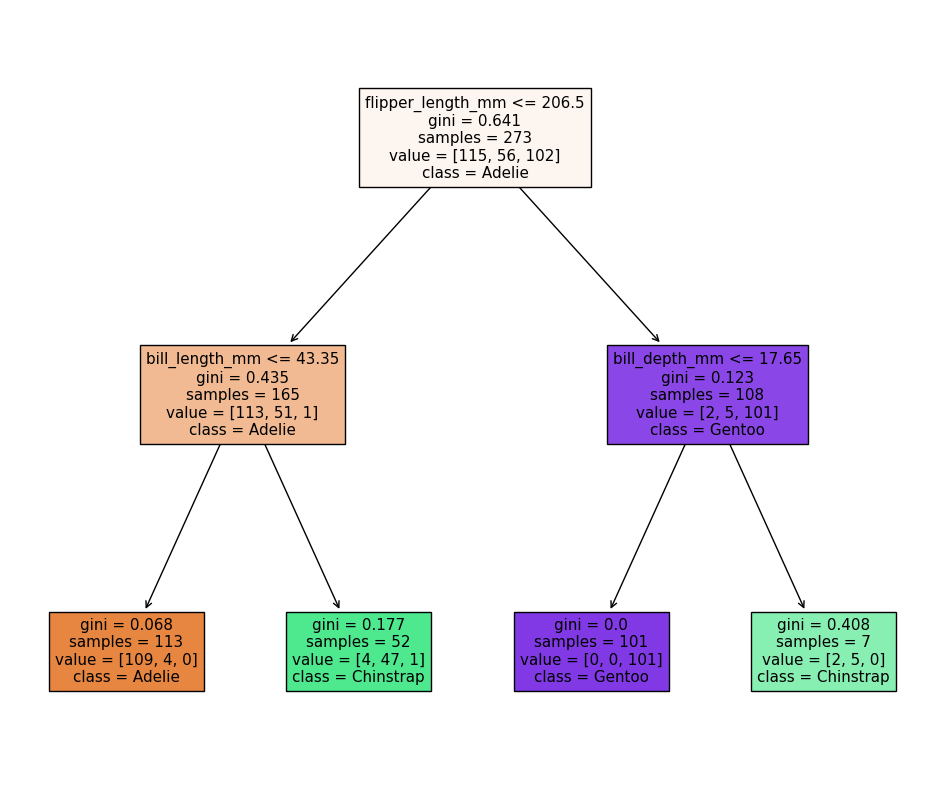
Image 1 of 1: ‘Classification space for our decision tree’
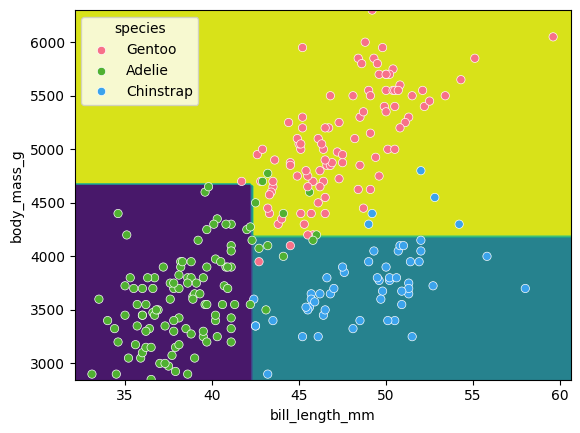
Image 1 of 1: ‘Performance of decision trees of various depths’
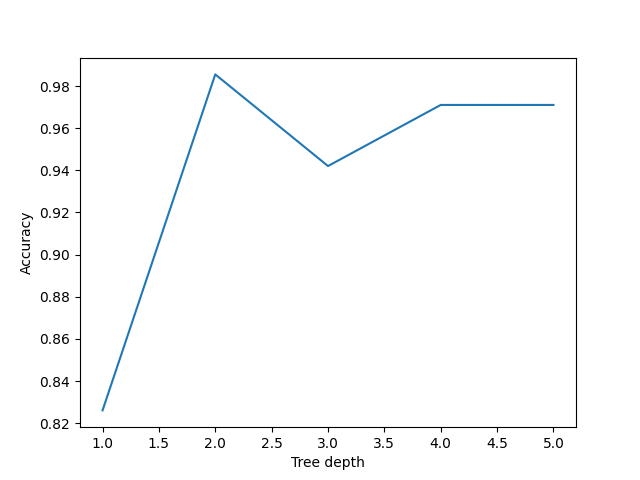
Image 1 of 1: ‘Simplified decision tree’
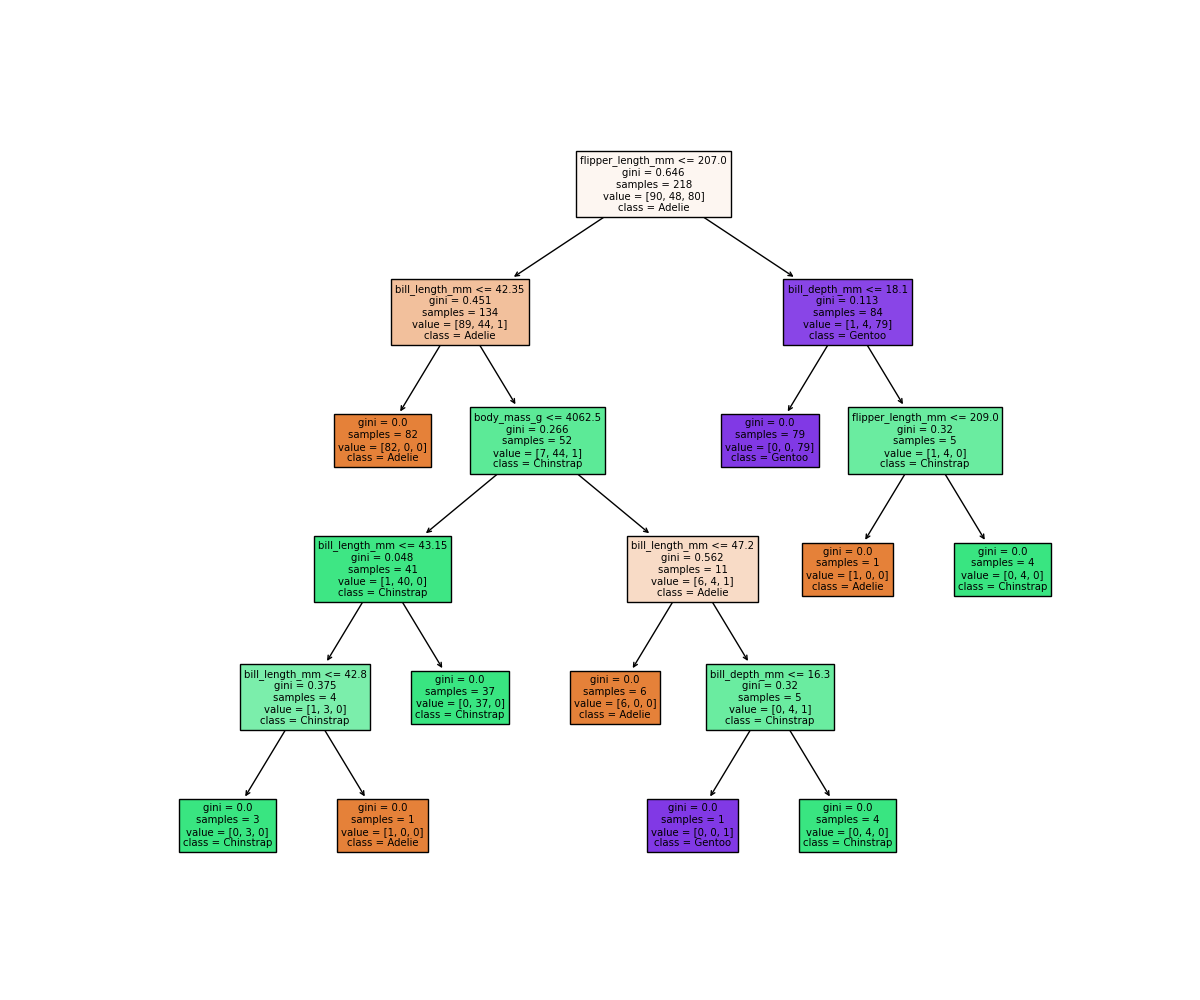
Image 1 of 1: ‘Classification space of the simplified decision tree’
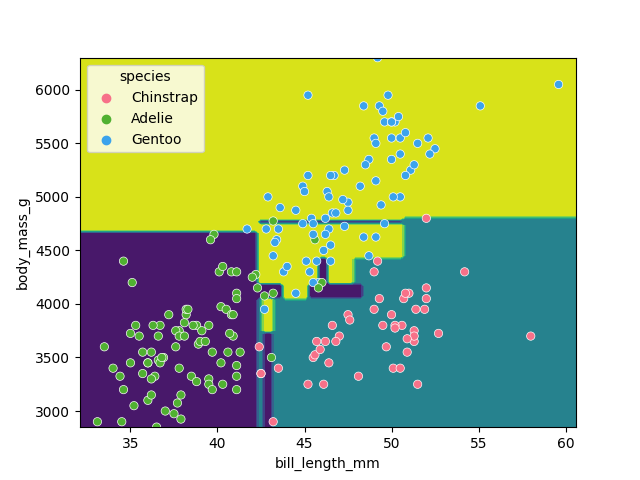
Image 1 of 1: ‘Classification space generated by the SVM model’
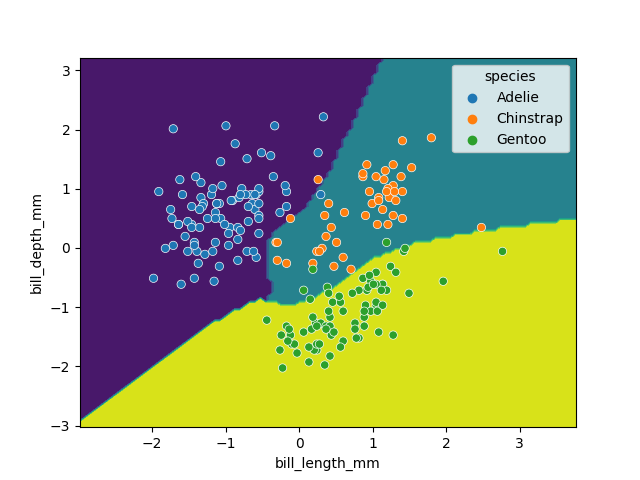
Image 1 of 1: ‘Stacking’
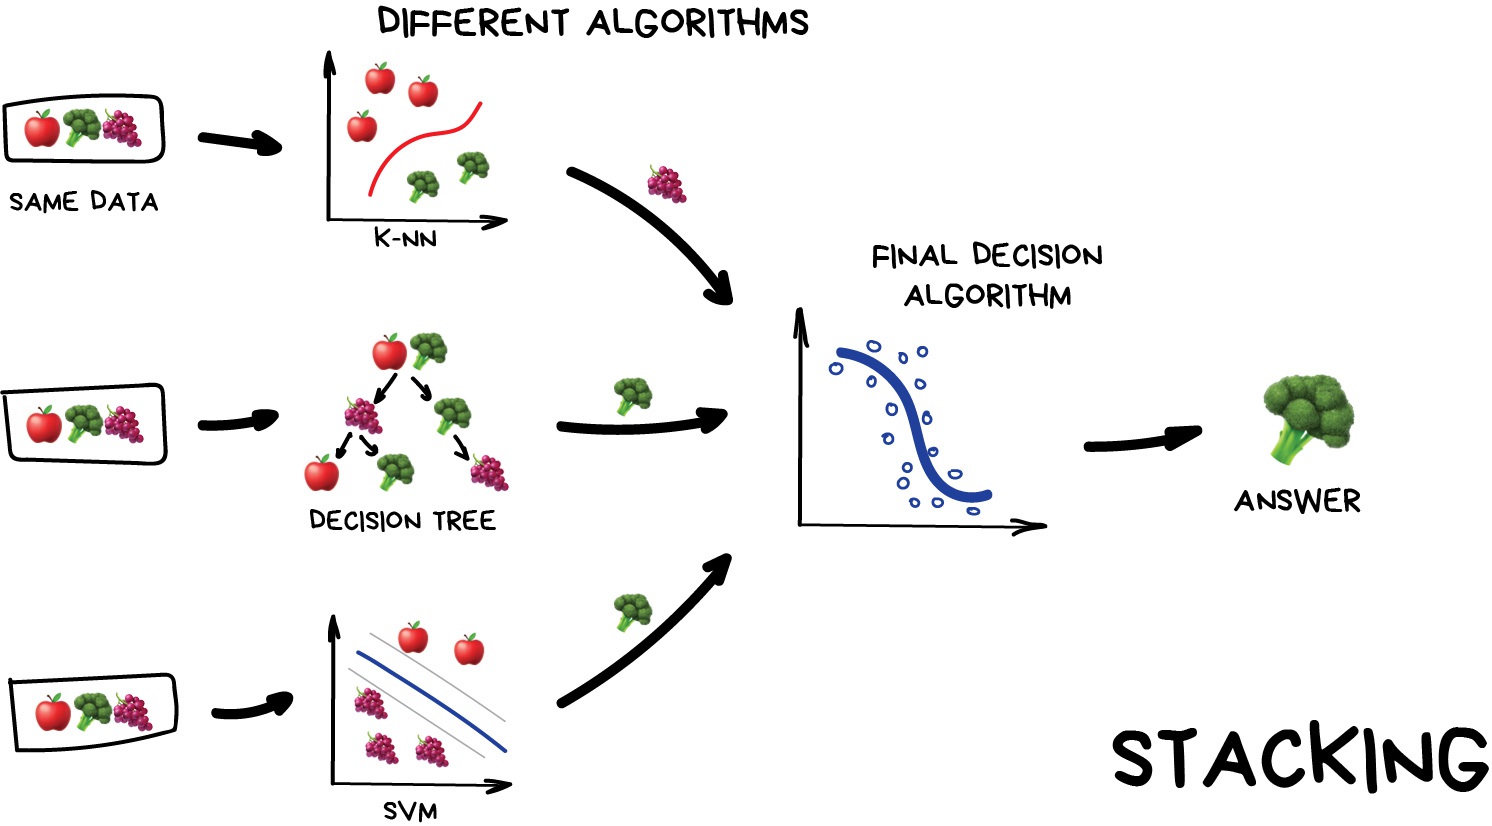
Image 1 of 1: ‘Stacking’
Image 1 of 1: ‘Stacking’
Image 1 of 1: ‘Random Forests’
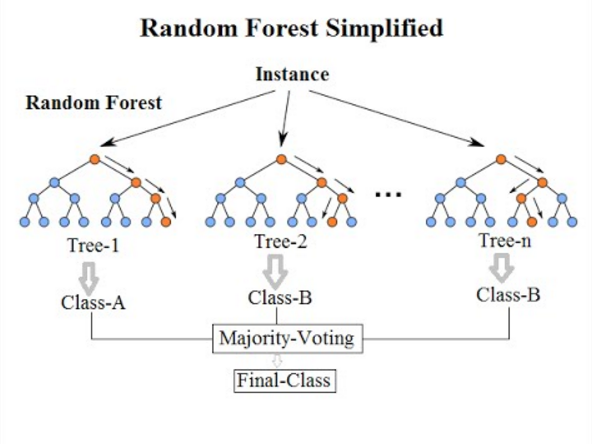
Image 1 of 1: ‘random forest trees’
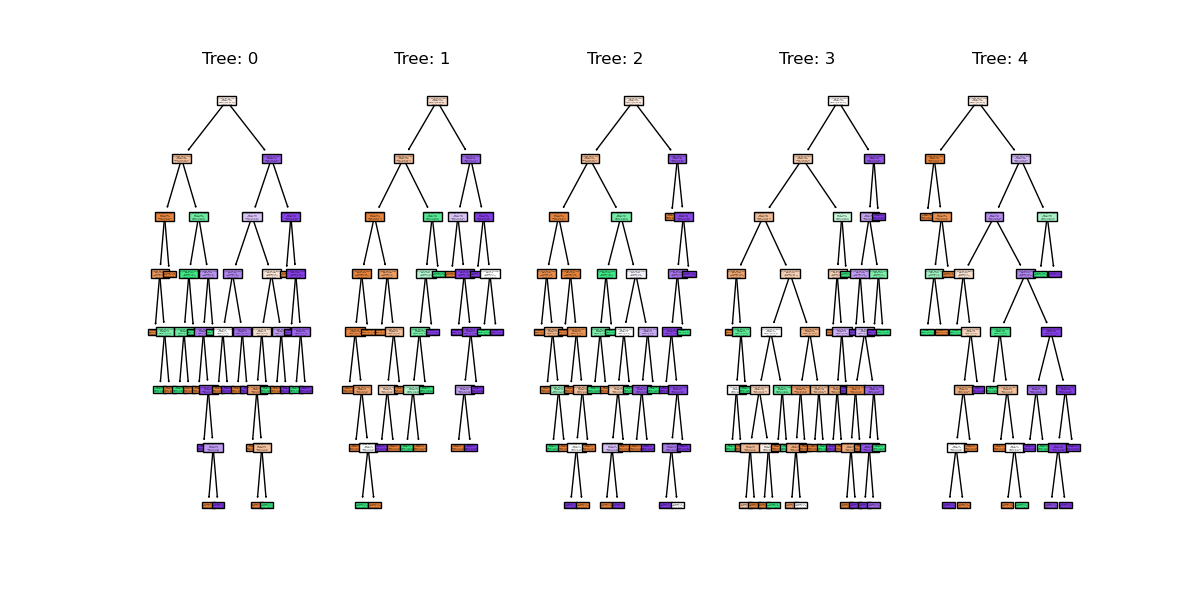
Image 1 of 1: ‘random forest clf space’
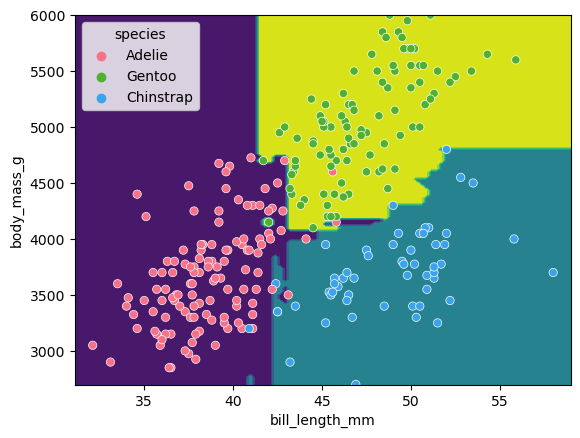
Image 1 of 1: ‘Regressor predictions and average from stack’

Image 1 of 1: ‘Plot of the random clusters’
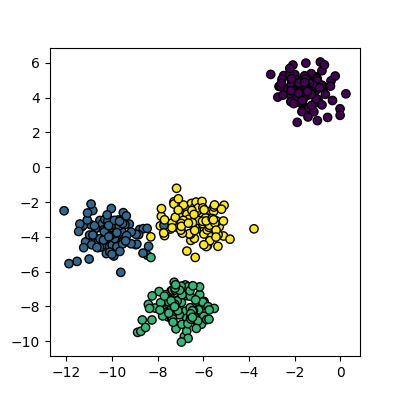
Image 1 of 1: ‘Plot of the fitted random clusters’
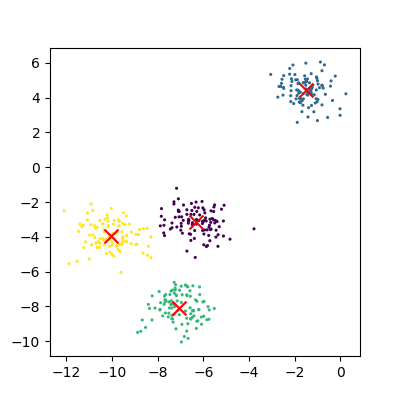
Image 1 of 2: ‘Silhouette scores for 2 clusters’
Image 2 of 2: ‘Silhouette scores for 4 clusters’
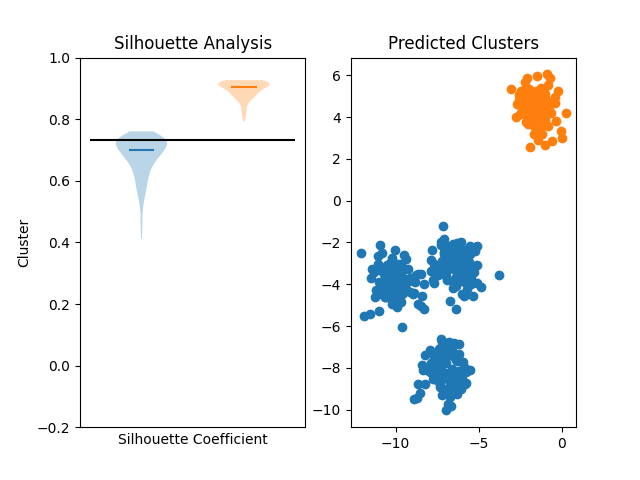
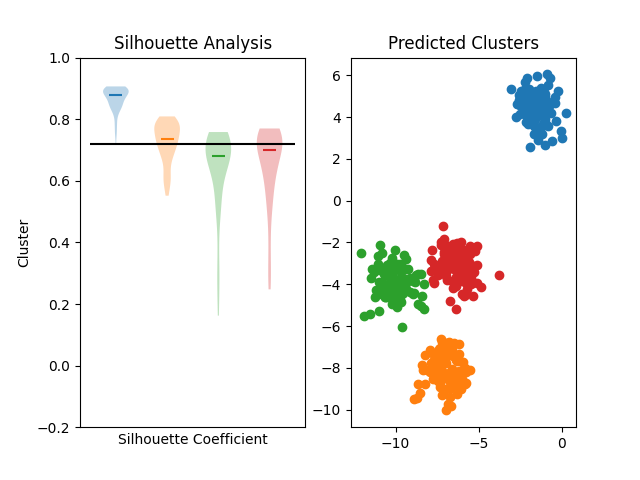
Image 1 of 1: ‘An example of kmeans failing on non-linear cluster boundaries’
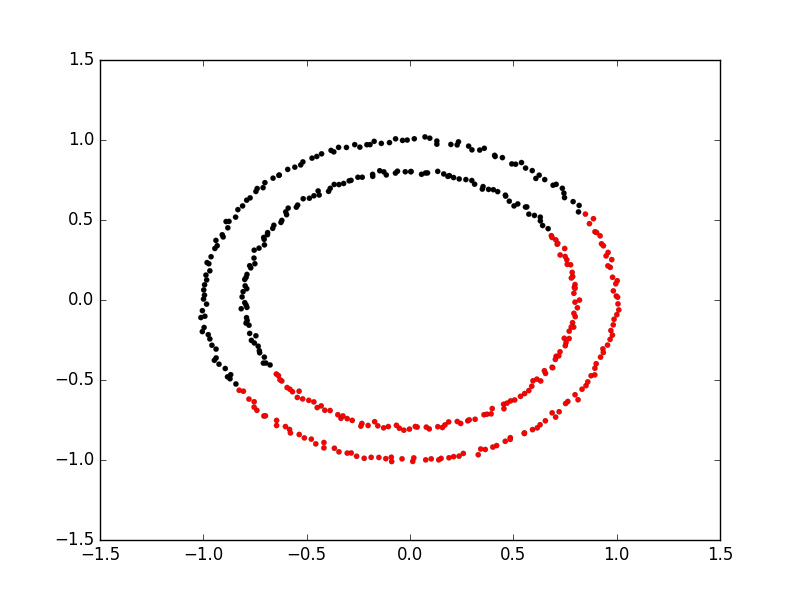
Image 1 of 1: ‘Kmeans attempting to classify overlapping clusters’
Increasing n_samples to 4000 and
cluster_std to 3.0 looks like this: 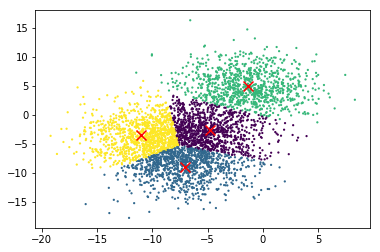 The straight
line boundaries between clusters look a bit strange.
The straight
line boundaries between clusters look a bit strange.
Image 1 of 1: ‘Spectral clustering on two concentric circles’
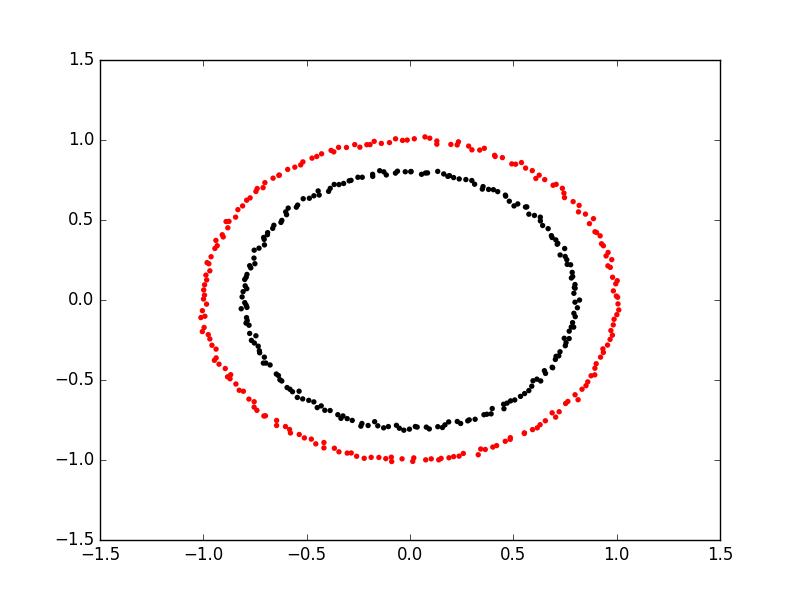
Image 1 of 1: ‘Spectral clustering viewed with an extra dimension’
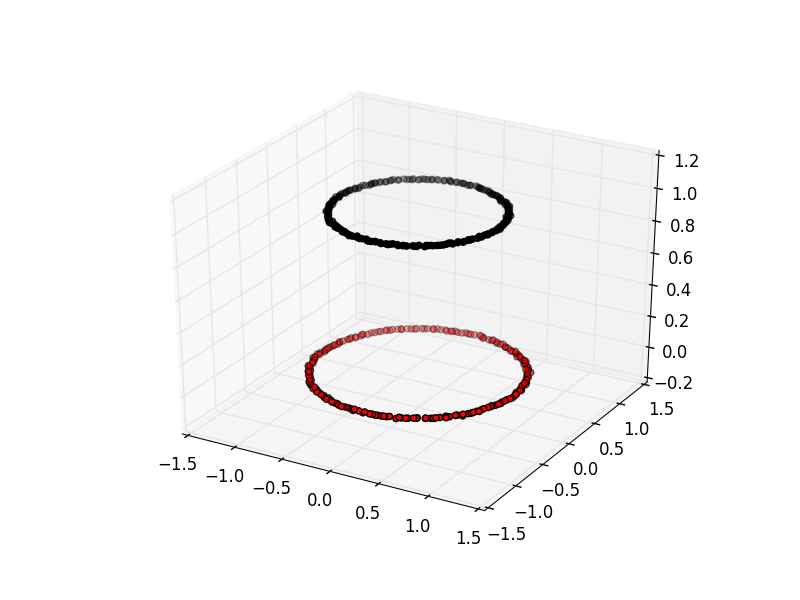
Image 1 of 2: ‘Kmeans attempting to cluster the concentric circles’
Image 2 of 2: ‘Spectral clustering on the concentric circles’
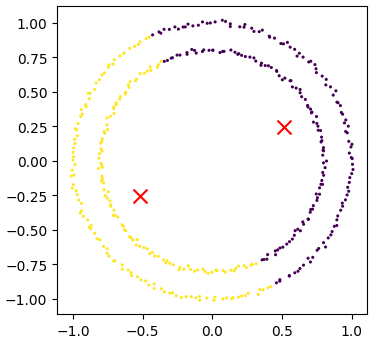
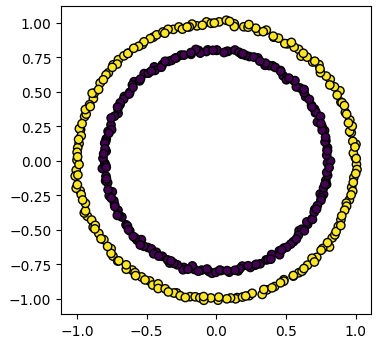
Image 1 of 1: ‘MNIST example illustrating all the classes in the dataset’
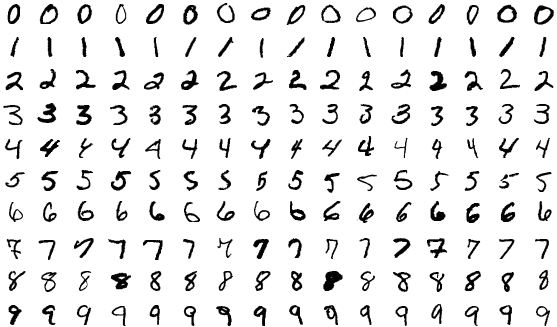
Image 1 of 1: ‘MNIST example of a single image’
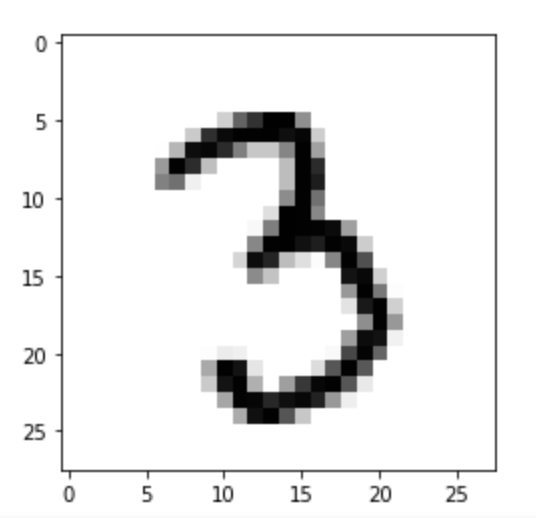
Image 1 of 1: ‘SKLearn image with highlighted pixels’
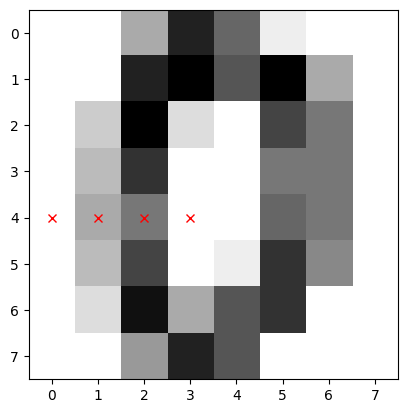
Image 1 of 1: ‘SKLearn image with highlighted pixels’
Image 1 of 1: ‘Reduction using PCA’
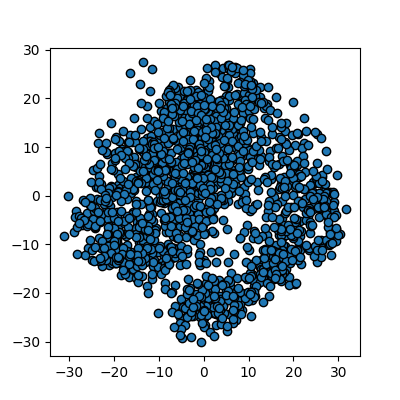
Image 1 of 1: ‘Reduction using PCA’
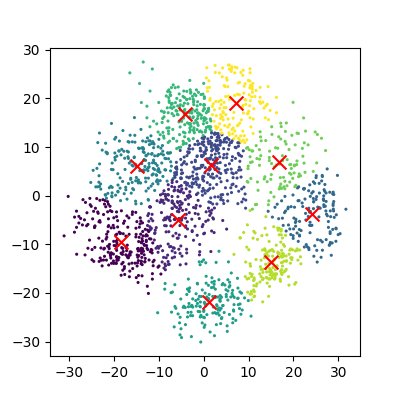
Image 1 of 1: ‘Reduction using PCA’
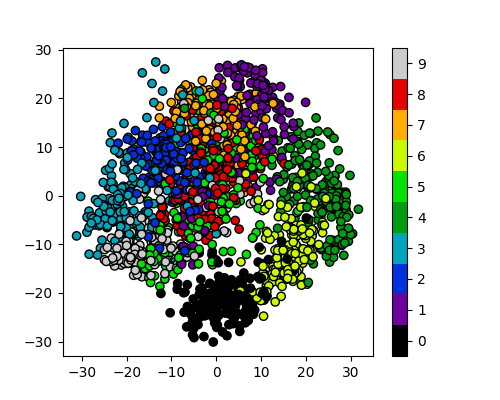
Image 1 of 1: ‘Reduction using PCA’
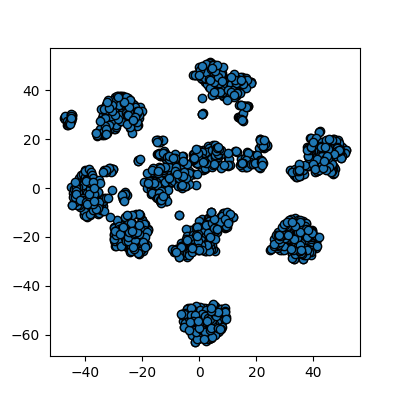
Image 1 of 2: ‘Reduction using PCA’
Image 2 of 2: ‘Reduction using PCA’
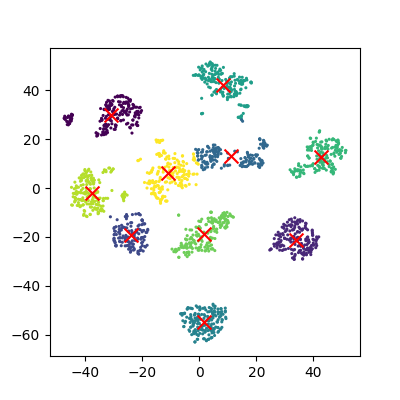
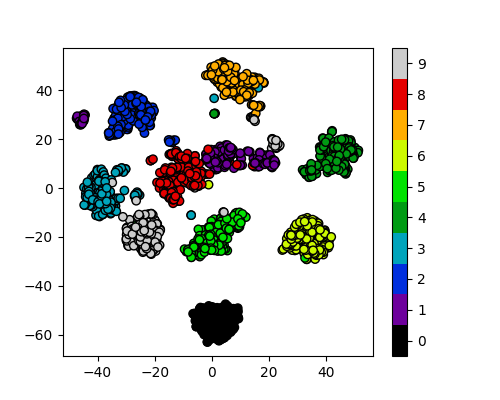
Image 1 of 1: ‘Reduction to 3 components using pca’

Image 1 of 1: ‘Reduction to 3 components using tsne’

Image 1 of 1: ‘A diagram of a perceptron’

Image 1 of 1: ‘A multi-layer perceptron’
