
Resource Requirements
Last updated on 2026-10-13 | Edit this page
Overview
Questions
- How large is my HPC cluster?
- How many resources should I request initially?
- What scheduler options exist to request resources?
- How do I know if they are used well?
Objectives
After completing this episode, participants should be able to …
- Identify the size of their jobs in relation to the HPC system.
- Request the proper amount of resources from the scheduler.
- Change the parameters to see how the execution time changes.
When you run a program on your local workstation or laptop, you typically don’t plan out the usage of computing resources like memory or core-hours. Your applications simply take as much as they need and if your computer runs out of resources, you can close unneeded applications and wait.
However, unless you are very rich, you probably don’t have a dedicated HPC cluster just to yourself. Instead you have to share one with your colleagues. In such a scenario, greedily consuming as many resources as possible is very impolite. It’s necessary to carefully allocate only as many resources as needed for the task at hand. These resource constraints are then enforced by the clusters scheduling system, such that your application can’t consume more resources than specified by your job.
Getting a feel for the size of your cluster
To start with your resource planning, it is always a good idea to first get a feeling for the size of the cluster available to you. For example, if your cluster has tens of thousands of CPU cores and you use only 10 of them, you are far away from what would be considered excessive usage of resources. However, if your calculation utilizes GPUs and your cluster has only a handful of them, you should aim at using as few as possible in your jobs.
Let’s start by getting an overview of the partitions of your cluster:
OUTPUT
PARTITION           NODES               CPUS                MEMORY              GRES                TIMELIMIT
normal              223                 36                  95000+              (null)              1-00:00:00
long                90                  36                  192000              (null)              7-00:00:00
express             6                   36                  95000+              (null)              2:00:00
zen4                46                  192                 763758+             (null)              2-00:00:00
gpuexpress          1                   32                  240000              gpu:rtx2080:7       12:00:00
gpu4090             8                   32                  360448              gpu:rtx4090:6       7-00:00:00
gpuh200             4                   128                 1547843             gpu:h200:8          7-00:00:00
In the output, we see the name of each partition, the number of nodes in this partition, the number of CPU cores per node, the amount of memory per node in Mebibytes, the number of generic resources (typically GPUs) per node and finally the maximum amount of time any job is allowed to take.
Available partitions depend on the HPC system
Partitions often represent usage policies and you should read your clusters documentation about their names, underlying hardware, potential access restrictions, and so on.
Some examples:
- A partition with a high number of cores large amounts of memory per node is probably intended for shared memory processing.
- A partition with a lot of nodes that each have only a (relatively) small number of cores and memory is probably intended for MPI calculations.
- A partition with powerful GPUs, but only a small amount of CPU cores is likely intended for jobs where the majority of the work is offloaded to the GPUs.
- A partition with less powerful GPUs but more CPU cores and memory is likely intended for hybrid workloads.
Compare the resources available in the different partitions of your local cluster. Can you draw conclusions on what the purpose of each partition is based on the resources it contains?
For our example output above we can make some educated guesses on what the partitions are supposed to be used for:
- The
normalpartition has a (relatively) small amount of memory and limits jobs to at most one day, but has by far the most nodes. This partition is probably designed for small- to medium-sized jobs. Since there are noGRESin this partition, only CPU computations can be performed here. Also, as the number of cores per node is (relatively) small, this partition only allows multithreading up to 36 threads on the same node. MPI is required for a higher degree of parallelism across multiple nodes. - The
longpartition has double the memory compared to thenormalpartition, but considerably fewer nodes. It allows for much longer running jobs. This partition is likely intended for jobs that are too big for thenormalpartition. -
expressis a very small partition with a similar configuration tonormal, but a very short time limit of only 2 hours. The purpose of this partition is likely testing and very short running jobs like software compilation. - Unlike the former partitions,
zen4has a lot more cores and memory per node. The intent of this partition is probably to run jobs using large-scale multithreading. The name of the partitions implies a certain CPU generation (AMD Zen 4), which appears to be newer than the CPU model used in thenormal,longandexpresspartitions (typically core counts increase in newer CPU generations). -
gpuexpressis the first partition that features GPU resources. However, with only a single node and a maximum job duration of 12 hours, this partition seems to be intended again for testing purposes rather than large-scale computations. This also matches the relatively old GPU model. - In contrast,
gpu4090has more nodes and a much longer walltime of seven days and is thus suitable for actual HPC workloads. Given the low number of CPU cores, this partition is intended for GPU workloads only. More details can be gleamed from the GPU model used in this partition (RTX 4090). This GPU type is typically used for Workloads using single-precision floating point calculations. - Finally, the
gpuh200partition combines a large number of very powerful H200 GPUs with a high core count and a very large amount of memory. This partition seems to be intended for the heaviest workloads that can make use of both CPU and GPU resources. The drawback is the low number of nodes in this partition.
To get a point of reference, you can also compare the total number of cores in the entire cluster to the number of CPU cores on the login node or on your local machine.
OUTPUT
CPU(s):                               192
NUMA node0 CPU(s):                    0-191
If lscpu is not available on your machine, you can also
use
OUTPUT
192With \(223\ \text{nodes} \times 36\ \text{cores}(+ \text{other partitions})\) CPU cores, the cluster has multiple orders of magnitude more cores in total than the login node or your local machine.
To see the amount of memory on the machine you are logged into you can use
OUTPUT
MemTotal: 395695636 kBAgain, the total memory of the cluster is going to be much, much larger than the memory of any individual machine.
All of the CPU cores and memory are shared between you and all the other users of your cluster. To get a feeling for the amount of resources per user, let’s try to get an estimate for how many users there are by counting the number of home directories.
OUTPUT
700On some clusters, home directories are not placed directly in
/home, but are split up into subdirectories first (e.g., by
first letter of the username like /home/s/someuser). In
this case, you have to use -maxdepth 2 -mindepth 2 to count
the contents of these subdirectories. If your cluster does not use
/home for the users’ home directories, you might have to
use a different path (check dirname "$HOME" for a clue).
Also, this command only gives an upper limit to the number of real
cluster users as there might be home directories for service users as
well.
By dividing the total number of cores / the total memory by the amount of users, you get an estimate of how many resources each user has available if resources were equally distributed world. For example, for 700 users we would approximately get:
| Partition | CPU Cores / user | Memory / user | GRES / user |
|---|---|---|---|
normal |
32 | 85 GiB | - |
long |
13 | 69 GiB | - |
express |
1 | 2 GiB | - |
zen4 |
35 | 141 GiB | - |
gpuexpress |
0.128 | 1 GiB | 0.028 |
gpu4090 |
1 | 12 GiB | 0.192 |
gpuh200 |
2 | 25 GiB | 0.128 |
Do the per-user limits mean we can never use more than this amount of resources?
Users are typically not limited to the average per-user resources that we’ve calculated here. In reality, we observe:
- The average is over a long periods of time. Short term you can usually use much more.
- Users are in different phases of their projects, some may require computational resources while others are still in preparation and need them later.
- Many users do not use their full share of resources, which leaves room for others to use more.
- Not all users are equal. For example, if some research groups have contributed to the funding of the cluster, they should also get more resources than those who did not.
- The world is not perfectly fair. Especially on larger clusters, HPC resources have to be requested via project proposals. Those who write more / better proposals can use more resources.
In practice it is really difficult to “saturate” your own share of the cluster with calculations over a long period of time. This is one of the reasons why a large and shared HPC system can be more efficient than individual computing resources.
Now that you have an idea of how big your cluster is, you can start to make informed decisions on how many resources are reasonable to ask for.
Challenge
sinfo can show a lot more information on the nodes and
partitions of your cluster. Check out the documentation
and experiment with additional output options. Try to find a single
command that will shows for each command the number of allocated and
idle nodes and CPU cores.
BASH
$ sinfo -O Partition,CPUsState,NodeAIOT
PARTITION           CPUS(A/I/O/T)       NODES(A/I/O/T)
normal*             6336/720/972/8028   196/0/27/223
long                2205/351/684/3240   71/0/19/90
express             44/172/0/216        3/3/0/6
zen4                7532/1108/192/8832  44/1/1/46
gpuexpress          0/32/0/32           0/1/0/1
gpu4090             177/35/44/256       7/0/1/8
gpuh200             90/166/256/512      2/0/2/4
Sizing your jobs
The resources required by your jobs primarily depend on the application you want to run and are thus very specific to your particular HPC use case.
Generously over-allocating resource requirements as a strategy to ensure job completion is usually counterproductive. Not only might you face the wrath of your cluster administrators (and other users!) for being overly greedy, but you may also be punished by the scheduler itself: large jobs have to wait longer for the resources to free up, while small jobs can be “squeezed” into the gaps between larger jobs. Also, you should remember that you are billed for the amount of resources you requested from the scheduler and not how much you actually use. In short, capping resource requests at actual job requirements helps reduce queue times and conserves your compute budget.
Finding the right amount of resources is often a matter of trial and
error as many applications do not have precisely predictable resource
requirements. Let’s try this for our snowman renderer. Put the following
in a file named snowman.job:
BASH
#!/bin/bash
#SBATCH --nodes=1
#SBATCH --partition=<put your partition here>
#SBATCH --ntasks=4
#SBATCH --cpus-per-task=1
#SBATCH --mem=1G
#SBATCH --time=00:01:00
#SBATCH --output=snowman-stdout-%j.log
#SBATCH --job-name=snowman

# Always a good idea to purge modules first to start with a clean module environment
module purge
# <put the module load commands for your cluster here>

# Start the raytracer
mpirun -n 4 ./SnowmanRaytracer/build/raytracer -width=1024 -height=1024 -spp=256 -threads=1 -alloc_mode=3 -png=snowman.png
We define job resource requirements through the following
#SBATCH directives (line-by-line):
- 1 node …
- … from the partition
<put your partition here> - 4 MPI tasks …
- … each of which uses one CPU core (so 4 cores in total)
- 1 GB of memory per node
- A timelimit of 1 minute
The last two #SBATCH directives redirect the jobs output
to the file snowman-stdout-<job id>.log and assign
the name “snowman” to the job.
How much --mem do I get?
The --mem directive can be confusing as it does not
define the total amount of memory of your job, but the total amount of
memory per node. Here, this distinction does not matter as we
only use one node, but you should keep in mind that changing the number
of nodes often implies that you need to adapt the --mem
value as well. Alternatively, you can also use the
--mem-per-cpu directive such that the memory allocation
automatically scales with the number of cores. However, even in this
case you need to verify that your memory consumption actually scales
linearly with the number of cores for your application!
To test if our estimate works, you have to submit the job to the scheduler:
This command will also print the ID of the job, so we can observe what is happening with it. Wait a bit and have a look at how your job is doing:
We use the flag -X to only show a single summarising
line per job. After a while, you will see that the status of your job is
given as TIMEOUT.
Check the file snowman-stdout.log as well. Near the
bottom you will see a line like this:
OUTPUT
slurmstepd: error: *** JOB 1234567 ON somenode CANCELLED AT 2025-04-01T13:37:00 DUE TO TIME LIMIT ***Evidently, our job was aborted because it did not finish within the time limit of one minute that we set above. Let’s try giving our job a time limit of 10 minutes instead.
This time the job should succeed and show a status of “COMPLETED” in
sacct. We can check the resources actually needed by our
job with the help of seff:
The output of seff contains many useful bits of
information for sizing our job. In particular, let’s look at these
lines:
OUTPUT
[...]
CPU Utilized: 00:21:34
CPU Efficiency: 98.93% of 00:21:48 core-walltime
Job Wall-clock time: 00:05:27
Memory Utilized: 367.28 MB
Memory Efficiency: 35.87% of 1.00 GBMeasurements are hardware dependent!
The exact numbers here depend a lot on the hardware and software of your local cluster. Differences between two HPC systems or even different partitions on the same HPC system may be caused by different CPU generations, larger or smaller memory bandwidths, file system and network technologies, etc.
The Job Wall-clock time is the time our job took. As we
can see, our job takes much longer than one minute to complete which is
why our first attempt with a time limit of one minute has failed.
The CPU Utilized line shows us how much CPU time our job
has used. This is calculated by determining the busy time for each core
and then summing these times for all cores. In an ideal world, the CPU
cores should be busy for the entire time of our job, so the CPU time
should be equal to the time the job took times the number of CPU cores.
The ratio between the real CPU time and the ideal CPU time is shown in
the CPU Efficiency line.
Finally, Memory utilized line shows the peak memory
consumption that your job had at any point during its runtime, while
Memory Efficiency is the ratio between this peak value and
the requested amount of memory for the allocation. As we will see later,
this value has to be taken with a grain of salt.
Starting from the set of parameters that successfully run our
program, we can now try to reduce the amount of requested resources. As
is good scientific practice, we should only vary one parameter at a time
and observe the result. Let’s start by reducing the time limit. There is
often a bit of variation in the time needed to run a job since not all
nodes are perfectly identical, so you should add an arbitrarily chosen
safety margin of maybe 10 percent. According to the time reported by
seff, seven minutes should therefore be a good time limit.
If your cluster is faster, you might reduce this even further.
As you can see, your job will still complete successfully.
Sizing your jobs: Memory
Next, we can optimize our memory allocation. According to Slurm, we used 367.28 MB of memory in our last run, so let’s set the memory limit to 500 MB.
After submitting the job with the lowered memory allocation
everything seems fine for a while. But then, right at the end of the
computation, our job will crash. Checking the job status with
sacct will reveal that the job status is
OUT_OF_MEMORY meaning that our job exceeded its memory
limit and was terminated by the scheduler.
This behavior seems contradictory at first: Slurm reported previously that our job only used around 367 MB of memory at most, which is well below the 500 MB limit we set. The explanation for this discrepancy lies in the fact that Slurm measures the peak memory consumption of jobs by polling, i.e., by periodically sampling how much memory the job currently uses. Unfortunately, if the program has spikes in memory consumption that are small enough to fit between two samples, Slurm will miss them and report an incorrect peak memory value. Spikes in memory usage are quite common, for example if your application uses short-lived subprocesses. Most annoyingly, many programs allocate a large chunk of memory right at the end of the computation to write out the results. In the case of the snowman raytracer, we encode the raw pixel data into a PNG at the end, which means we temporarily keep both the raw image and the PNG data in memory.
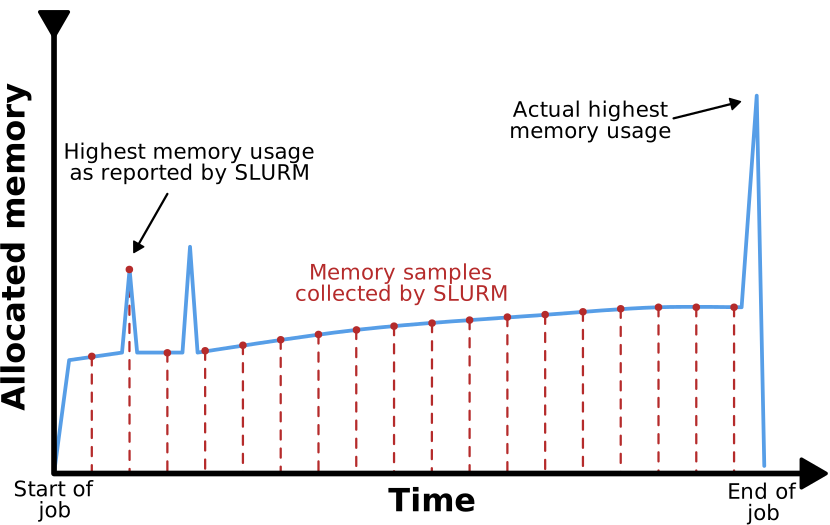
Slurm determines memory consuption by polling, i.e.,
periodically checking on the memory consumption of your job. If you job
has a memory allocation profile with short spikes in memory usage, the
value reported by seff can be incorrect. In particular, if
the job gets cancelled due to memory exhaustion, you should not rely on
the value reported by seff as it is likely significantly
too low.
So how big is the peak memory consumption of our process really? Luckily, the Linux kernel keeps track of this for us, if Slurm is configured to use the so-called “cgroups v2” mechanism to enforce resource limits (which many HPC systems are). Let’s use this system to find out how much memory the raytracer actually needs. First, we set the memory limit back to 1 GB, i.e., to a configuration that is known to work.
Next, add these lines at the end of your job script:
BASH
echo -n "Total amount of memory used (in bytes): "
CGROUPPATH="$(cat /proc/self/cgroup | awk -F ':' '{print $3}')"
cat /sys/fs/cgroup/${CGROUPPATH}/memory.peak
Let’s break down what each line does:
- The first line prints out a nice label for our peak memory output.
We use
-nto omit the usual newline thatechoadds at the end of its output. - For the next part we need the so-called “cgroup path” of our job. To
find out this path, we can use the
/proc/self/cgroupfile, which contains this path as the third entry of a colon-separated list. Therefore, we read the contents of this file (cat) and extract the third entry of the colon-separated list (awk -F ':' '{print $3}'). Since we do this in$(...), Bash will place the output of these commands (i.e., the cgroup path) in the variableCGROUPPATH. - The third line outputs the contents of a file (
cat). The path of this file starts with/sys/fs/cgroup, which is a location where the Linux kernel exports all the cgroups v2 information as files, followed by the cgroup path of our job in theCGROUPPATHvariable. - The final part of the path is the information we actually want from
the cgroup. In our case, we are interested in
memory.peak, which contains the peak memory consumption of the cgroup.
When you submit your job and look at the output once it finishes, you will find a line like this:
OUTPUT
[...]
Total amount of memory used (in bytes): 579346432
[...]
So even though Slurm reported our job to only use 367.28 MB of memory, we actually used nearly 600 MB! With this measurement we can make an informed decision on how to set the memory limit for our job:
Run your job again with this limit to verify that it completes successfully.
Too tight memory limits can reduce performance!
Slurm enforces memory limits for all processes in a job. Besides the applications memory demand (RSS - resident set size), this also includes caching mechanism of the Linux Kernel, e.g. for file I/O.
Too tight memory limits can cause too small caches next to the applications memory demand. This in turn can severely reduce the jobs performance in some cases.
Sizing your jobs: CPU Cores
So far we have tuned the time and memory limits of our job. Now let us have a look at the CPU core limit.
This limit works slightly differently than the ones we looked at so
far in the sense that your job is not getting terminated if you try to
use more cores than you have allocated. Instead, the scheduler exploits
the fact that multitasking operating systems can switch out the process
a given CPU core is working on. If you have more active processes in
your job than you have CPU cores (i.e., CPU oversubscription),
the operating system will simply switch processes in and out while
trying to ensure that each process gets an equal amount of CPU time.
This happens very fast, so you can’t see the switching directly, but
tools like top will show your processes running at less
than 100% CPU utilization.
Below you can see a situation of four processes running on three CPU cores, which results in each process running only 75% of the time.

CPU oversubscription can be harmful to performance as switching between processes by the operating system can cost a significant amount of CPU time itself.
Let’s try reducing the number of cores we allocate by reducing the number of MPI tasks we request in our job script:
Now we have a mismatch between the number of tasks we request and the
number of tasks we use in mpirun. However, MPI catches our
folly and prevents us from accidentally oversubscribing our CPU cores.
In the output file you see the full explanation
OUTPUT
There are not enough slots available in the system to satisfy the 4
slots that were requested by the application:

  ./SnowmanRaytracer/build/raytracer

Either request fewer procs for your application, or make more slots
available for use.

A "slot" is the PRRTE term for an allocatable unit where we can
launch a process.  The number of slots available are defined by the
environment in which PRRTE processes are run:

  1. Hostfile, via "slots=N" clauses (N defaults to number of
     processor cores if not provided)
  2. The --host command line parameter, via a ":N" suffix on the
     hostname (N defaults to 1 if not provided)
  3. Resource manager (e.g., Slurm, PBS/Torque, LSF, etc.)
  4. If none of a hostfile, the --host command line parameter, or an
     RM is present, PRRTE defaults to the number of processor cores

In all the above cases, if you want PRRTE to default to the number
of hardware threads instead of the number of processor cores, use the
--use-hwthread-cpus option.

Alternatively, you can use the --map-by :OVERSUBSCRIBE option to ignore the
number of available slots when deciding the number of processes to
launch.
If we actually want to see oversubscription in action, we need to switch from MPI to multithreading. First, let us try without oversubscribing the CPU cores:
BASH
#SBATCH --ntasks=1
#SBATCH --cpus-per-task=4

# [...]

./SnowmanRaytracer/build/raytracer -width=1024 -height=1024 -spp=256 -threads=4 -alloc_mode=3 -png=snowman.png
We use the output of seff as a baseline for our
multithreaded job:
OUTPUT
[...]
CPU Utilized: 00:21:32
CPU Efficiency: 99.08% of 00:21:44 core-walltime
Job Wall-clock time: 00:05:26
Memory Utilized: 90.85 MB
Memory Efficiency: 12.11% of 750.00 MB
Challenge
Compare our measurements for 4 threads here to the measurements we made for doing the computation with 4 MPI tasks earlier. What metrics are similar and which ones are different? Do you have an explanation for this?
We can see that the CPU utilization time and the walltime are virtually identical to the MPI version of our job, while the memory utilization is much lower. The exact reasons for this will be discussed in the following episodes, but here is the gist of it:
- Our job is strongly compute-bound, i.e., the time our job takes is mostly determined by how fast the CPU can do its calculations. This is why it does not matter much for CPU utilization whether we use MPI or threads as long as both can keep the same number of CPU cores busy.
- MPI typically incurs an overhead in CPU usage and memory due to the need to communicate between the tasks (in comparison, threads can share a block of memory without communication). In our raytracer, this overhead for CPU usage is negligible (hence the same CPU utilization time metrics), but there is a significant memory overhead.
Now let’s see what happens when we oversubscribe our CPU by doubling the number of threads without increasing the number of allocated cores in our job script:
BASH
./SnowmanRaytracer/build/raytracer -width=1024 -height=1024 -spp=256 -threads=8 -alloc_mode=3 -png=snowman.pngChallenge
If you cluster allows direct access to the compute nodes, try logging into the node your job is running on and watch the CPU utilization live using
Compare the CPU utilization of the raytracter threads
with different total numbers of threads.
In the top right of top you can also see a metric called
load average. Simplified, this is the number of processes /
threads that are currently either running or could run if a CPU core was
free. Compare the amount of load you generate with your job depending on
the number of threads.
You can see that the CPU utilization of each raytracer
thread goes down as the number of threads increases. This means, each
process is only active for a fraction of the total compute time as the
operating system switches between threads.
For the load metric, you can see that the load increases linearly with the number of threads regardless if they are actually running or waiting for a CPU core. Load is a fairly common metric to be monitored by cluster administrators, so if you cause excessive load by CPU oversubscription you will probably hear from your local admin.
Despite using twice the amount of threads, we barely see any
difference in the output of seff:
OUTPUT
CPU Utilized: 00:21:29
CPU Efficiency: 98.85% of 00:21:44 core-walltime
Job Wall-clock time: 00:05:26
Memory Utilized: 93.32 MB
Memory Efficiency: 12.44% of 750.00 MB
This shows that despite having more threads, the CPU cores are not performing more work. Instead, the operating system periodically rotates the threads running on each allocated core, making sure every thread gets a time slice to make progress.
Let’s see what happens when we increase the thread count to extreme levels:
BASH
./SnowmanRaytracer/build/raytracer -width=1024 -height=1024 -spp=256 -threads=1024 -alloc_mode=3 -png=snowman.pngWith this setting, seff yields
OUTPUT
CPU Utilized: 00:26:45
CPU Efficiency: 99.07% of 00:27:00 core-walltime
Job Wall-clock time: 00:06:45
Memory Utilized: 113.29 MB
Memory Efficiency: 15.11% of 750.00 MB
As we can see, our job is actually getting slowed down from all the switching between threads. This means, that for our raytracer application CPU oversubscription is either pointless or actively harmful regarding performance.
Can you imagine a situation where CPU oversubscription might be sensible (perhaps also outside the HPC context)?
On HPC we often have a CPU bound application, i.e., the work done by the CPU is the limiting factor and thus dividing this work into smaller chunks does not help with performance.
However, there are also applications bound by other resources. For these applications it makes sense to assign the CPU core elsewhere while the process is waiting, e.g., on a storage medium.
Also, on many systems it is desirable to have more programs running than your computer has CPU cores since often only a few of them are active at the same time. One common example is your everyday computer with multiple programs running at the same time.
Multi-node jobs
So far, we have only used a single node for our job. The big advantage of MPI as a parallelism scheme is the fact that not all MPI tasks need to run on the same node. Let’s try this with our Snowman raytracer example:
BASH
#!/bin/bash
#SBATCH --nodes=2
#SBATCH --partition=<put your partition here>
#SBATCH --ntasks=4
#SBATCH --cpus-per-task=1
#SBATCH --mem=700M
#SBATCH --time=00:07:00
#SBATCH --output=snowman-stdout.log
#SBATCH --job-name=snowman

# Always a good idea to purge modules first to start with a clean module environment
module purge
# <put the module load commands for your cluster here>

mpirun -- ./SnowmanRaytracer/build/raytracer -width=1024 -height=1024 -spp=256 -threads=1 -alloc_mode=3 -png=snowman.png

echo -n "Total amount of memory used (in bytes): "
CGROUPPATH="$(cat /proc/self/cgroup | awk -F ':' '{print $3}')"
cat /sys/fs/cgroup/${CGROUPPATH}/memory.peak
The important change here compared to the MPI jobs before is the
--nodes=2 directive, which instructs Slurm to distribute
the 4 tasks across exactly two nodes.
Slurm accepts ranges
You can also leave the decision of how many nodes to use up to Slurm by specifying a minimum and a maximum number of nodes, e.g.,
--nodes=1-3would mean that Slurn can assign your job either one, two or three nodes.
Let’s look at the seff report of our job once again:
OUTPUT
[...]
Nodes: 2
Cores per node: 2
CPU Utilized: 00:21:32
CPU Efficiency: 98.78% of 00:21:48 core-walltime
Job Wall-clock time: 00:05:27
Memory Utilized: 280.80 MB
Memory Efficiency: 20.06% of 1.37 GB
We can see that Slurm did indeed split up the job such that each of the two nodes is running two tasks. We can also see that the walltime and CPU time of our job are basically the same as before. Considering the fact that communication between nodes is usually much slower than communication within a node, this result is surprising at first. However, we can find an explanation in the way our raytracer works. Most of the compute time is spent on tracing light rays through the scene for each pixel. Since these light rays are independent from one another, there is no need to communicate between the MPI tasks. Only at the very end, when the final image is assembled from the samples calculated by each task, there is some MPI communication happening. The overall communication overhead is therefore vanishingly small.
How well your program makes use of a larger number of nodes depends strongly on the amount of communication in your program.
We can also look at the memory consumption:
OUTPUT
[...]
Total amount of memory used (in bytes): 464834560
[...]
As we can see, there was indeed less memory consumed on the node running our submit script compared to before (470 MB vs 580 MB). However, our method of measuring peak memory consumption does not account for the second node. So let’s reach deeper into the toolbox to find out how much memory we actually use.
Tips for job submission
To end this lesson, we discuss some tips for choosing resource allocations such that your jobs get scheduled more quickly.
- Many clusters have activated the so-called backfill scheduler option in Slurm. This mechanism tries to squeeze low priority jobs in the gaps between jobs of higher priority (as long as the larger jobs are not delayed by this). In this case, smaller jobs are generally advantageous as they can “skip ahead” in the queue and start early.
- Using
sinfo -t idleyou can specifically search for partitions that have idle nodes. Consider using these partitions for your job if possible as an idle node will typically start your job immediately. - Different partitions might have different billing weights,
i.e., they might use different factors to determine the “cost” of your
calculation, which is subtracted from your compute budget or fairshare
score. You can check these weights using
scontrol show partition <partitionname> | grep TRESBillingWeights. The idea behind different billing weights is to even out the cost of the different resources (i.e., how many hours of memory use correspond to one hour of CPU use) and to ensure that using more expensive hardware carries an appropriate cost for the users. - Typically, it takes longer for a large slot to free up than it takes for several small slots to open. Splitting your job across multiple nodes might not be the most computationally efficient way to run it due to the possible communication overhead, but it can be more efficient in terms of scheduling.
- Slurm produces an estimate on when your job will be started which
you can check with
scontrol show job 35749406 | grep StartTime.
- Your cluster might seem to have an enormous amout of computing resources, but these resources are a shared good. You should only use as much as you need.
- Resource requests are a promise to the scheduler to not use more
than a specific amount of resources. If you break your promise to the
scheduler and try to use more resources, terrible things will happen.
- Overstepping memory or time allocations will result in your job being terminated.
- Oversubscribing CPU cores will at best do nothing and at worst diminish performance.
- Finding the minimal resource requirements takes a bit of trial and error. Slurm collects a lot of useful metrics to aid you in this.