
Introducing LLMs as a Tool to Learn R
Last updated on 2026-08-27 | Edit this page
Estimated time: 25 minutes
Overview
Questions
- What do I want to learn?
- What AI chatbots are available to me?
- How do I get started with R?
Objectives
- Identify your learning goals
- Choose an AI chatbot
- Understand the basics of R
- Use R to load data
Generative AI As A Learning Tool
Generative models and agents, including LLMs, can be used to automate a wide variety of tasks, at work and in our lives. But automating a task while we are still learning how to do it can limit our learning and our ability to build up more complex and creative skill sets.
We can use AI tools to positively support our learning journey instead. In this class we will explore and practice some ways that we can use Large Language Models to inform, challenge and support us as we learn how to write software code to analyse research data.
Choosing An AI Partner
There are many popular AI models available online, including:
In addition, institutions might run their own, local copies of models like such as DeepSeek or Mistral:
Challenge : What Tools Do We Have
Do you know what Generative AI tools are available and supported in your environment?
Discuss with each other and with your instructor:
- What AI tools have you heard of?
- Which are most often used in your institution/s?
- Are there any special policies that affect your choice?
- Can you access your tool of choice right now?
Consult with your instructor on which LLMs are appropriate to use today and open a session.
Getting Started with R
Why learn R?
We’ll use R in this lesson to practice running code and asking an AI chatbot for help. While we don’t aim to provide a comprehensive introduction to R, there are several reasons why R is a good choice:
- R does not involve lots of pointing and clicking, and that’s a good thing
- R code is great for reproducibility
- R is interdisciplinary and extensible
- R works on data of all shapes and sizes
- R produces high-quality graphics
- R has a large and welcoming community
This list and significant amounts of the content below have been adapted from Data Analysis and Visualisation in R by Southampton Research Software Group licensed CC BY 4.0. For more information, check out the original lesson as well as Data Analysis and Visualization in R for Ecologists and R for Reproducible Scientific Analysis.
What is R? What is RStudio?
The term “R” is used to refer to both the programming
language and the software that interprets the scripts written using
it.
RStudio is a very popular way to not only write R scripts but also to interact with the R software. To function correctly, RStudio needs R and therefore both need to be installed on your computer.
Knowing your way around RStudio
Let’s start by learning about RStudio, which is an open-source Integrated Development Environment (IDE) for working with R.
We will use RStudio IDE to write code, navigate the files on our computer, inspect the variables we are going to create, and visualize the plots we will generate.
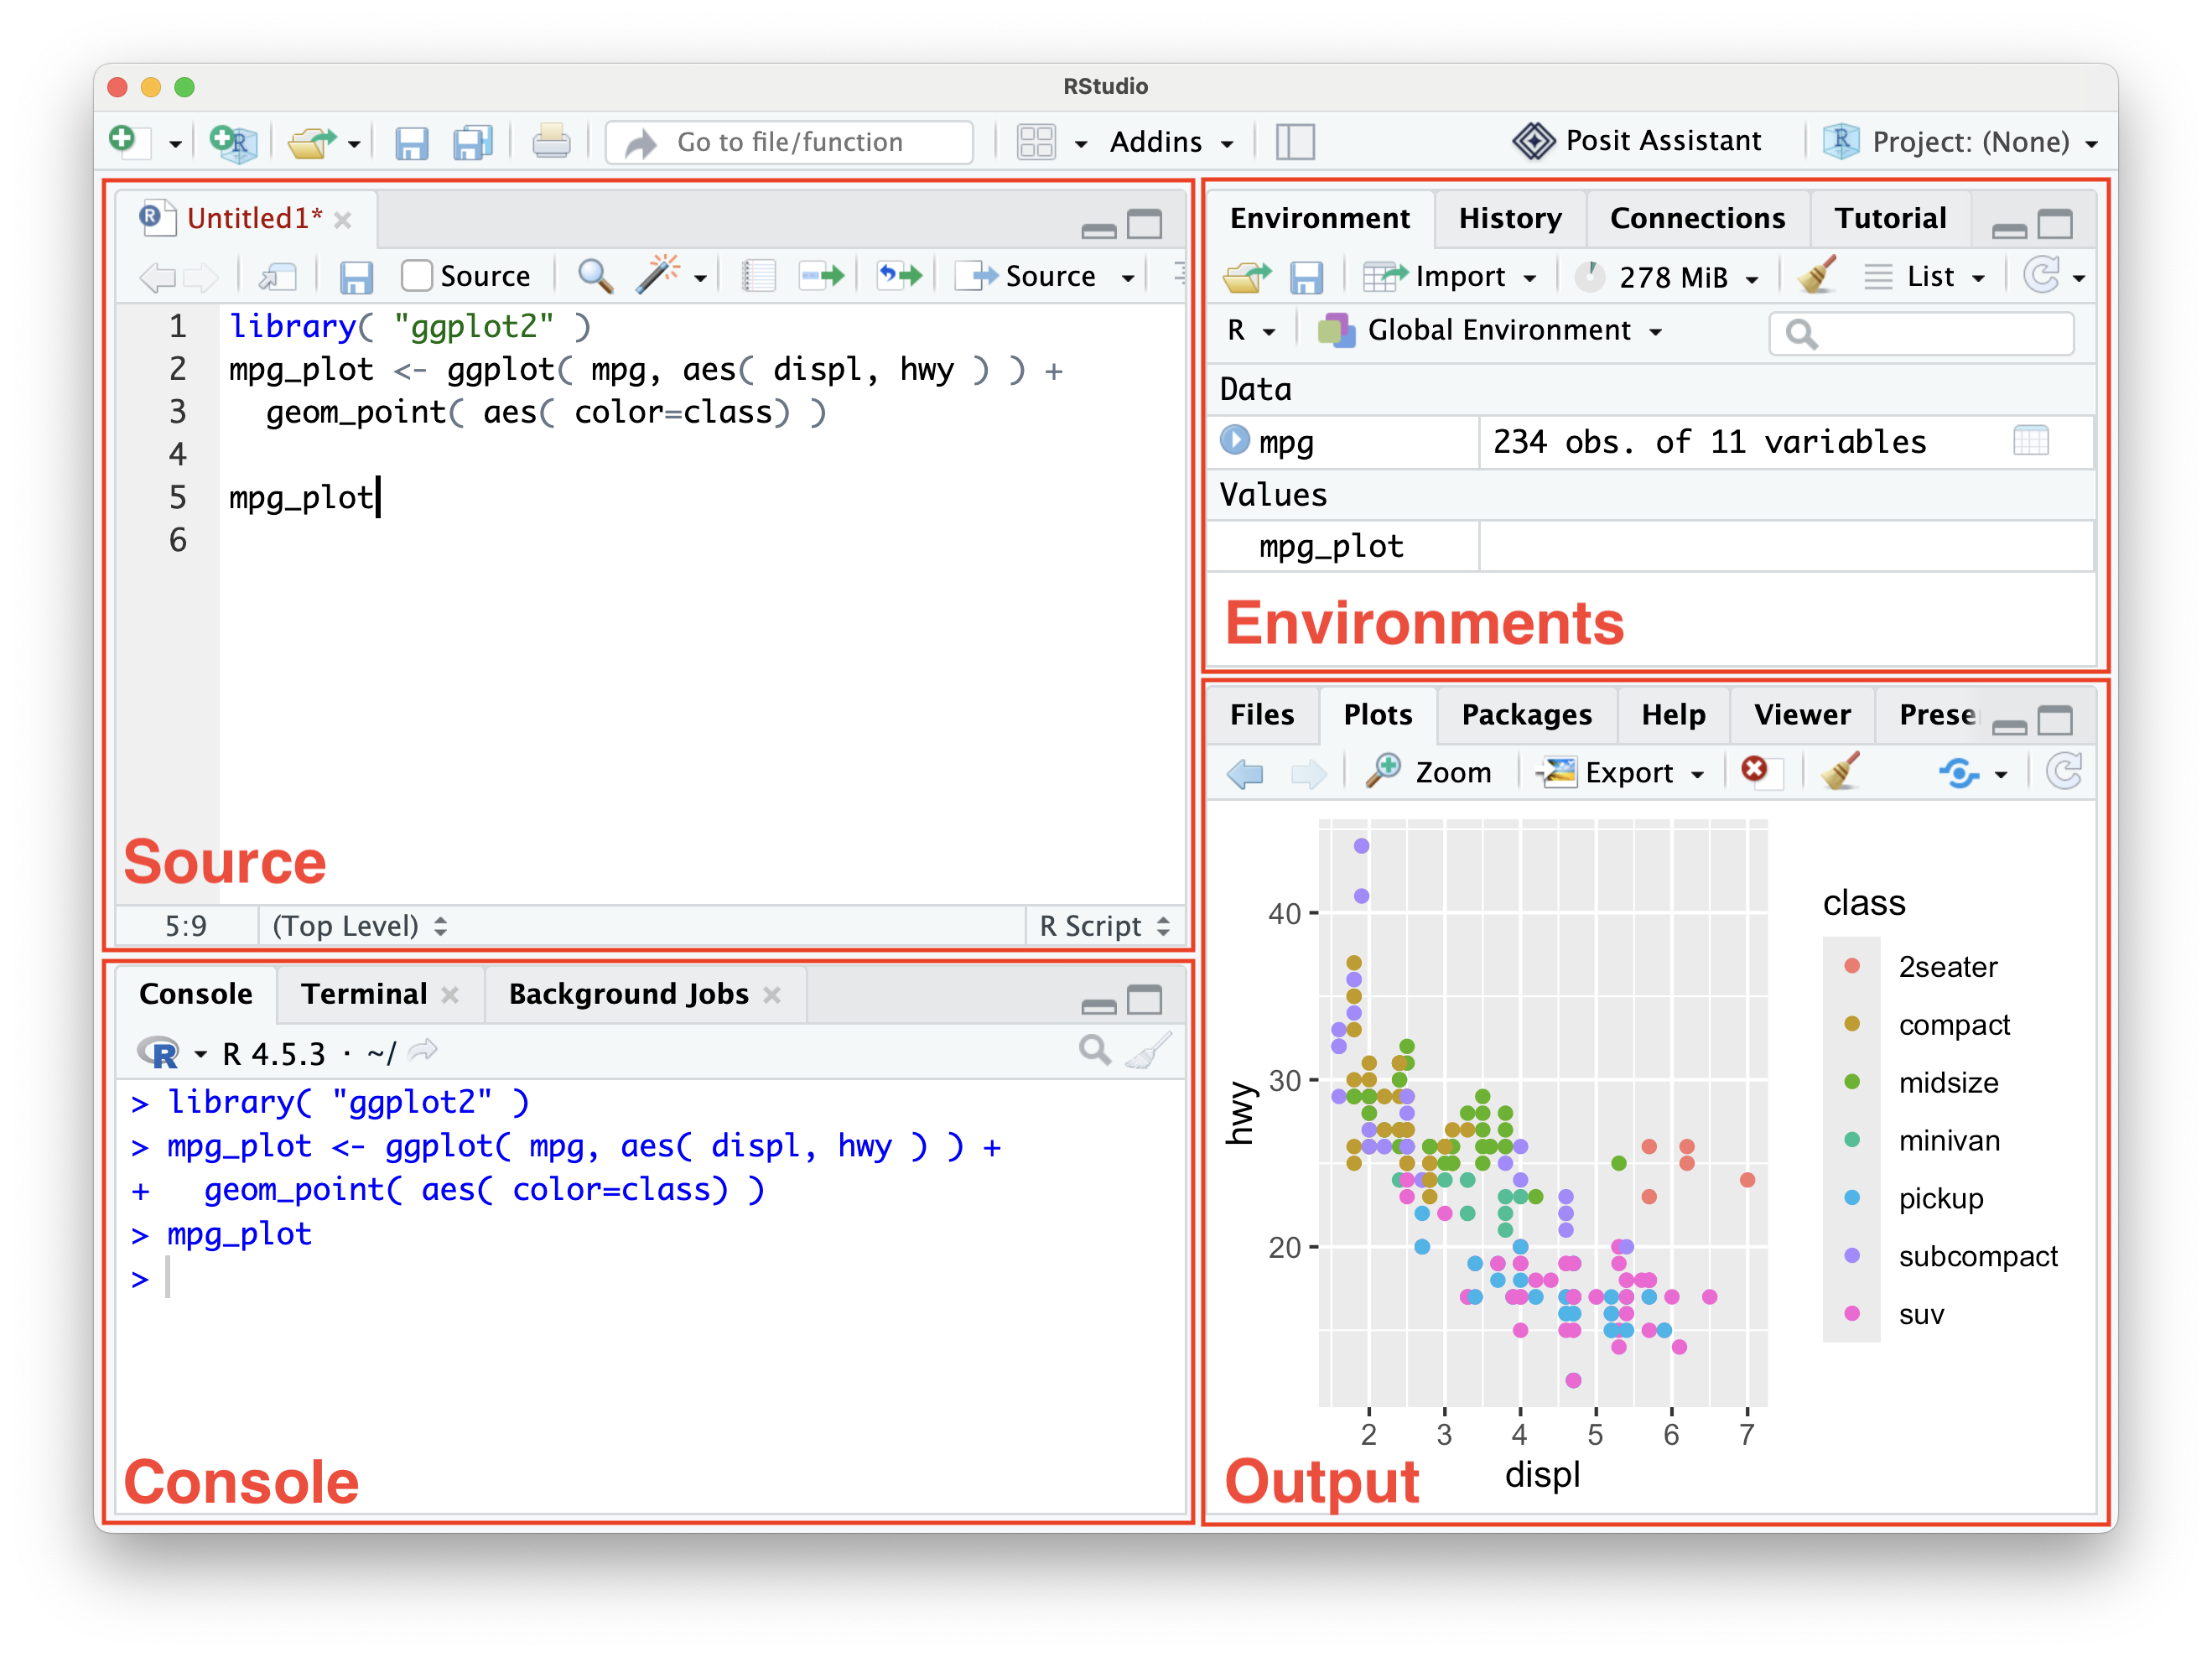
RStudio is divided into 4 “Panes”: the Source for your documents containing code (aka “scripts”; top-left, in the default layout), your Environment/History (top-right) which shows all the objects in your working space (Environment) and your command history (History), your Files/Plots/Packages/Help/Viewer (bottom-right), and the R Console (bottom-left). The placement of these panes and their content can be customized (see menu, Tools -> Global Options -> Pane Layout).
R Basics
Running commands
You can get output from R by typing math in the console:
R
3 + 5
OUTPUT
[1] 8R
12 / 7
OUTPUT
[1] 1.714286Assigning values to objects
However, to do useful and interesting things, we need to assign values to objects and name them through variables.
A value is a piece of information that we want to store and retrieve at some later time, i.e. a number, a sequence of numbers, or even collections of data, for now we will start with numbers and later move onto collections of numbers which in R are called vectors.
An object is programming speak for a thing with known properties. You can think of an object as a box with a label, holding the value inside.
A variable is a name that refers to an object. You can use
any name such as x, current_temperature, or
subject_id but we recommend keeping object names explicit
and not too long.
To create an object, we need to give it a name followed by the
assignment operator <-, and the value we want to give
it:
R
weight_kg <- 55
<- is the assignment operator. It assigns values on
the right to objects on the left. So, after executing
weight_kg <- 55, the value of weight_kg is
55. The arrow can be read as 55 goes into
weight_kg.
What is my object?
Once an object is created there are two ways we can get information about that object:
Environment tab – In the Environment tab in the top right of RStudio, ‘weight_kg’ has the type numeric length 1 and value 55. Make sure to keep an eye on the other values that appear here when using RStudio to understand what objects you have. This tab is great for small variables, when inspecting larger or more complicated objects it is better to use more advanced methods we will cover later on.
Print command – When assigning a value to an object, R does not print anything. You can force R to print the value by using parentheses or by typing the object name:
R
weight_kg <- 55    # doesn't print anything
(weight_kg <- 55)  # but putting parenthesis around the call prints the value of `weight_kg`
weight_kg          # and so does typing the name of the object
Load Data
Gapminder provides data to help people better understand global macrotrends. We’ll use a subset from the gapminder package that contains six variables:
| Column | Description |
|---|---|
| country | |
| year | |
| pop | total population |
| continent | |
| lifeExp | life expectancy at birth |
| gdpPercap | per-capita GDP |
We are going to use the R function download.file() to
download the CSV file that contains the gapminder data. Lets investigate
the download.file() function.
In the R console type help( download.file ) and then
look at the help view that will open on the bottom right. We can see a
description and a list of arguments. We need the first two,
url and destfile.
- url: A character string giving a source URL for the data we use “https://swcarpentry.github.io/r-novice-gapminder/data/gapminder_data.csv”.
- destfile: A character string (or vector) denoting the destination and name for the downloaded data we use “gapminder_data.csv”.
R
download.file(url = "https://swcarpentry.github.io/r-novice-gapminder/data/gapminder_data.csv",
              destfile = "gapminder_data.csv")
You are now ready to load the data! We use read.csv() to
load the content of the CSV file as an object of class
data.frame, we can again use help( read.csv )
to learn about the arguments. This time we just need the first argument
file which we give the location of the file
i.e. destfile from before.
R
gapminder <- read.csv( "gapminder_data.csv" )
This statement doesn’t produce any output because, as you might recall, assignments don’t display anything. If we want to check that our data has been loaded, we can check the environment pane in RStudio.
To check the top (the first 6 lines) of this data frame we use the
function head():
R
head( gapminder )
OUTPUT
      country year      pop continent lifeExp gdpPercap
1 Afghanistan 1952  8425333      Asia  28.801  779.4453
2 Afghanistan 1957  9240934      Asia  30.332  820.8530
3 Afghanistan 1962 10267083      Asia  31.997  853.1007
4 Afghanistan 1967 11537966      Asia  34.020  836.1971
5 Afghanistan 1972 13079460      Asia  36.088  739.9811
6 Afghanistan 1977 14880372      Asia  38.438  786.1134
Quickly explore the dataset using the summary()
function:
R
summary( gapminder )
OUTPUT
   country               year           pop             continent
 Length:1704        Min.   :1952   Min.   :6.001e+04   Length:1704
 Class :character   1st Qu.:1966   1st Qu.:2.794e+06   Class :character
 Mode  :character   Median :1980   Median :7.024e+06   Mode  :character
                    Mean   :1980   Mean   :2.960e+07
                    3rd Qu.:1993   3rd Qu.:1.959e+07
                    Max.   :2007   Max.   :1.319e+09
    lifeExp        gdpPercap
 Min.   :23.60   Min.   :   241.2
 1st Qu.:48.20   1st Qu.:  1202.1
 Median :60.71   Median :  3531.8
 Mean   :59.47   Mean   :  7215.3
 3rd Qu.:70.85   3rd Qu.:  9325.5
Max. :82.60 Max. :113523.1 - Choosing which and when to use Generative AI tools require thoughtful goal-setting
- R and RStudio provide a reasonable entry point with a large and welcoming community
- The Gapminder dataset contains global metrics for data analysis