All Images
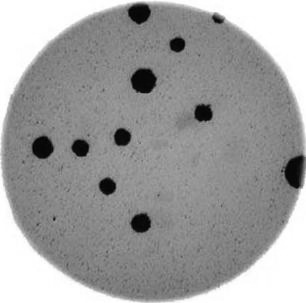
Image 1 of 1: ‘Bacteria colony’
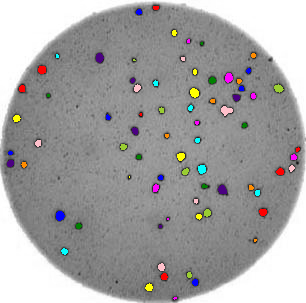
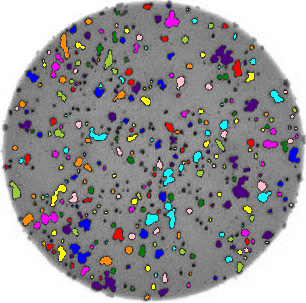
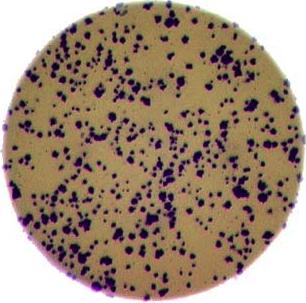
Image 1 of 1: ‘Colonies counted’
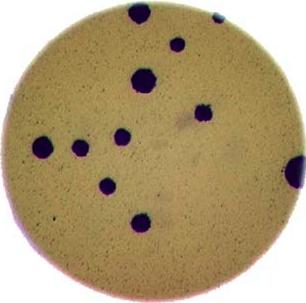
Image 1 of 1: ‘Bacteria colony’
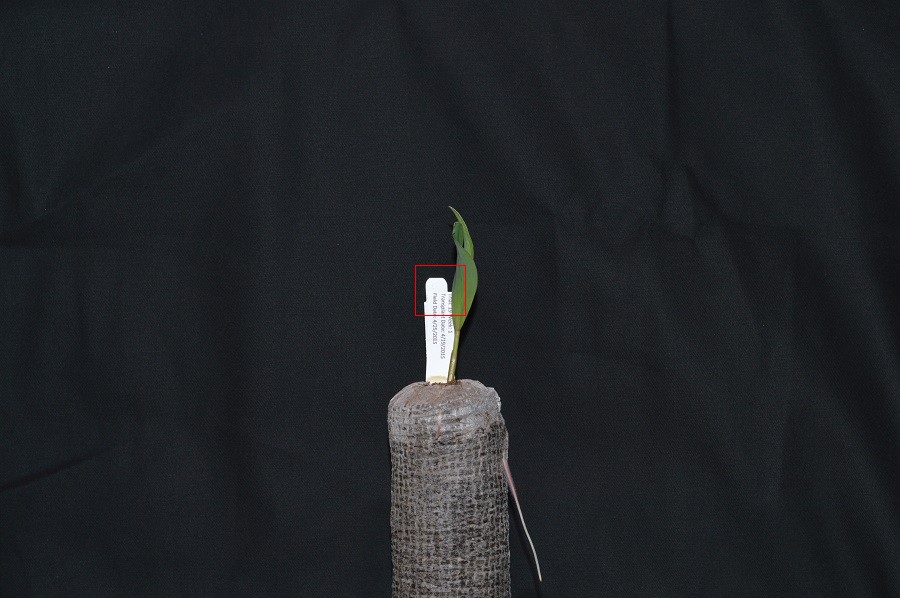
Image 1 of 1: ‘Original size image’
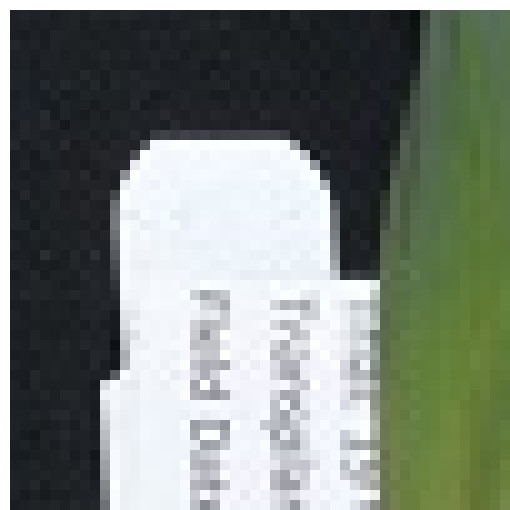
Image 1 of 1: ‘Enlarged image area’
Image 1 of 1: ‘Image of 8’
Image 1 of 1: ‘Image of 0’
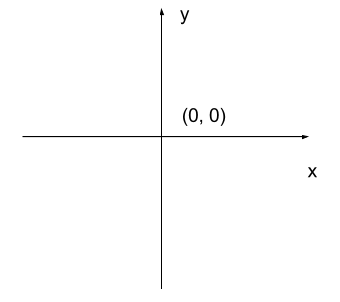
Image 1 of 1: ‘Cartesian coordinate system’
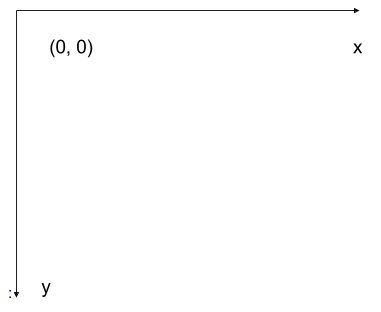
Image 1 of 1: ‘Image coordinate system’
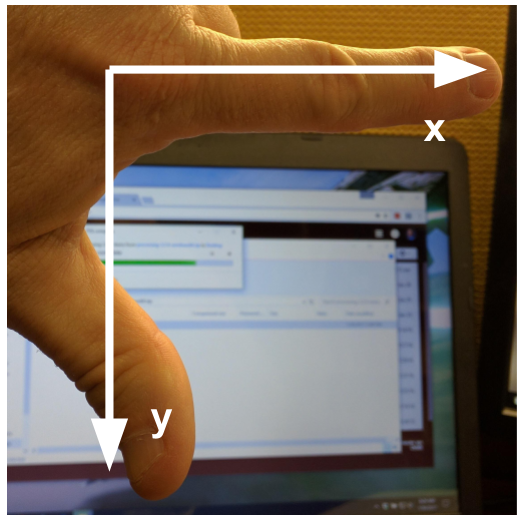
left-hand coordinate system . If you hold your
left hand in front of your face and point your thumb at the floor, your
extended index finger will correspond to the x-axis while your thumb
represents the y-axis.
Image 1 of 1: ‘Left-hand coordinate system’
Image 1 of 1: ‘Image of 5’
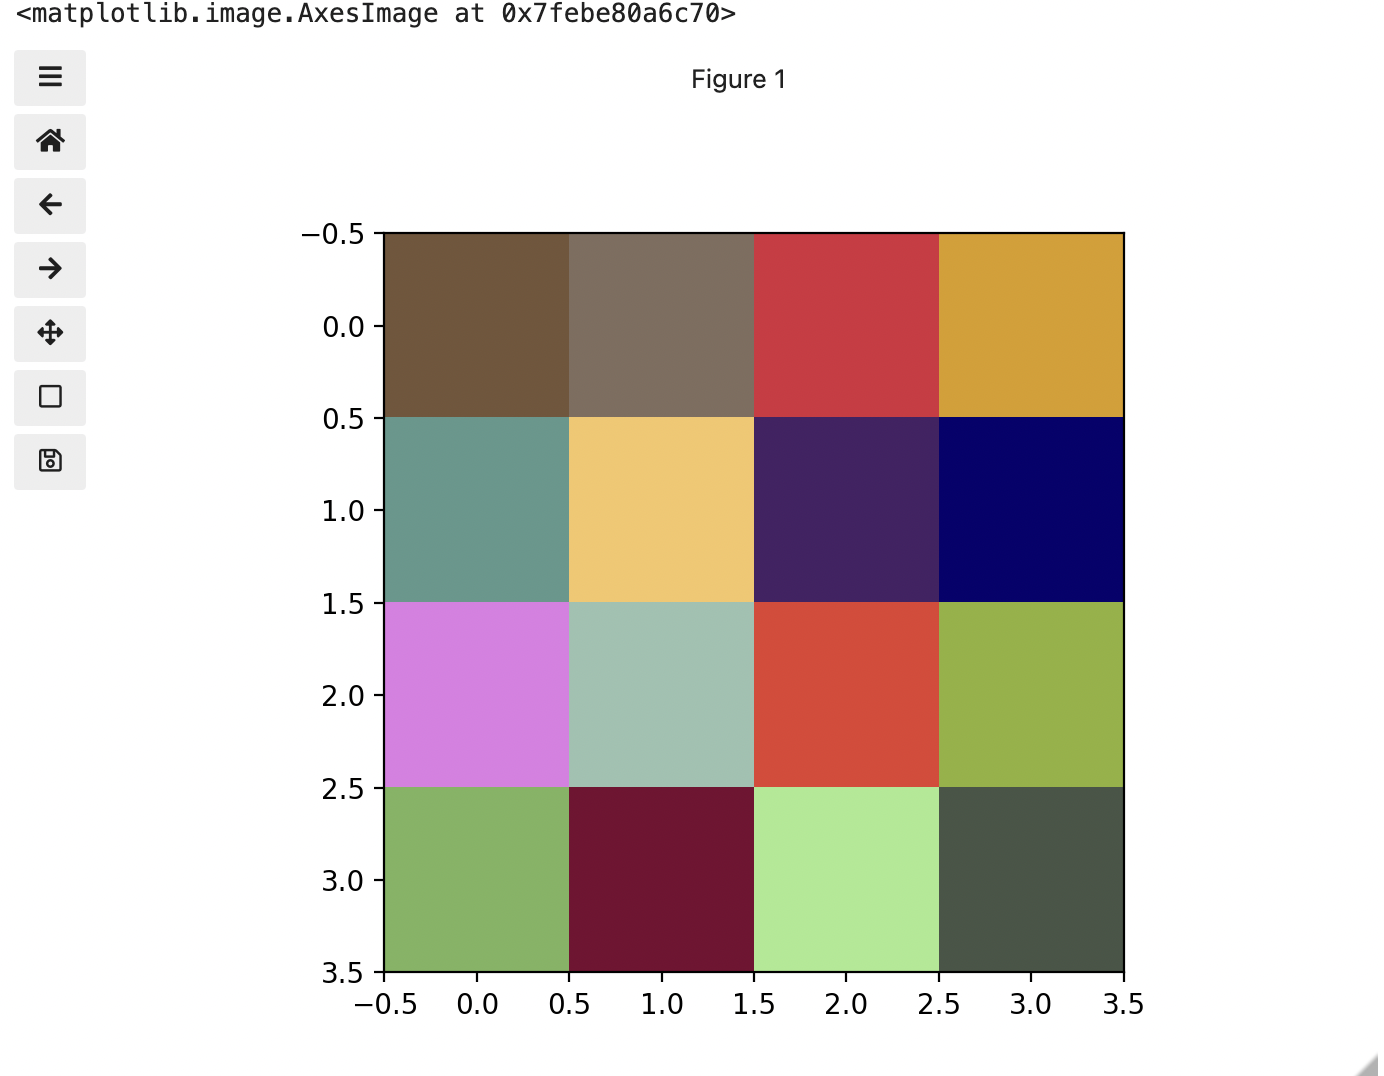
Image 1 of 1: ‘Image of three colours’
Image 1 of 1: ‘Image in greyscale’
Image 1 of 1: ‘Image of checkerboard’
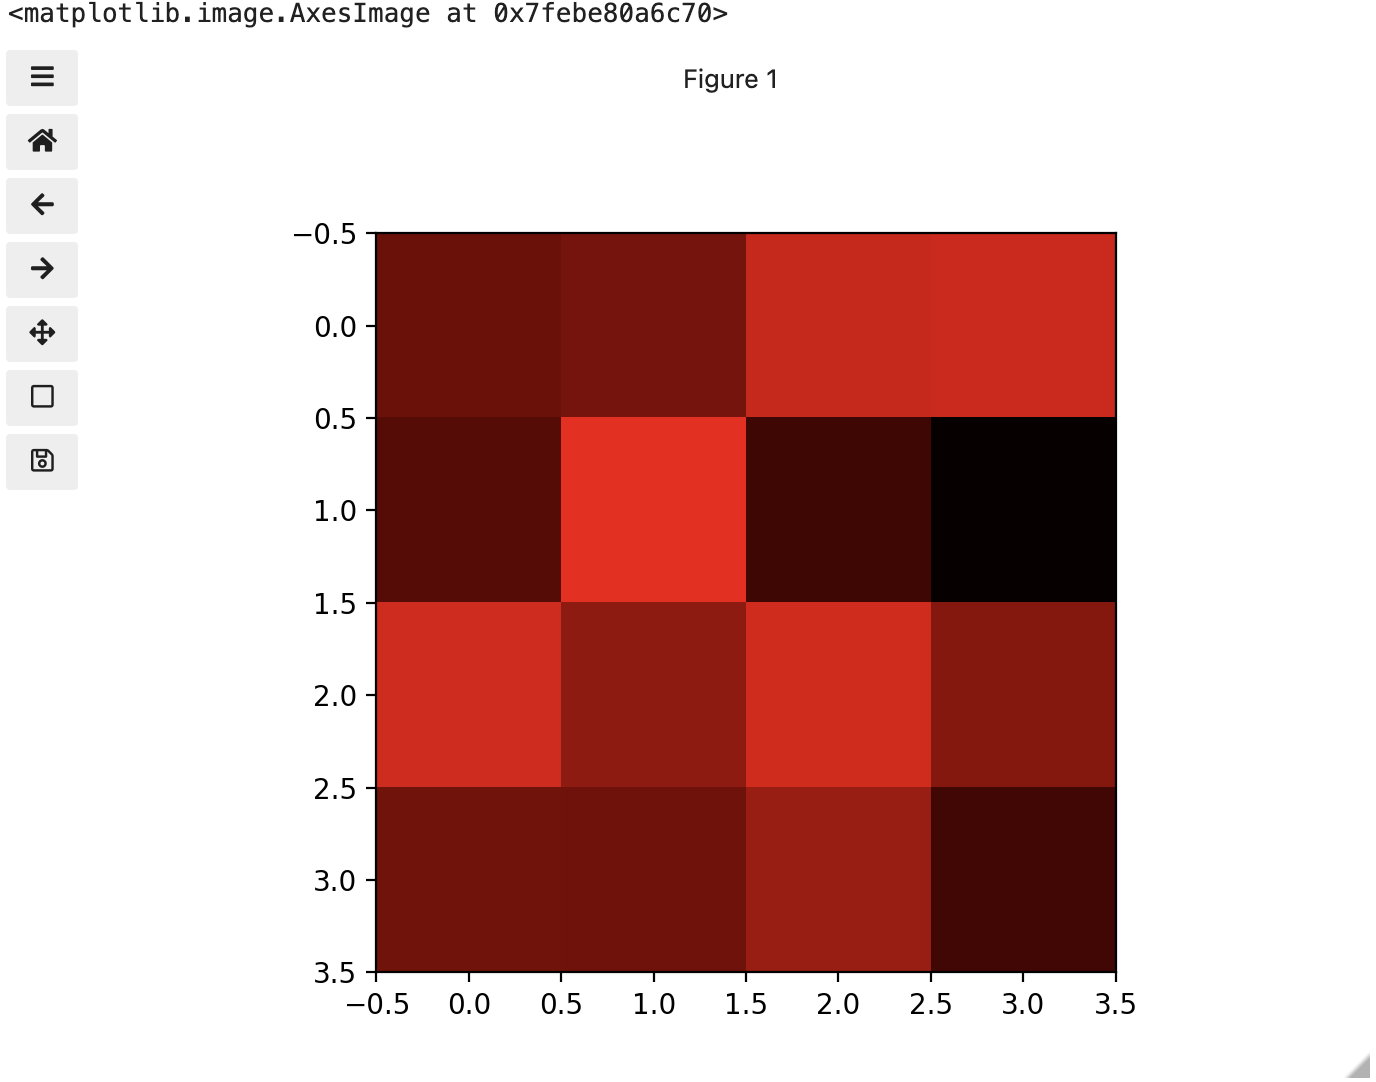
Image 1 of 1: ‘Image of red channel’
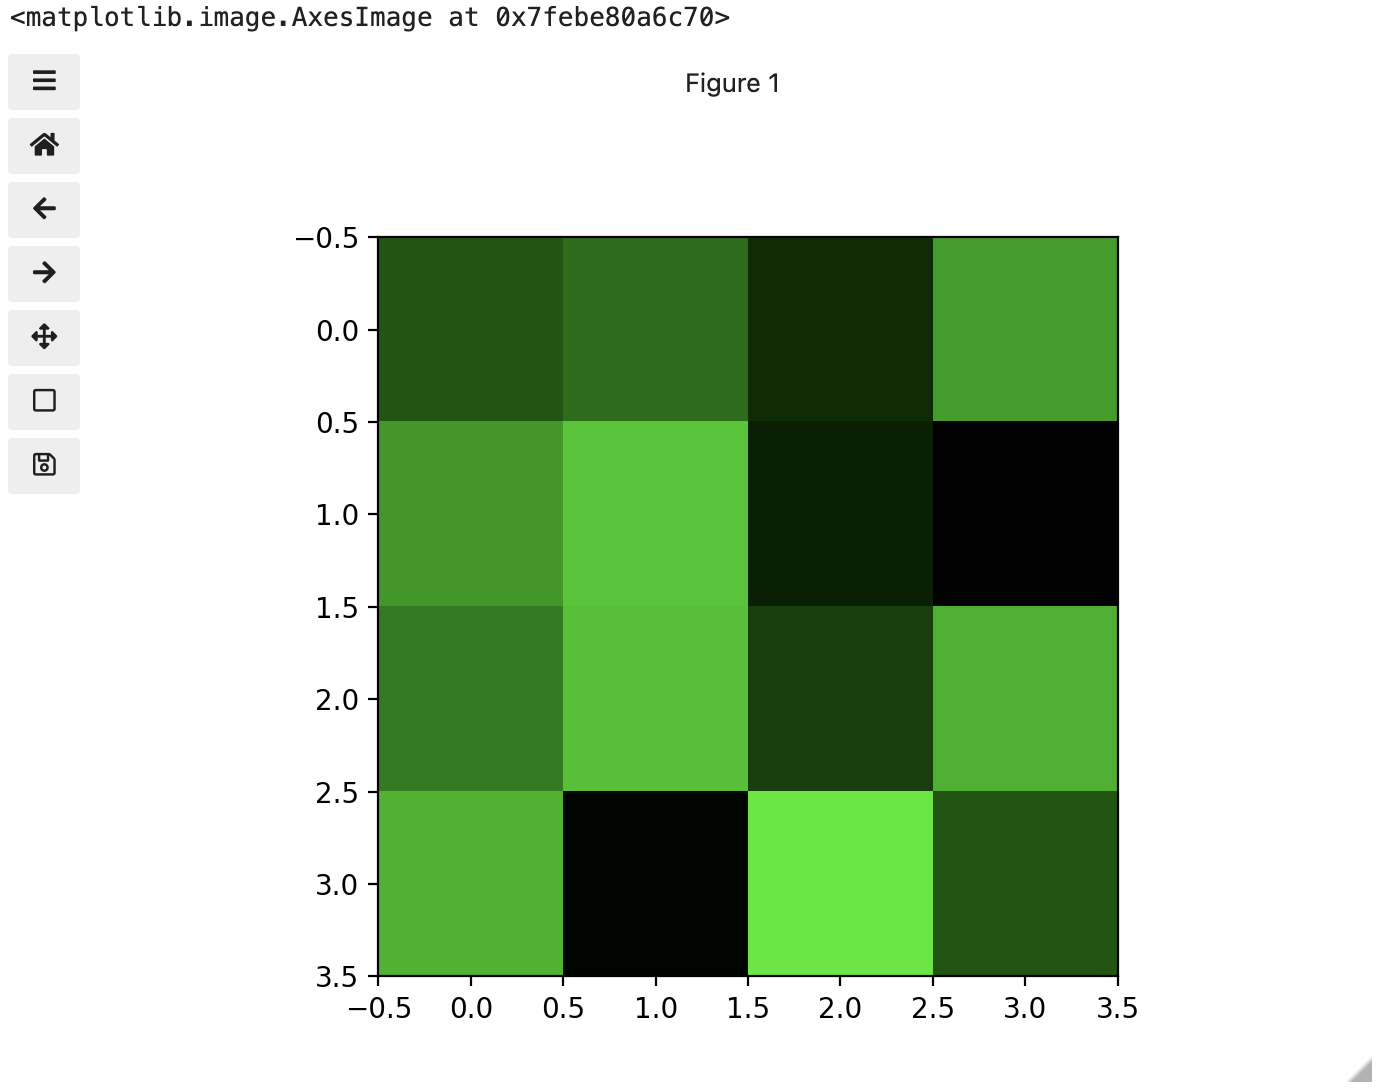
Image 1 of 1: ‘Image of green channel’
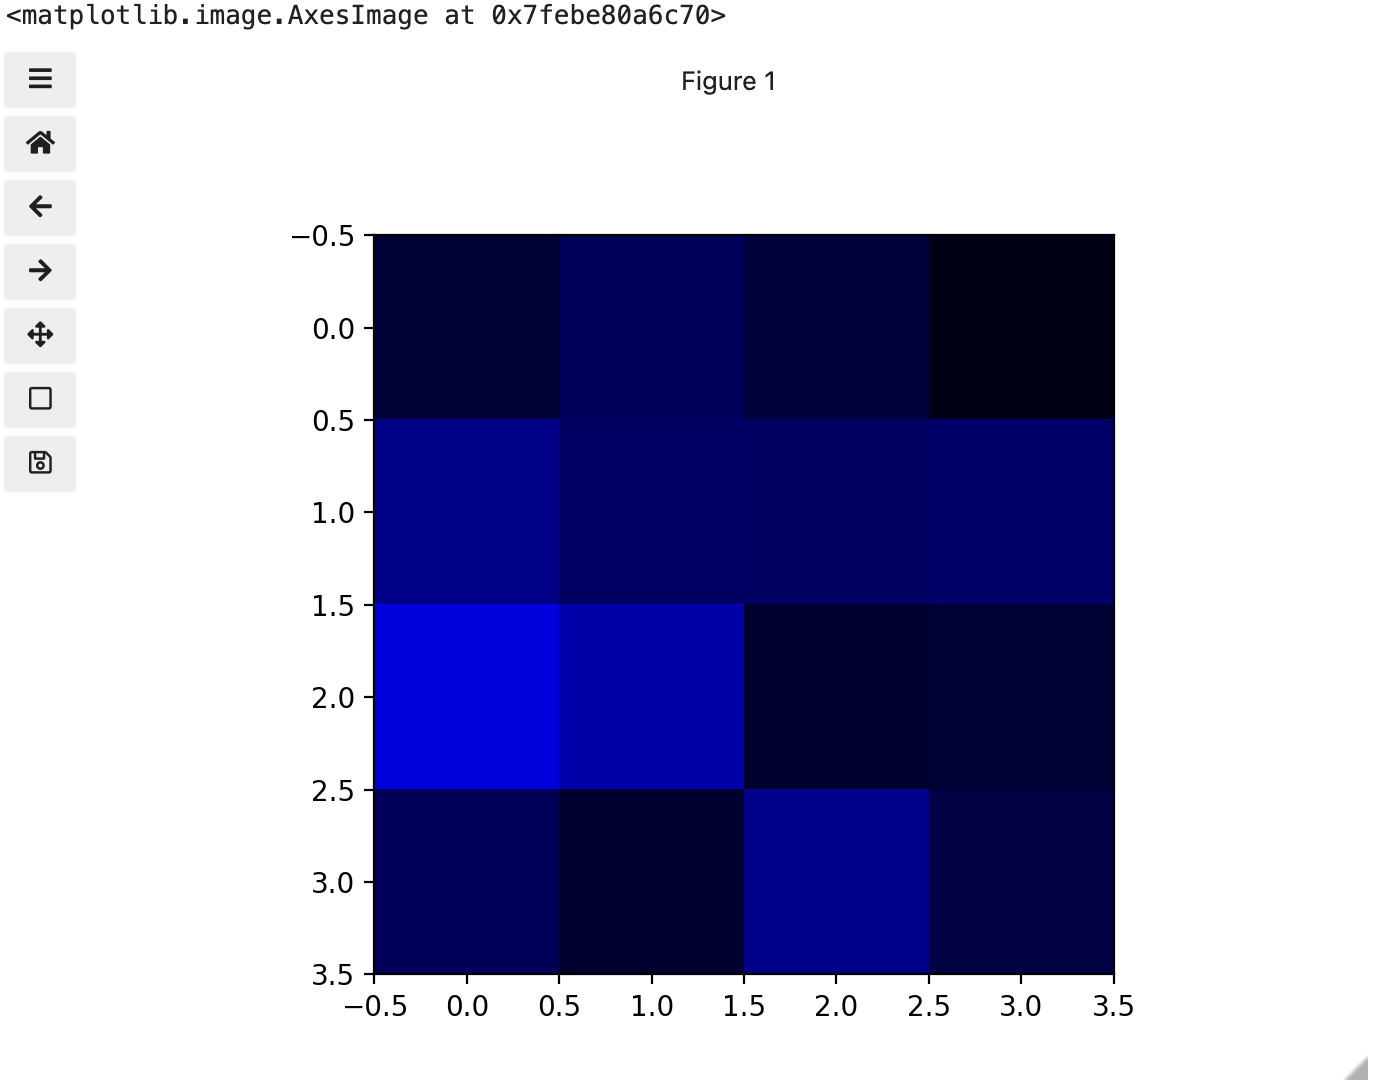
Image 1 of 1: ‘Image of blue channel’
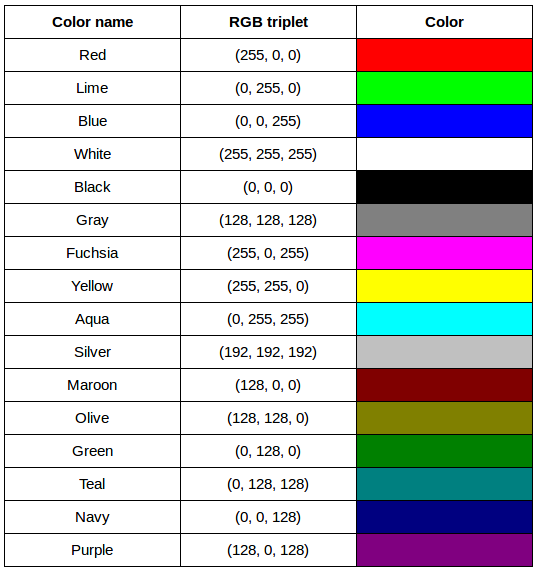
Image 1 of 1: ‘RGB colour table’
Image 1 of 1: ‘Original image’
Image 1 of 1: ‘Enlarged, uncompressed’
Image 1 of 1: ‘Enlarged, compressed’
Image 1 of 1: ‘Uncompressed histogram’
Image 1 of 1: ‘Root cluster image’
Image 1 of 1: ‘Thresholded root image’
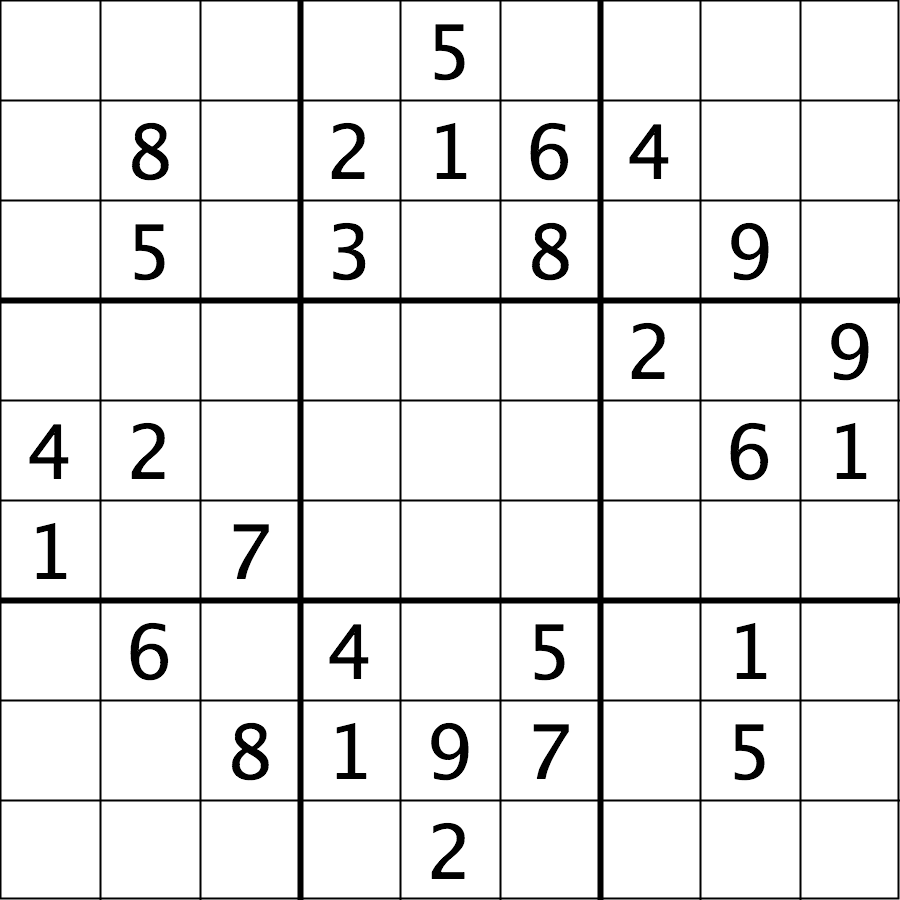
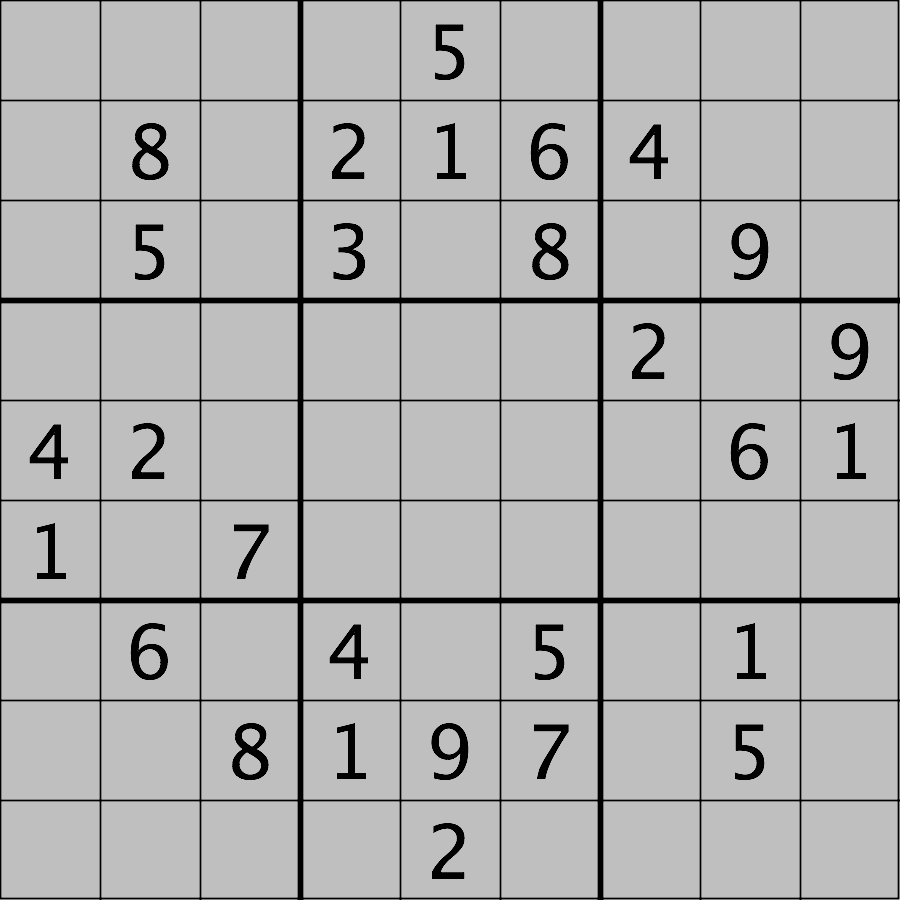
Image 1 of 1: ‘Su-Do-Ku puzzle’
Image 1 of 1: ‘Modified Su-Do-Ku puzzle’
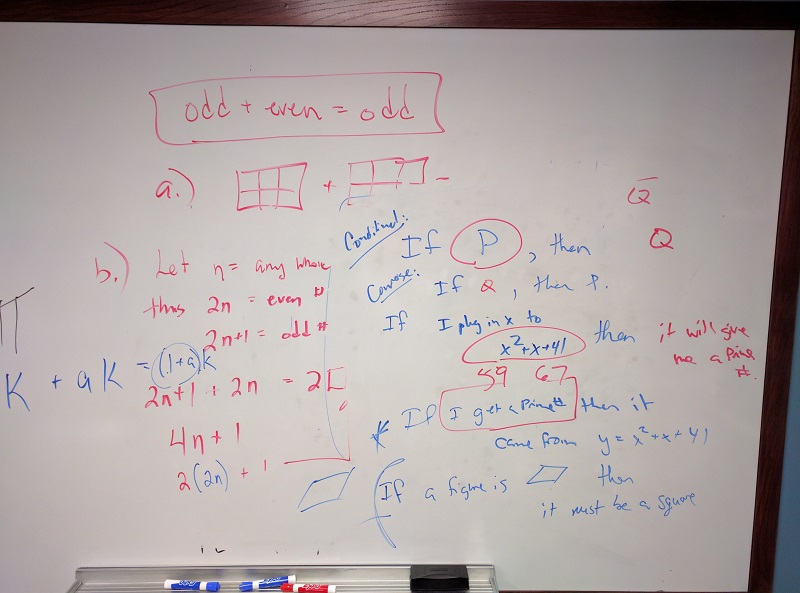
Image 1 of 1: ‘Whiteboard image’
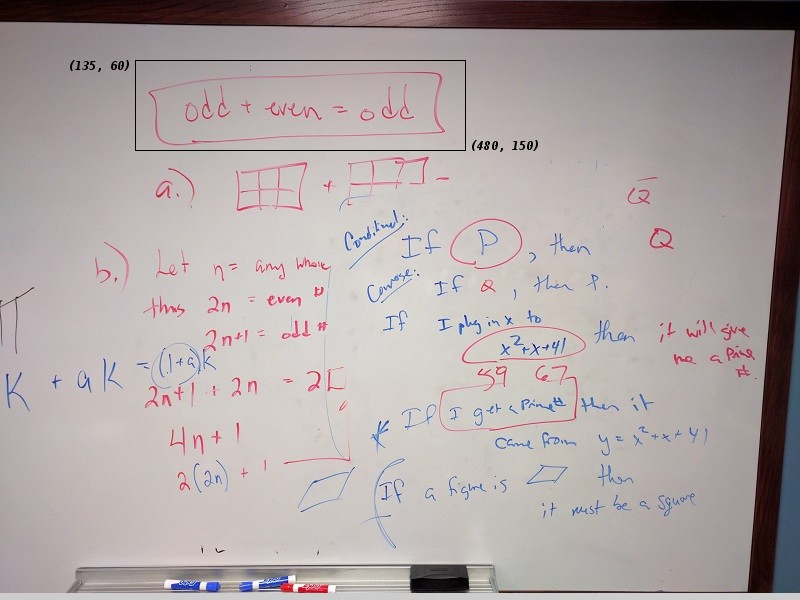
Image 1 of 1: ‘Whiteboard coordinates’
Image 1 of 1: ‘"Erased" whiteboard’
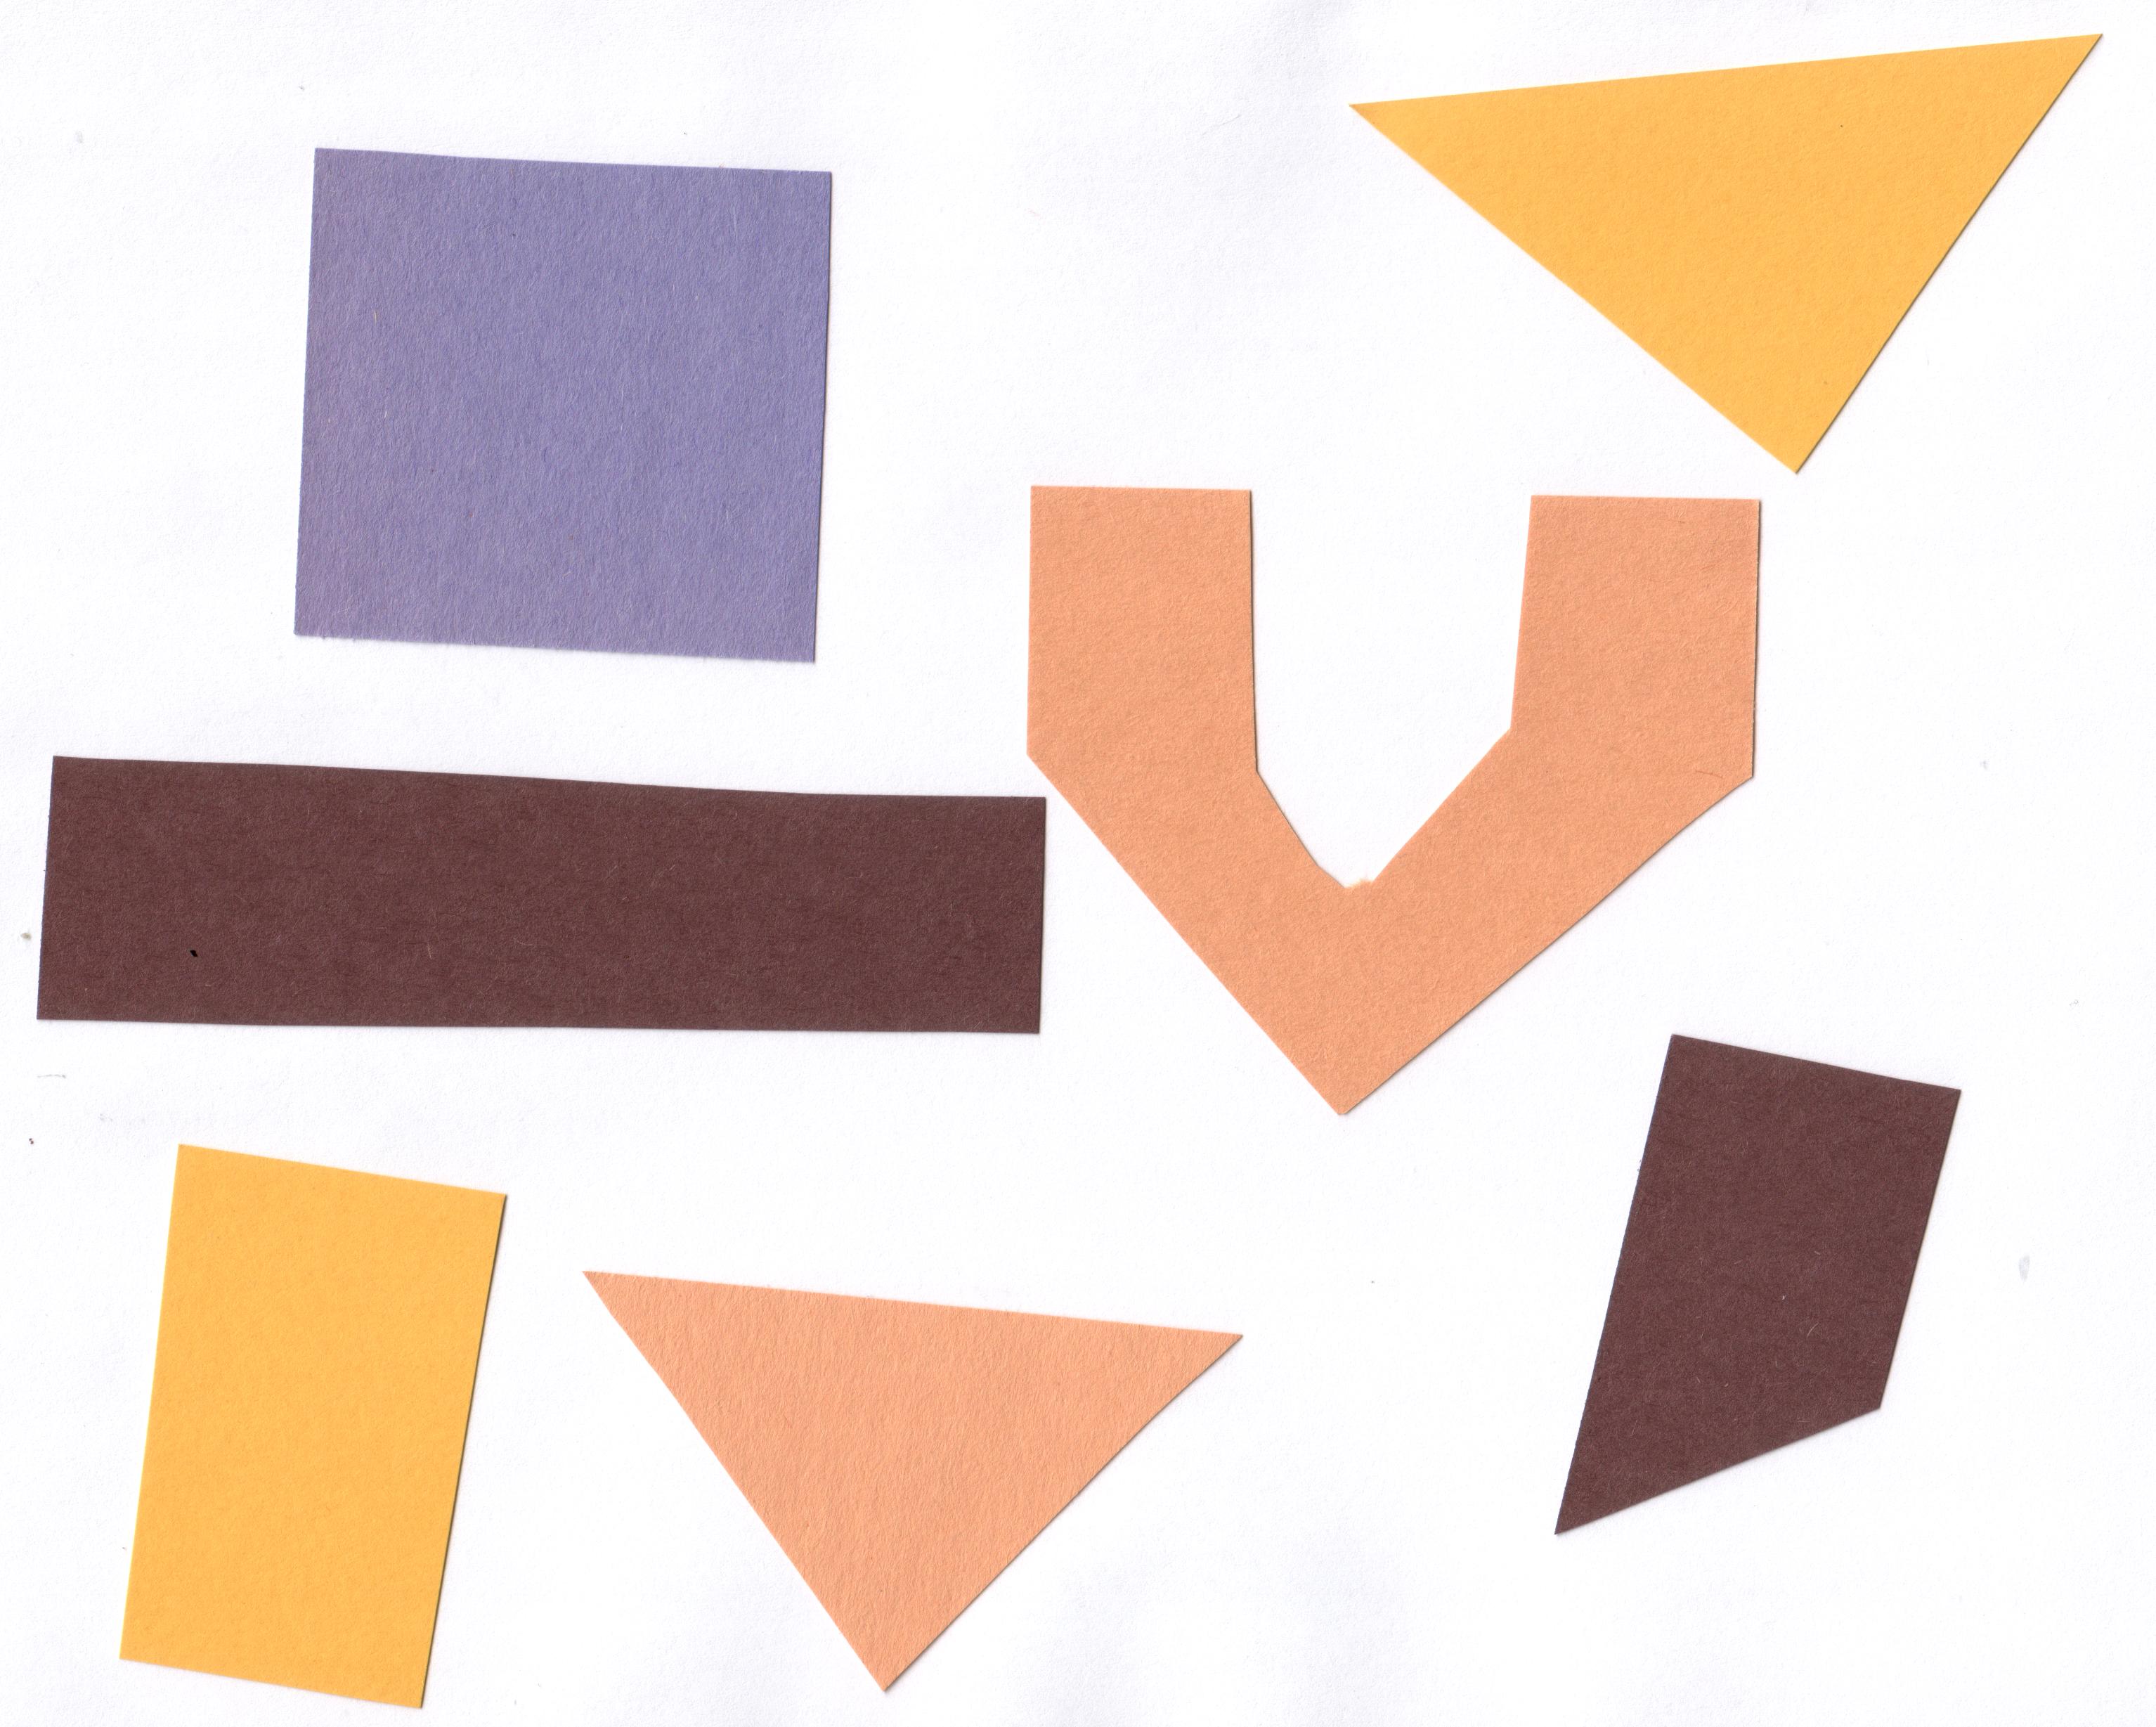
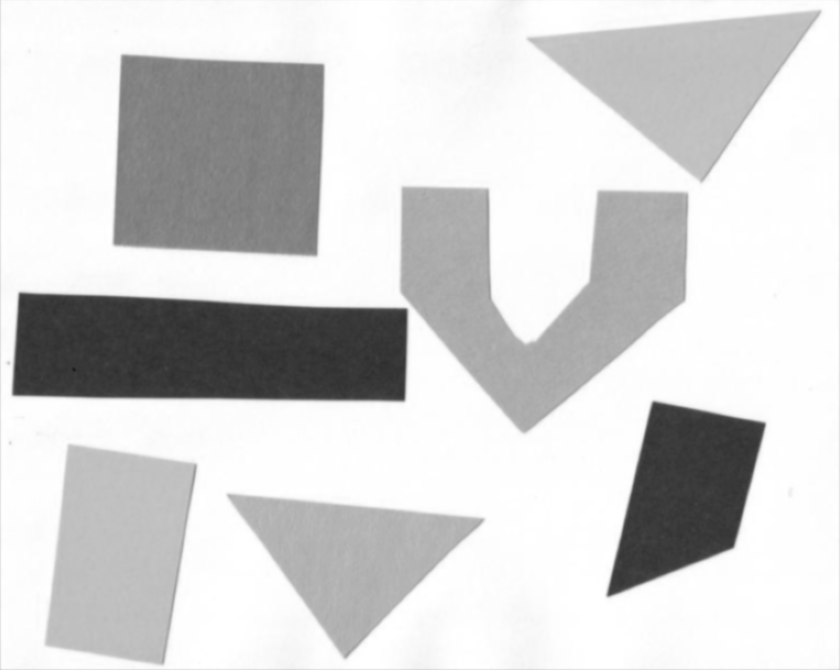
Image 1 of 1: ‘Image with geometric shapes on white background’
Image 1 of 1: ‘Grayscale image of the geometric shapes’
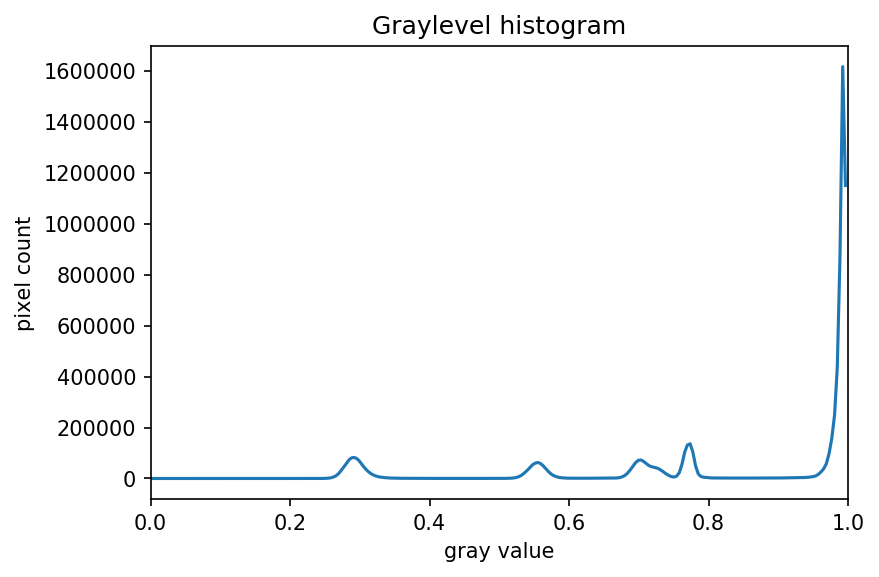
Image 1 of 1: ‘Grayscale histogram of the geometric shapes image’
Image 1 of 1: ‘Binary mask of the geometric shapes created by thresholding’
Image 1 of 1: ‘Selected shapes after applying binary mask’
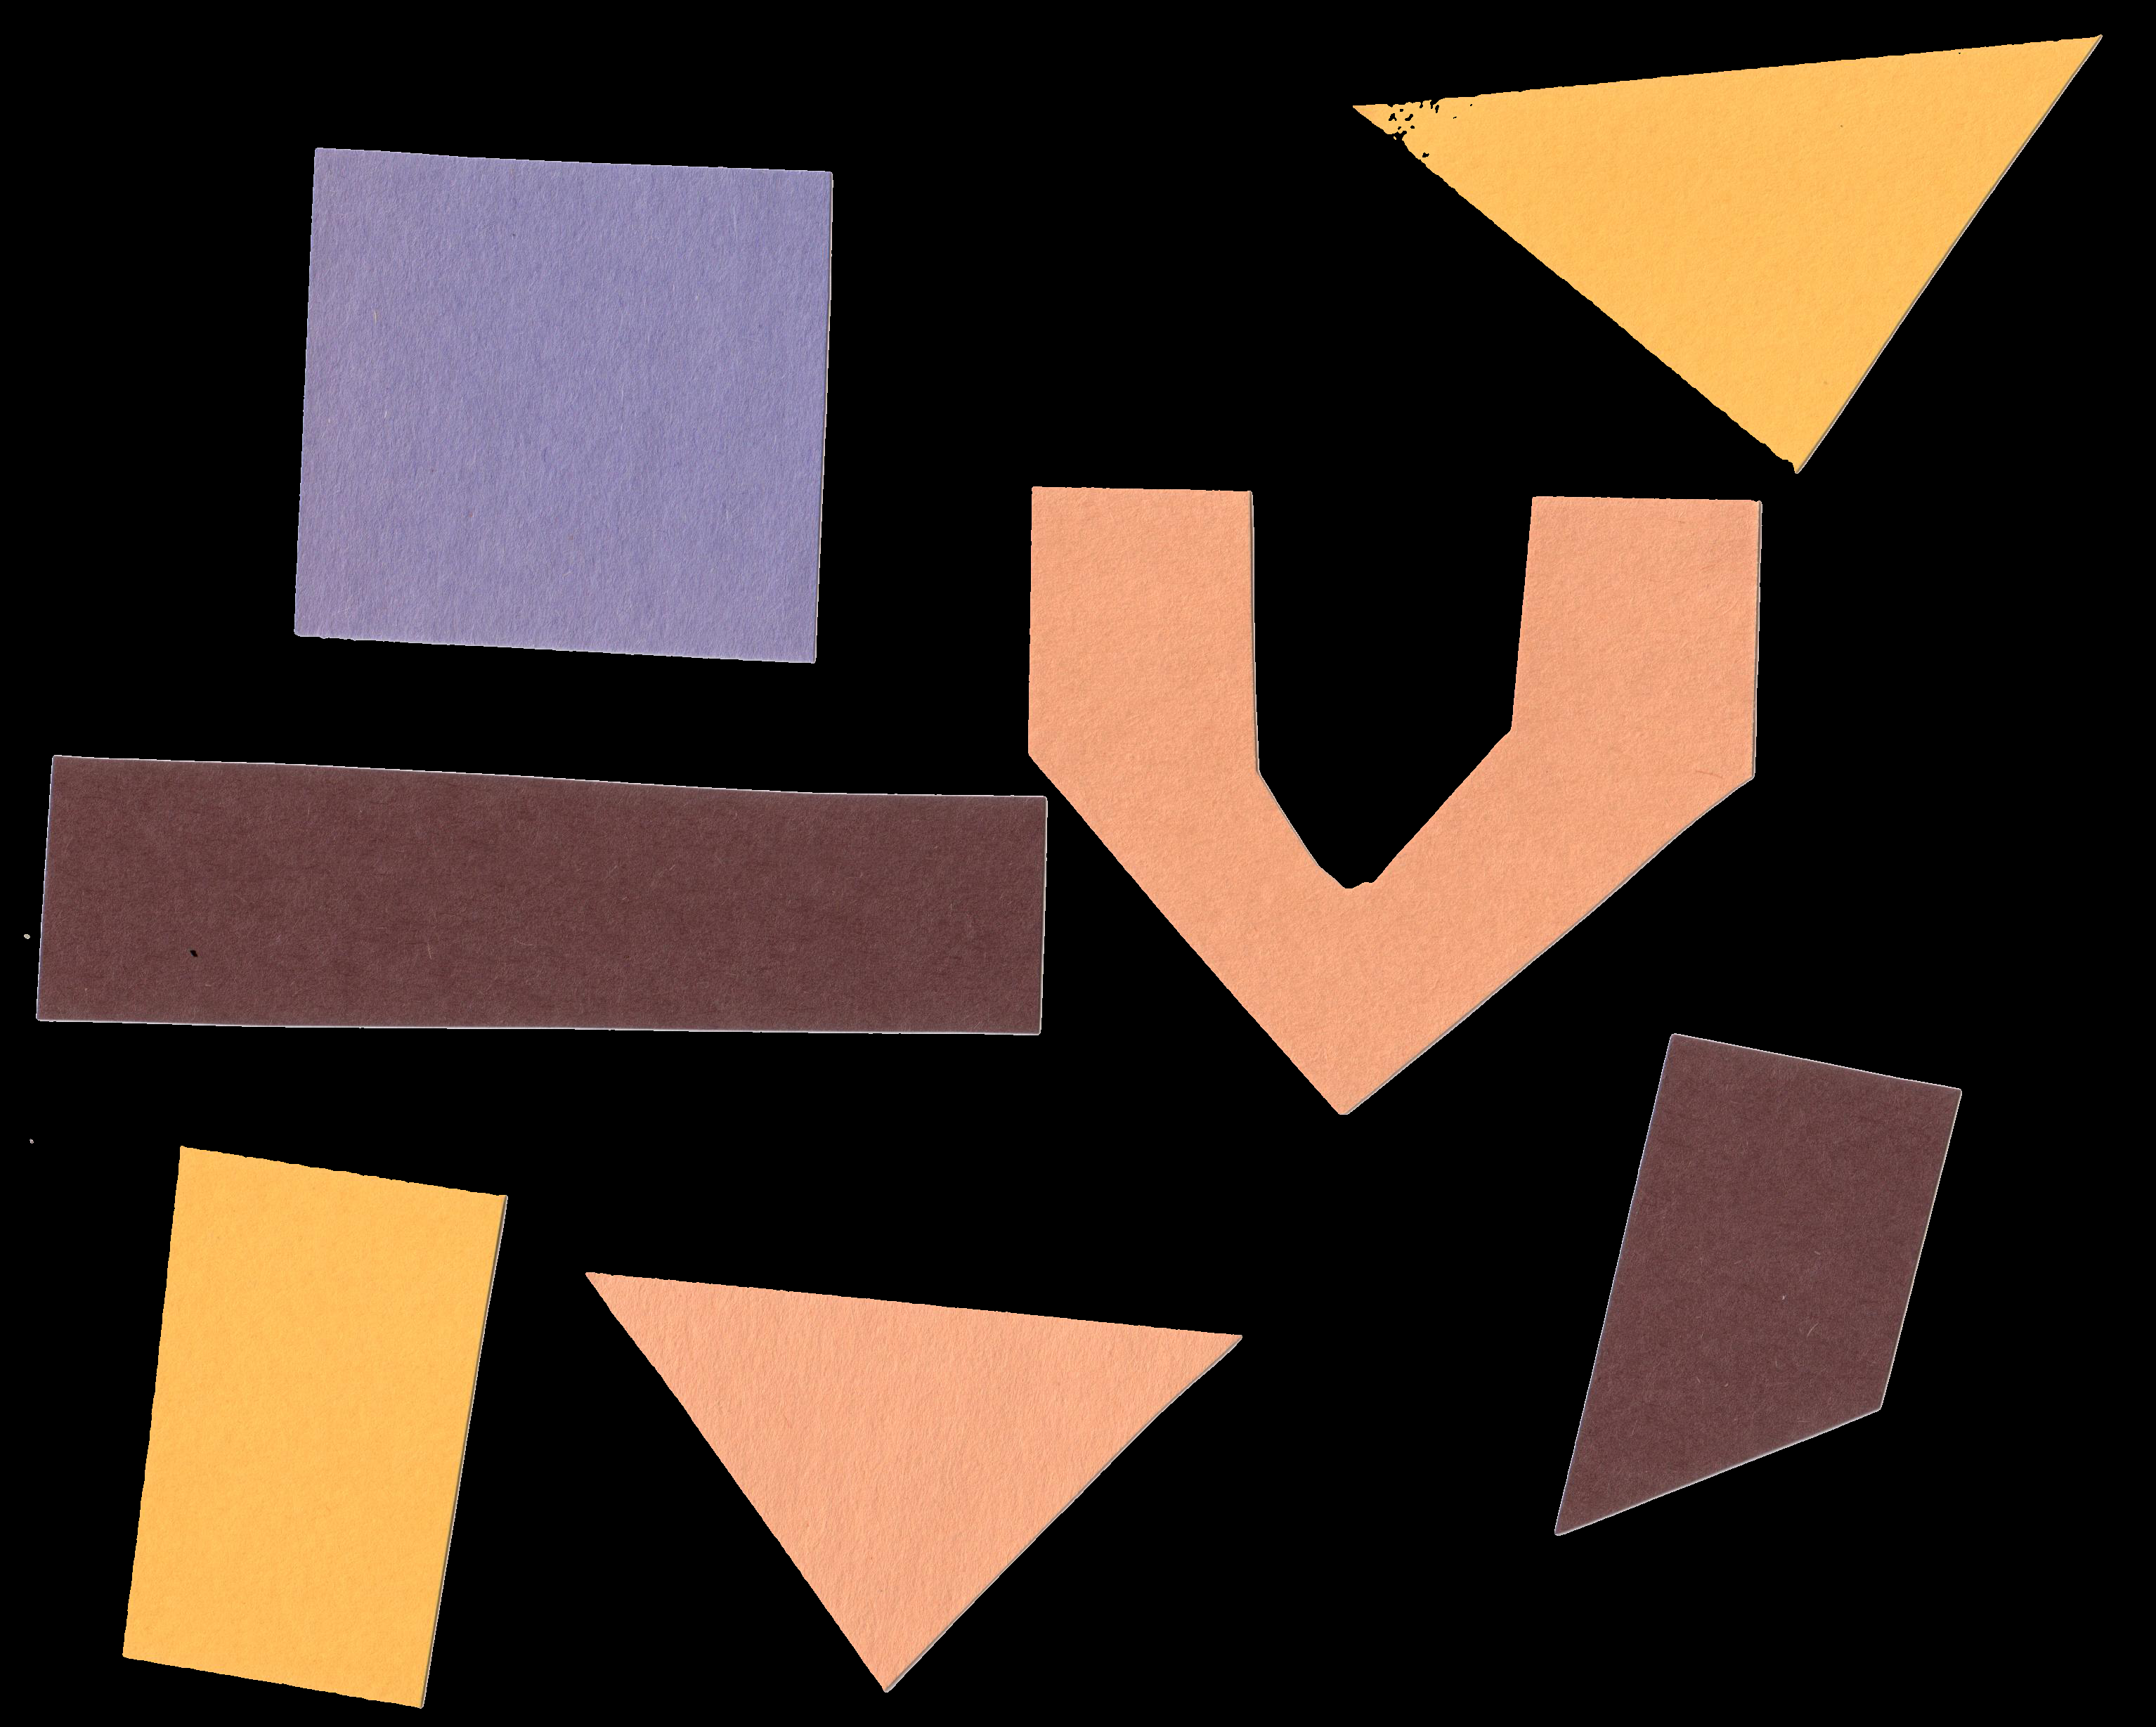
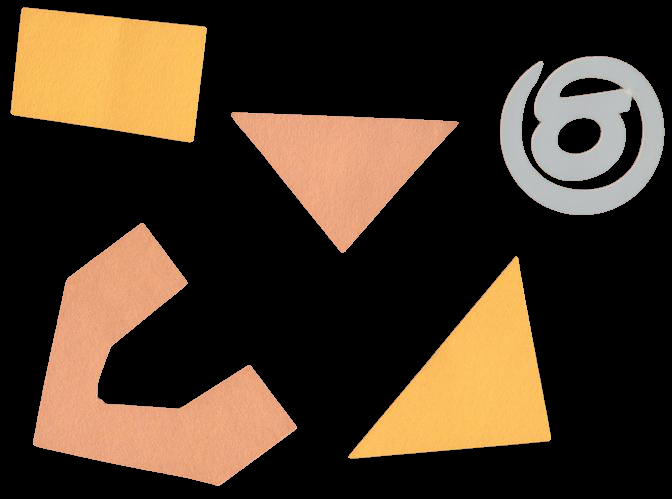
Image 1 of 1: ‘Another image with geometric shapes on white background’
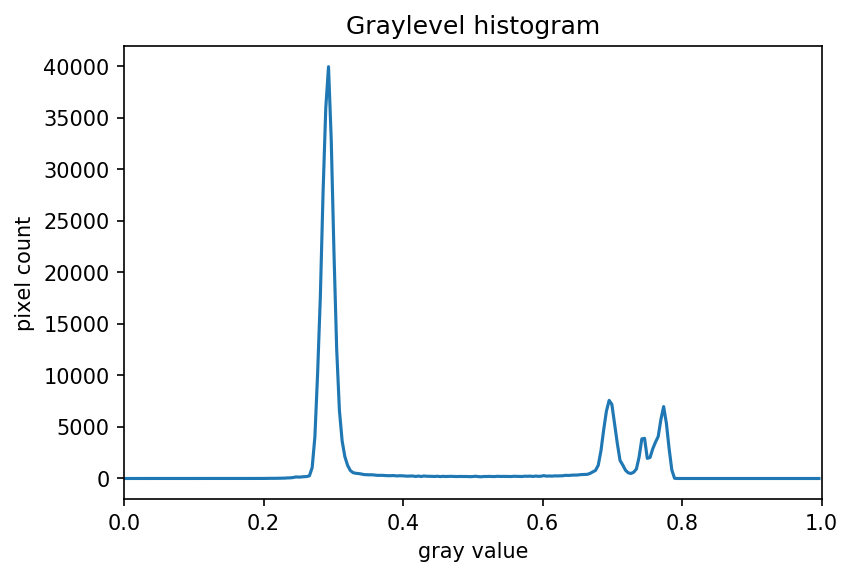
Image 1 of 1: ‘Grayscale histogram of the second geometric shapes image’
Image 1 of 1: ‘Binary mask created by thresholding the second geometric shapes image’
Image 1 of 1: ‘Selected shapes after applying binary mask to the second geometric shapes image’
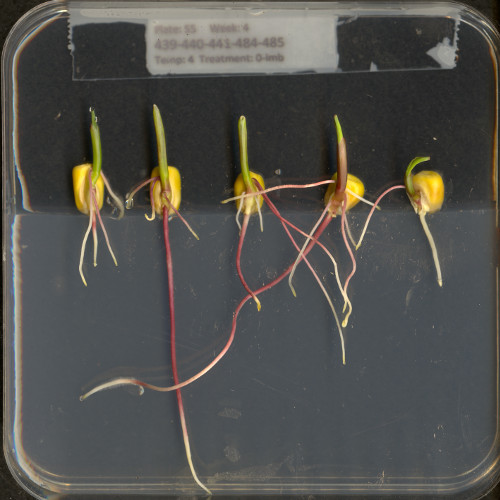
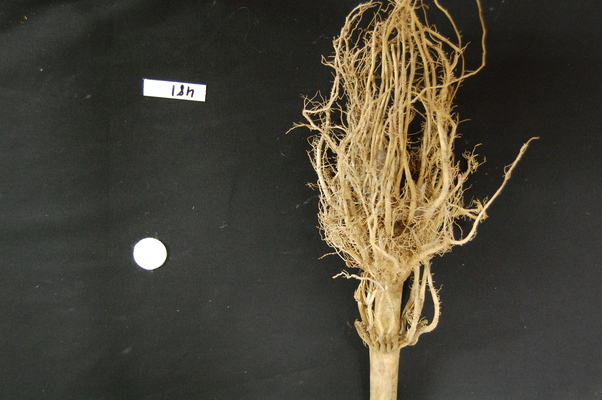
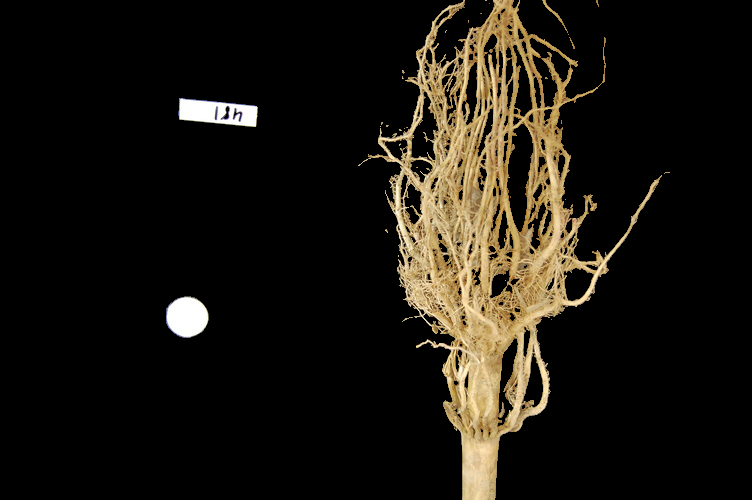
Image 1 of 1: ‘Image of a maize root’
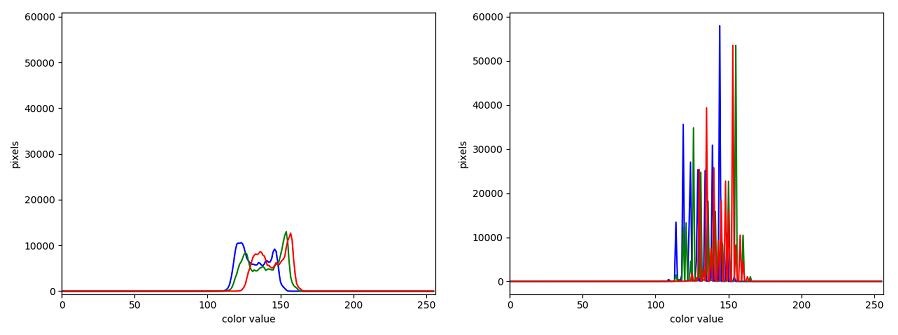
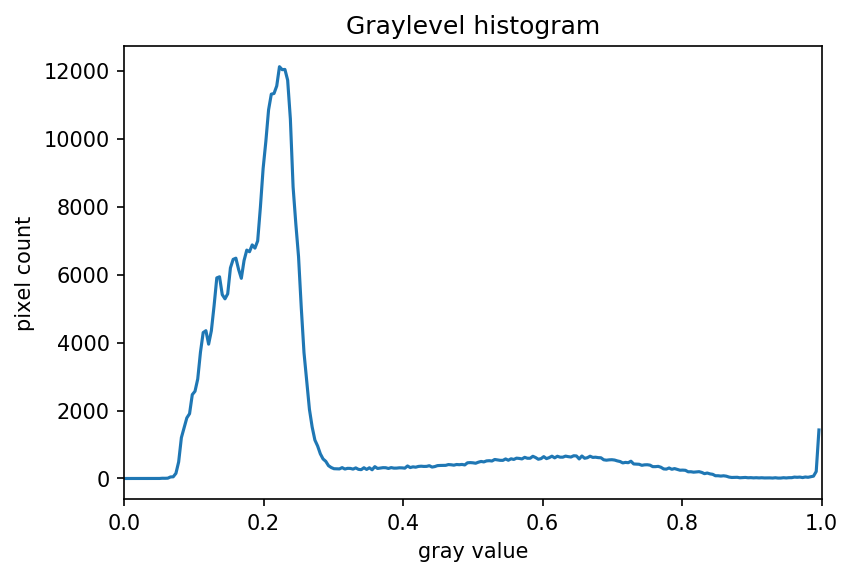
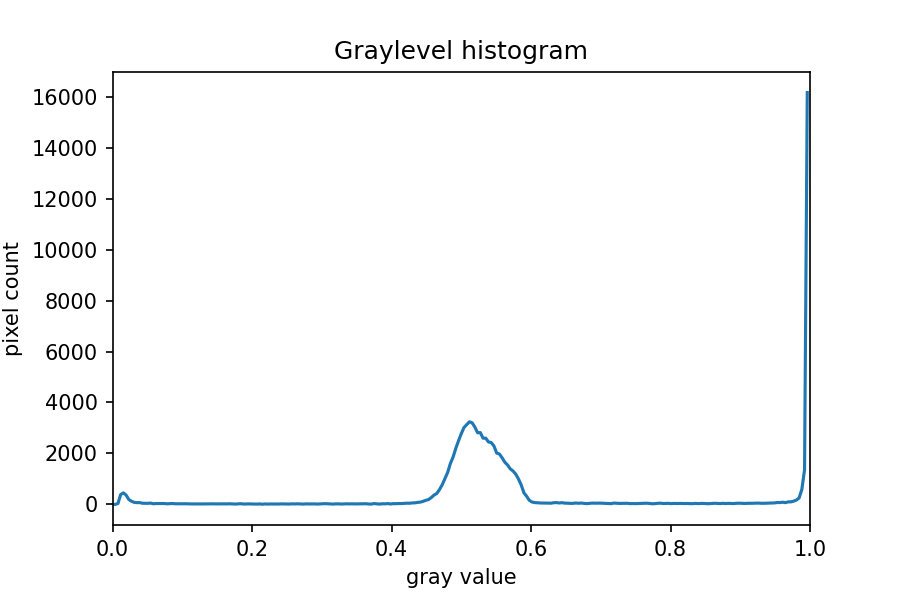
Image 1 of 1: ‘Grayscale histogram of the maize root image’
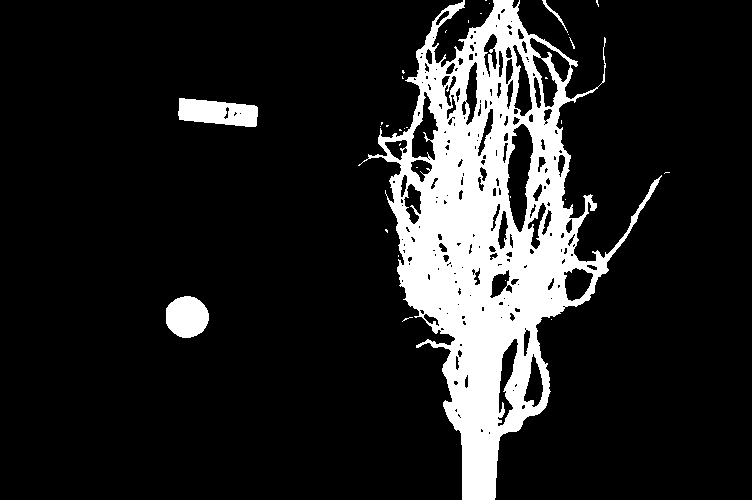
Image 1 of 1: ‘Binary mask of the maize root system’
Image 1 of 1: ‘Masked selection of the maize root system’
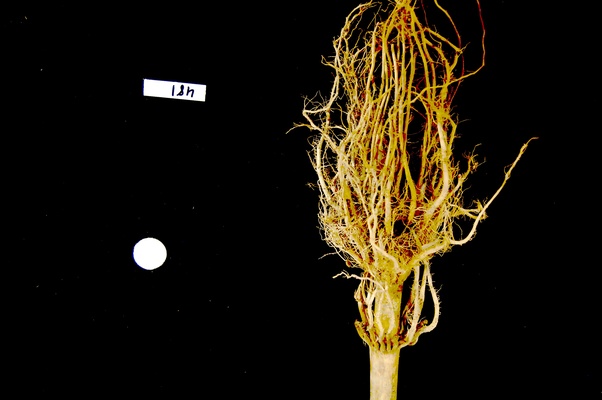
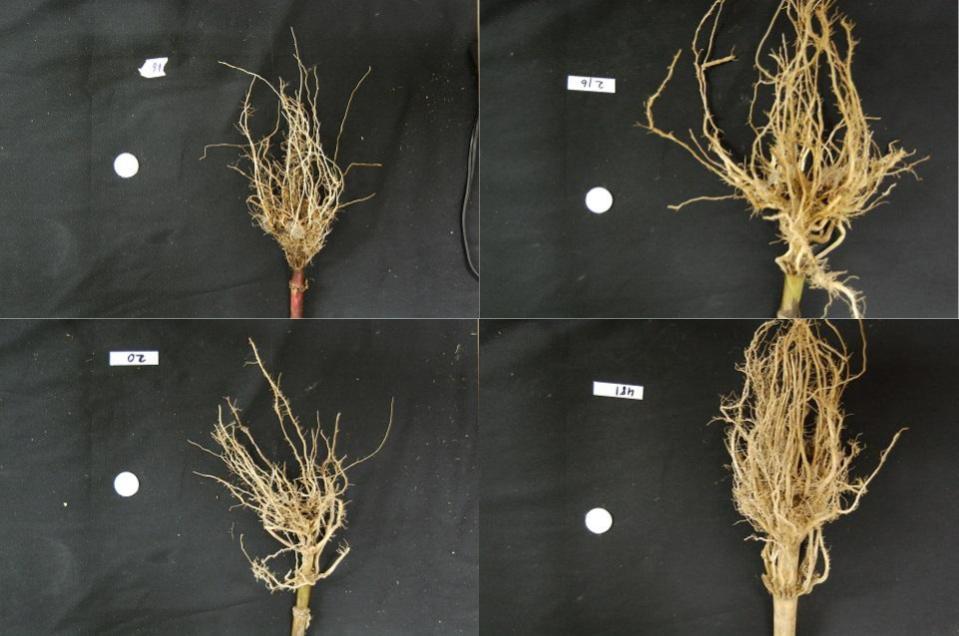
Image 1 of 1: ‘Four images of maize roots’
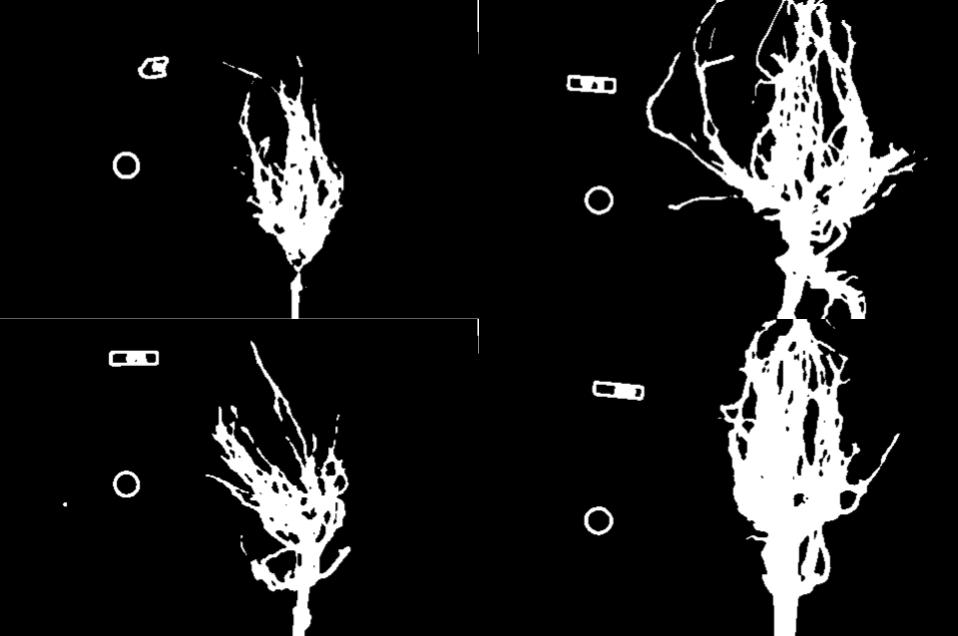
Image 1 of 1: ‘Binary masks of the four maize root images’
Image 1 of 1: ‘Improved binary masks of the four maize root images’
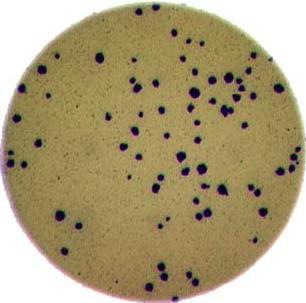
Image 1 of 1: ‘Image of bacteria colonies in a petri dish’
Image 1 of 1: ‘Grayscale histogram of the bacteria colonies image’
Image 1 of 1: ‘Binary mask of the bacteria colonies image’
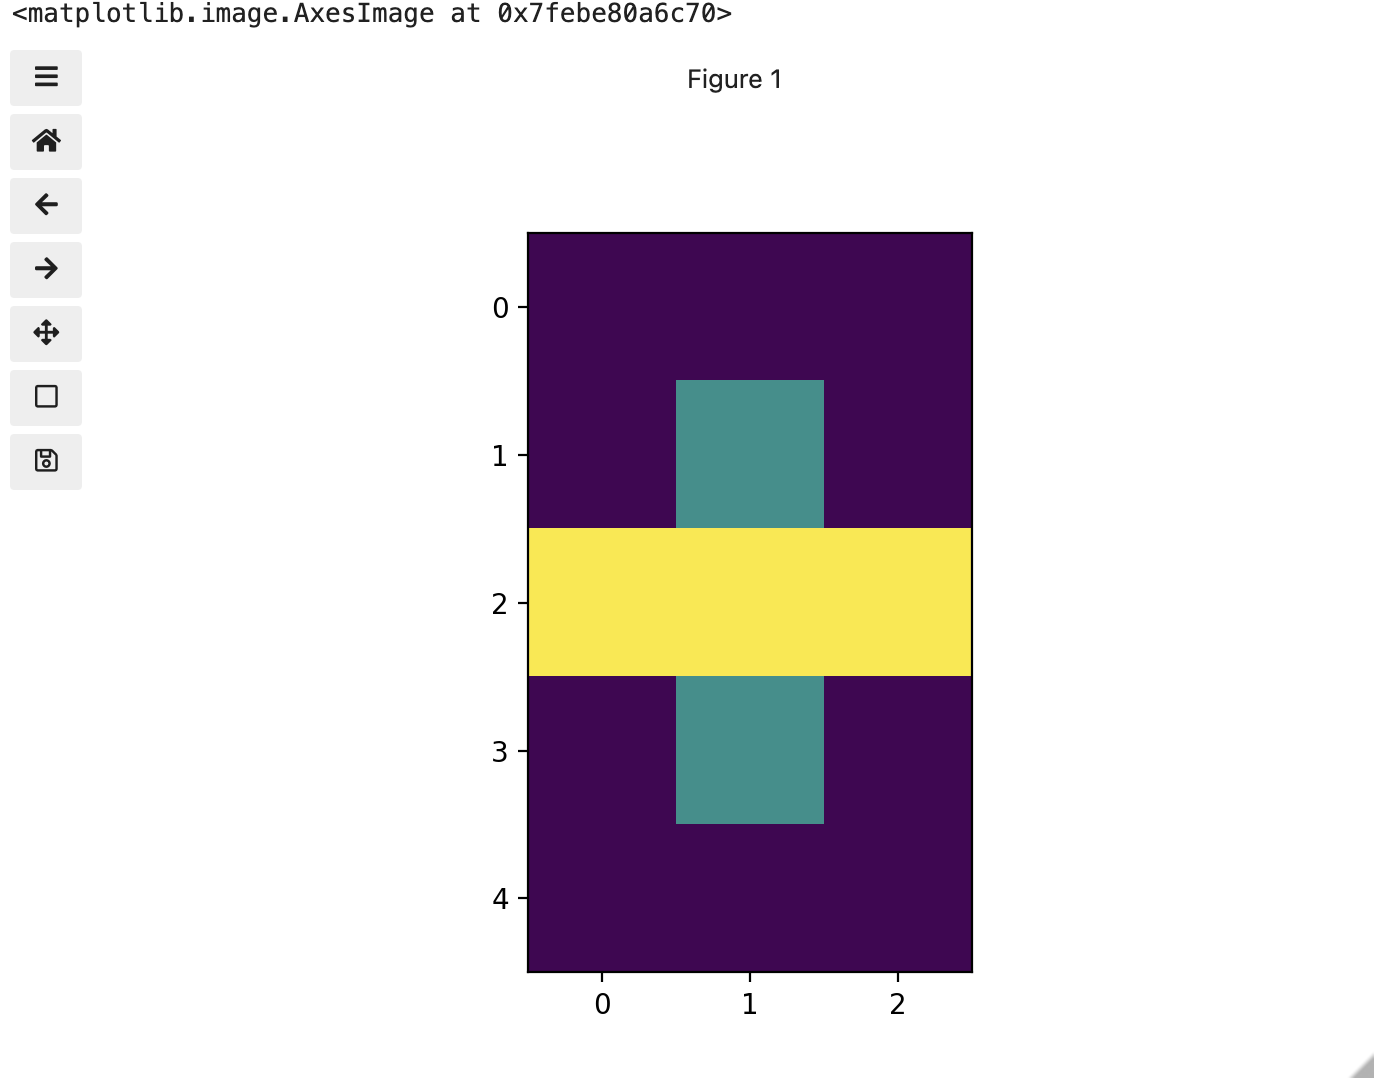
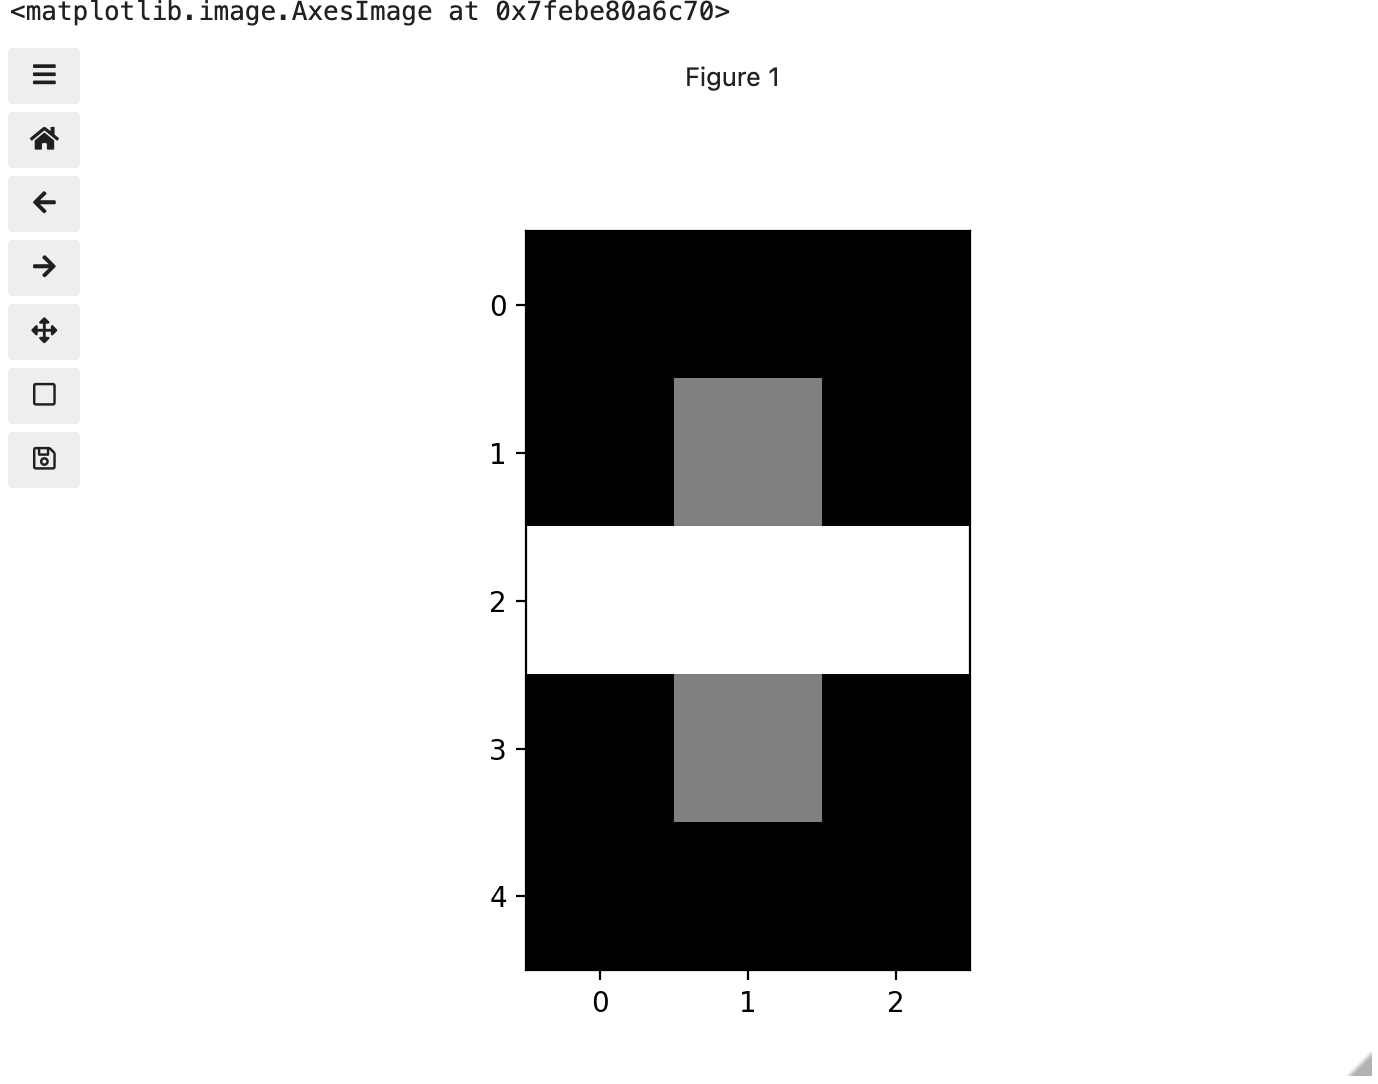
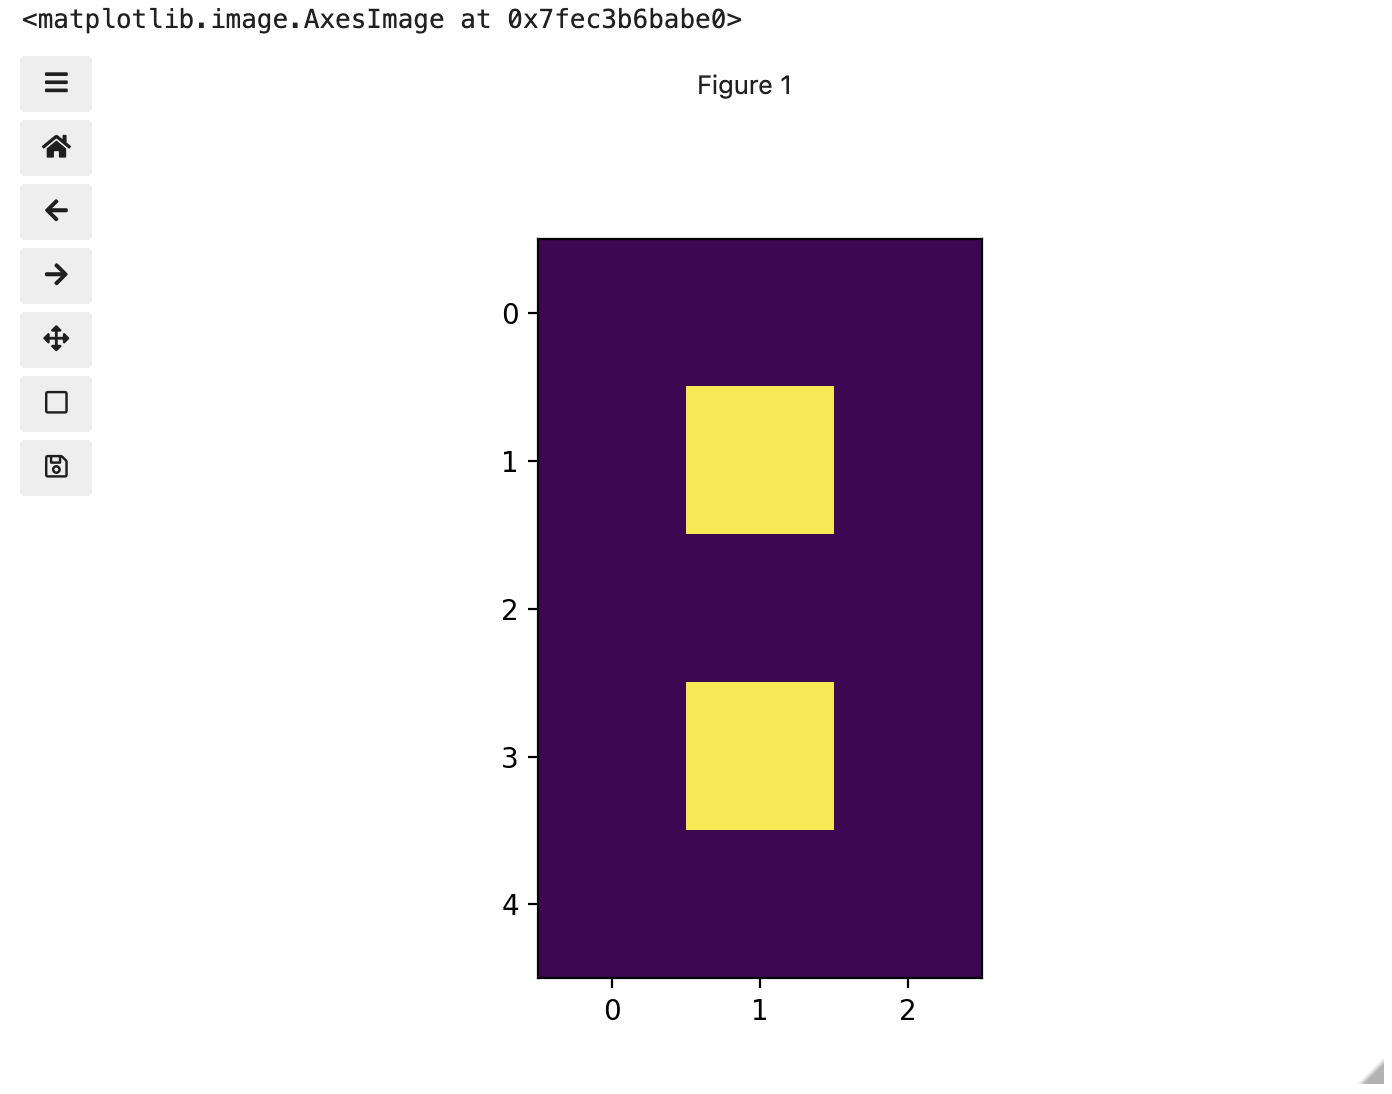
Figure 1
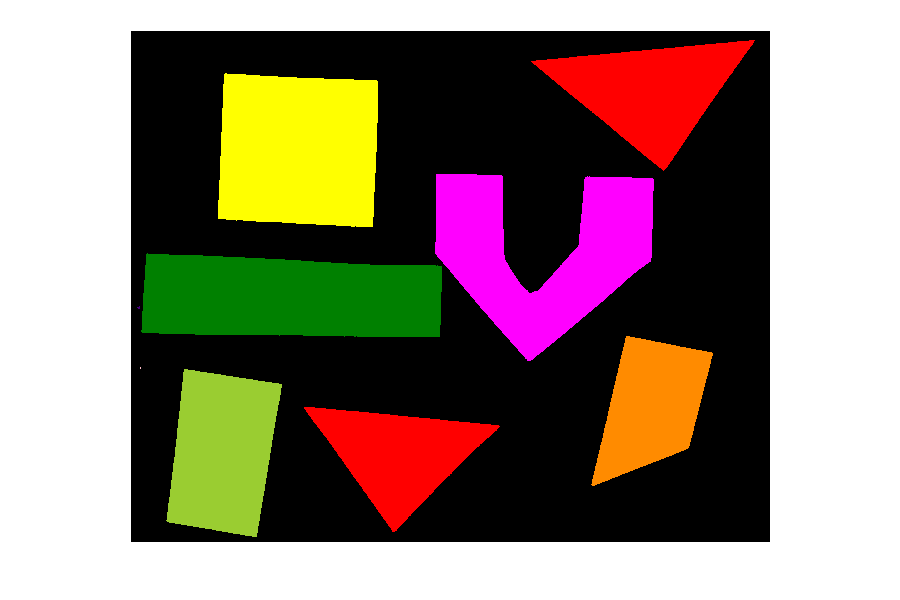
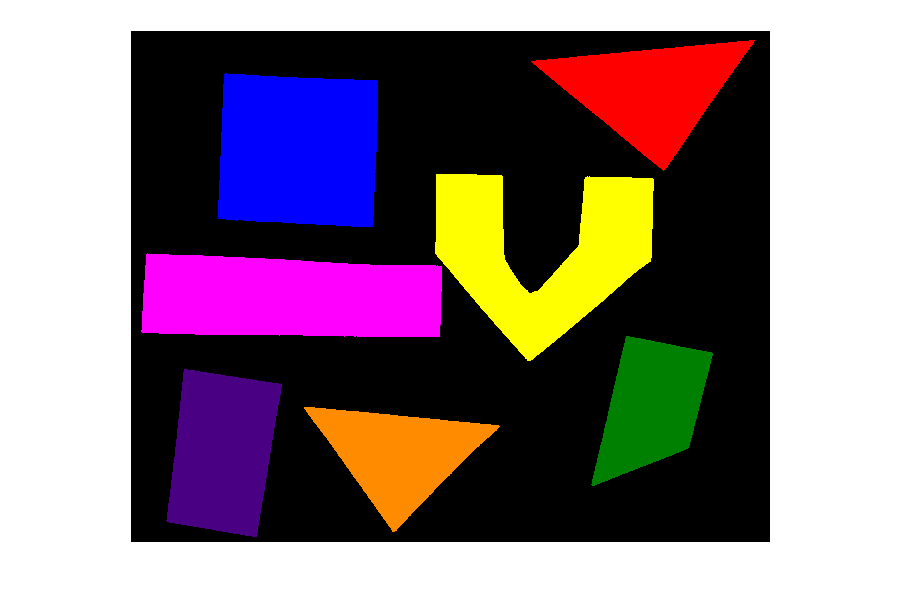
Image 1 of 1: ‘Original shapes image’
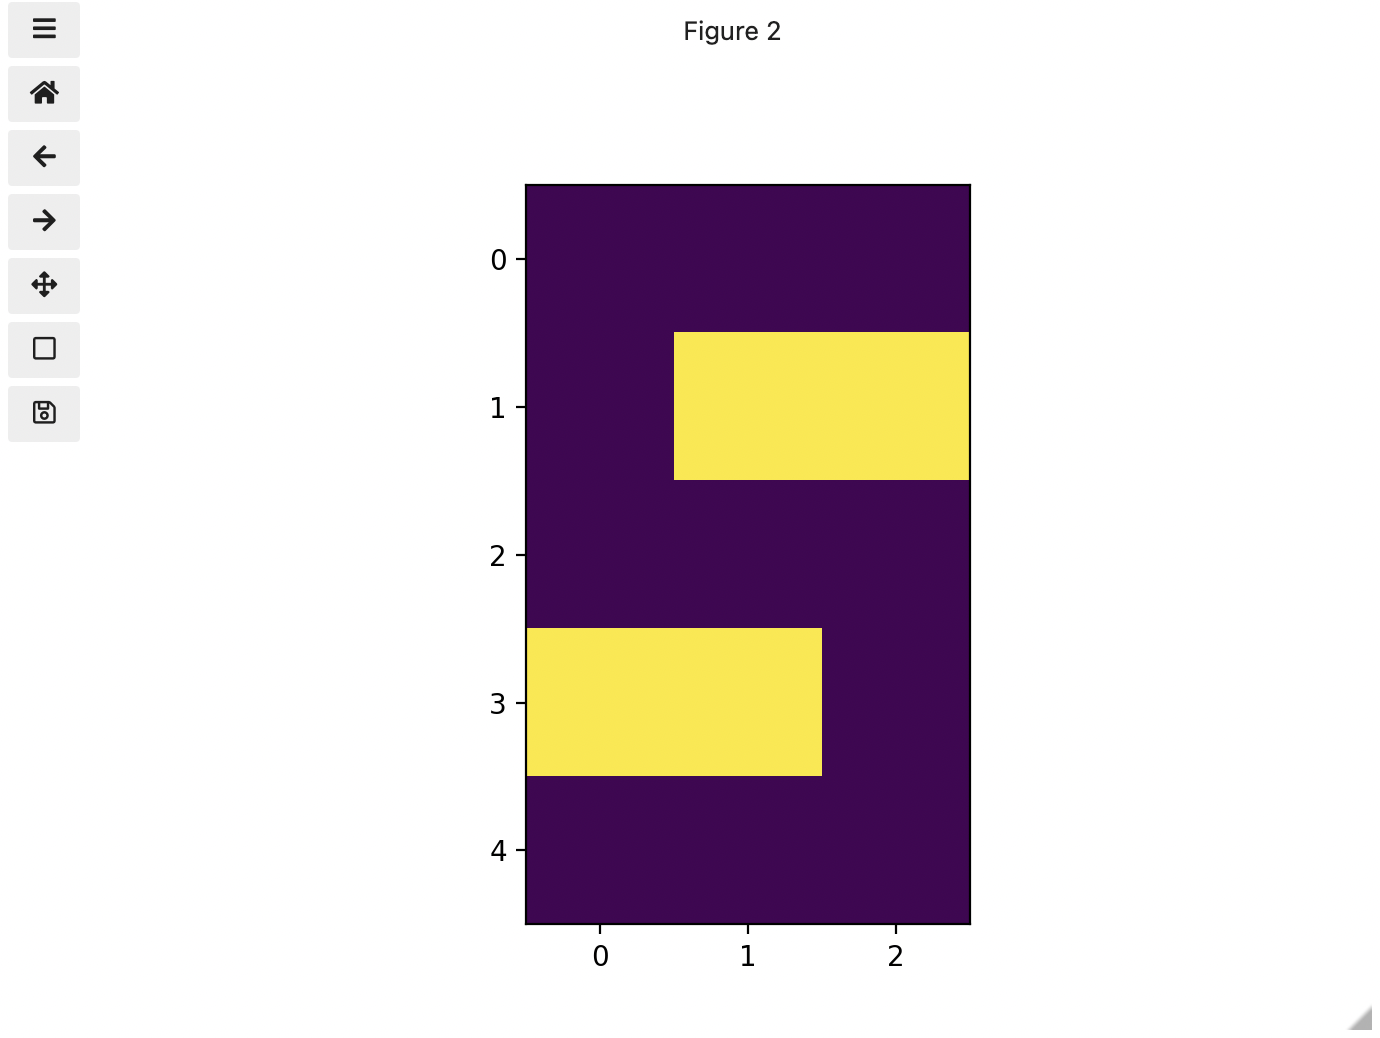
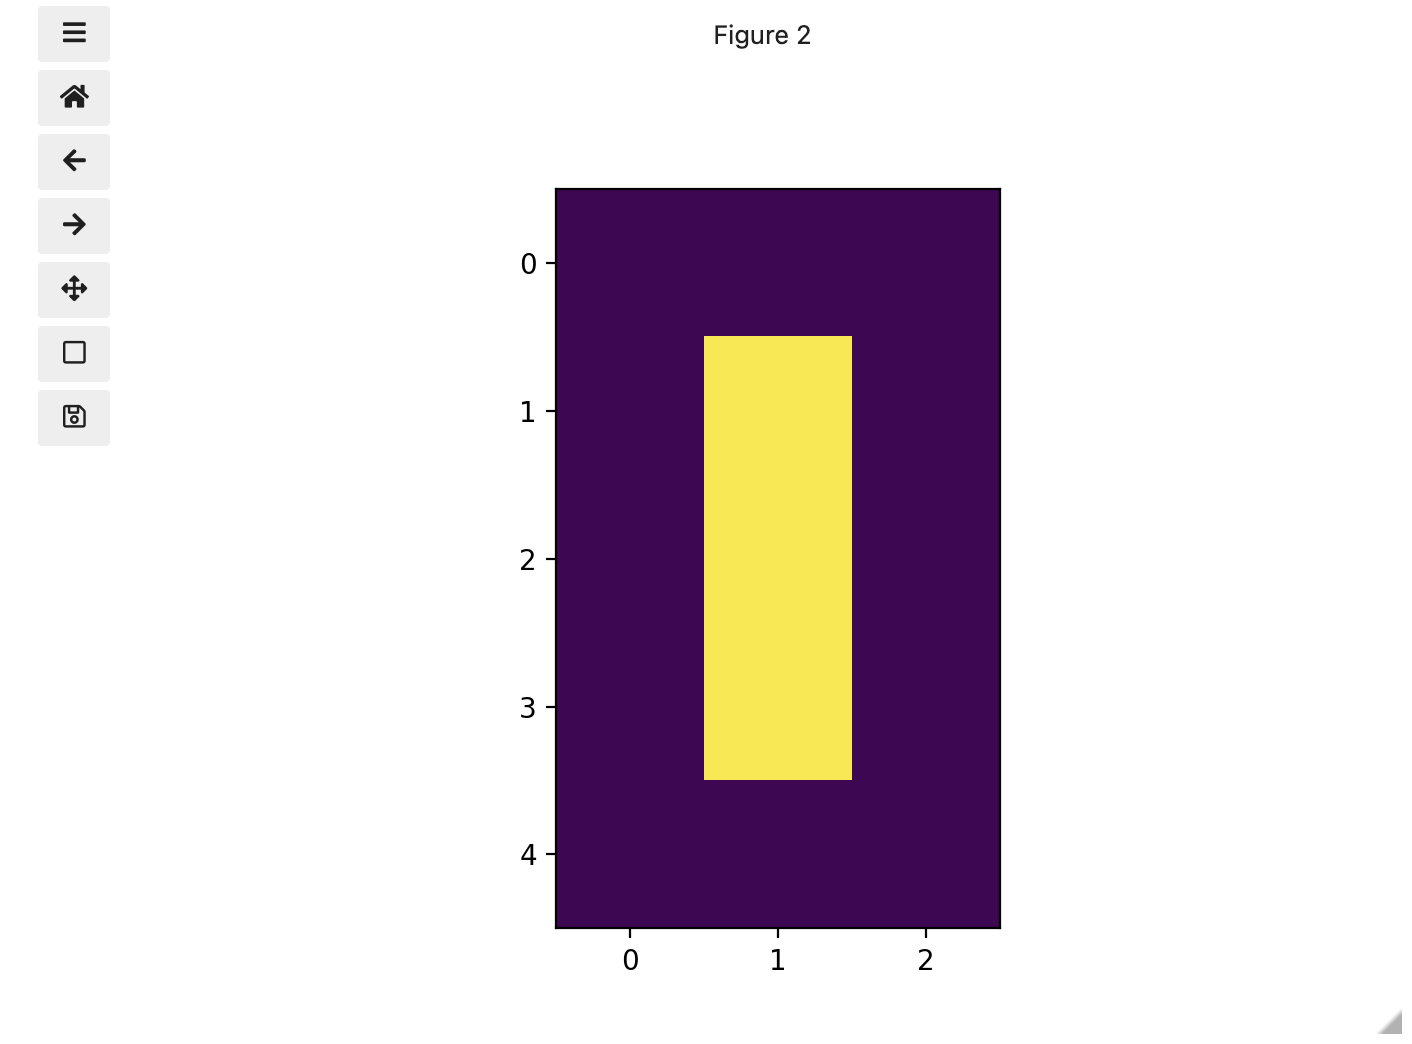
Figure 2
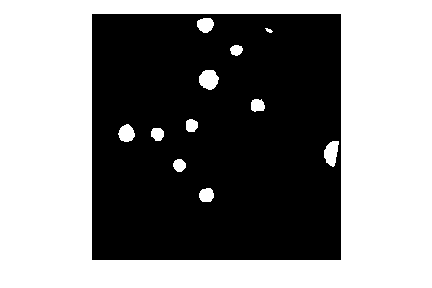
Image 1 of 1: ‘Mask created by thresholding’
Figure 3
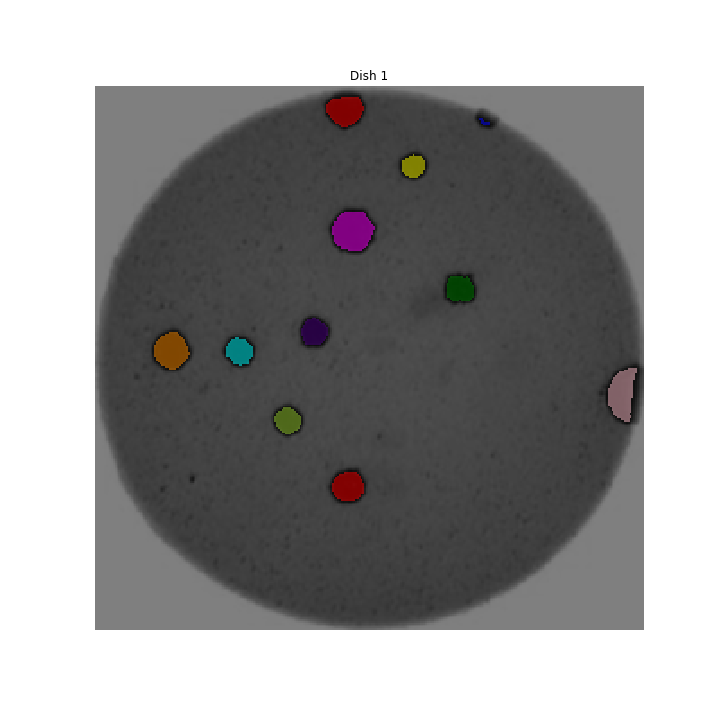
Image 1 of 1: ‘Labeled objects’
Figure 4
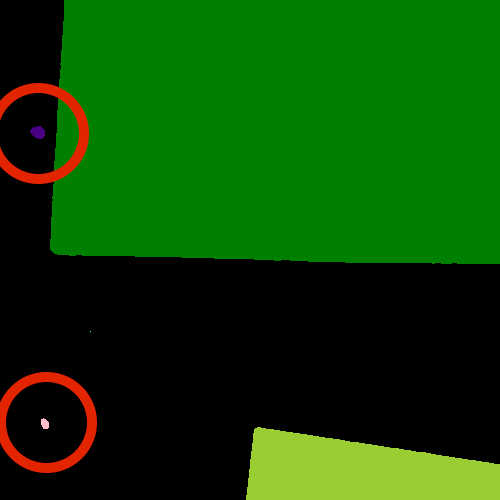
Image 1 of 1: ‘shapes-01.jpg mask detail’
Figure 5
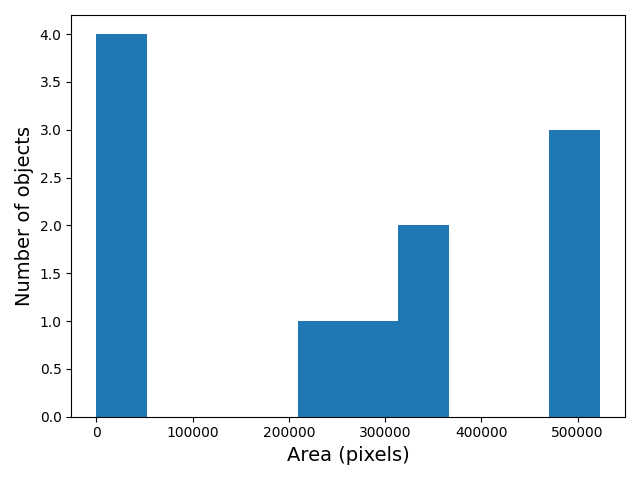
Image 1 of 1: ‘Histogram of object areas’
Figure 6
Image 1 of 1: ‘Objects filtered by area’
Figure 7
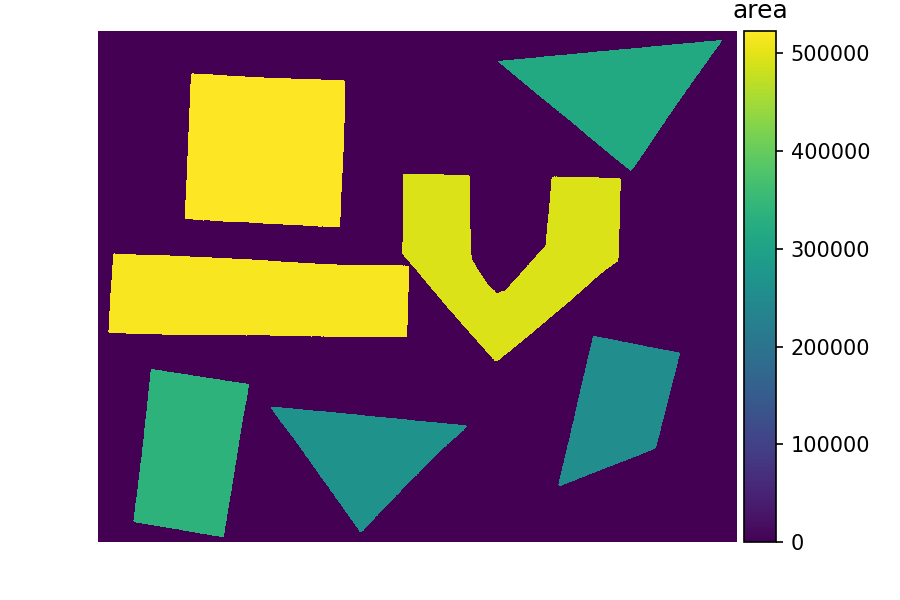
Image 1 of 1: ‘Objects colored by area’
Image 1 of 1: ‘Colony image 1’
Image 1 of 1: ‘Colony image 2’
Image 1 of 1: ‘Colony image 3’
Image 1 of 1: ‘Sample morphometric output’
Image 1 of 1: ‘Colony image 1’
Image 1 of 1: ‘Gray Colonies’
Image 1 of 1: ‘Histogram image’
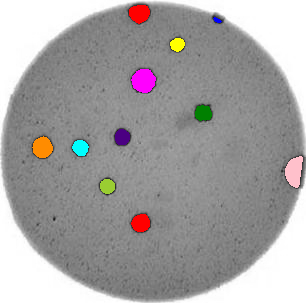
Image 1 of 1: ‘Colony mask image’
Image 1 of 1: ‘Sample morphometric output’
Image 1 of 3: ‘Colony 1 output’
Image 2 of 3: ‘Colony 2 output’
Image 3 of 3: ‘Colony 3 output’
 This is called a left-hand coordinate system. If you hold your
left hand in front of your face and point your thumb at the floor, your
extended index finger will correspond to the x-axis while your thumb
represents the y-axis.
This is called a left-hand coordinate system. If you hold your
left hand in front of your face and point your thumb at the floor, your
extended index finger will correspond to the x-axis while your thumb
represents the y-axis.